Housing density: 565 houses/condos per square mile
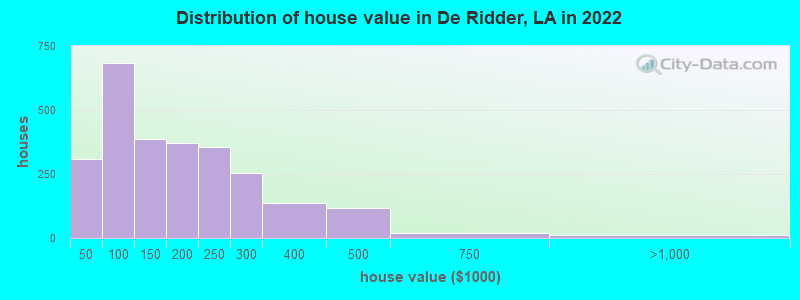
Median price asked for vacant for-sale houses and condos in 2022: $147,809.
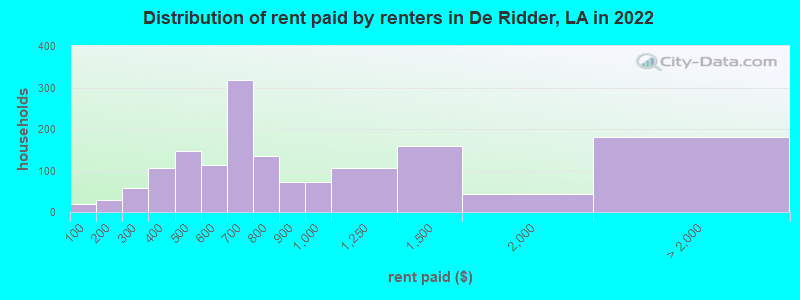
Median contract rent in 2022: $649 (lower quartile is $478, upper quartile is $973)
Median rent asked for vacant for-rent units in 2022: $736
Median gross rent in De Ridder, LA in 2022: $924
Housing units in De Ridder with a mortgage: 1,328 (35 second mortgage, 0 home equity loan, 20 both second mortgage and home equity loan) Houses without a mortgage: 30
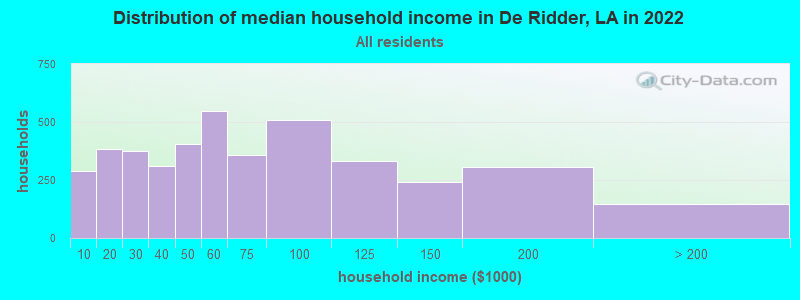
Median household income for houses/condos with a mortgage: $89,210
Median household income for apartments without a mortgage: $52,824
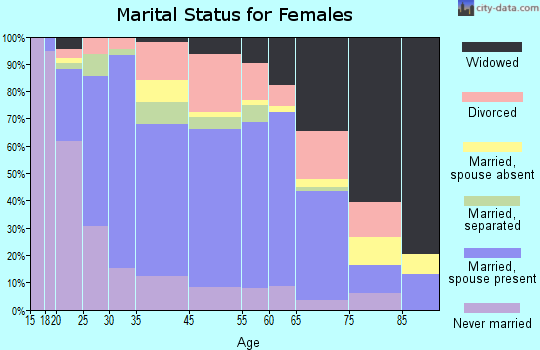
844 married couples with children.
972 single-parent households (211 men, 761 women).
94.8% of residents of De Ridder speak English at home.
3.3% of residents speak Spanish at home (78% speak English very well, 15% speak English well, 5% speak English not well, 3% don't speak English at all).
1.5% of residents speak other Indo-European language at home (91% speak English very well, 6% speak English well, 3% don't speak English at all).
0.3% of residents speak Asian or Pacific Island language at home (52% speak English very well, 26% speak English well, 22% speak English not well).
0.3% of residents speak other language at home (84% speak English very well, 16% speak English well).
Foreign born population: 250 (2.6%)
(47.6% of them are naturalized citizens)
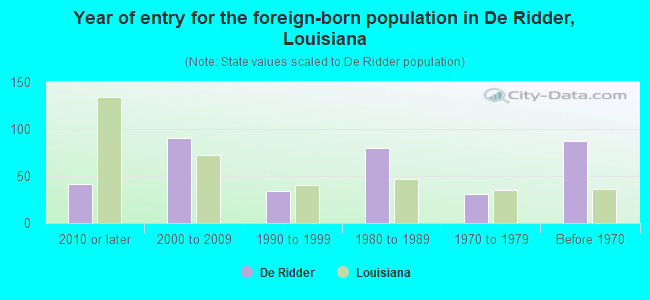
Year of entry for the foreign-born population in De Ridder, Louisiana
412010 or later
902000 to 2009
341990 to 1999
801980 to 1989
311970 to 1979
87Before 1970
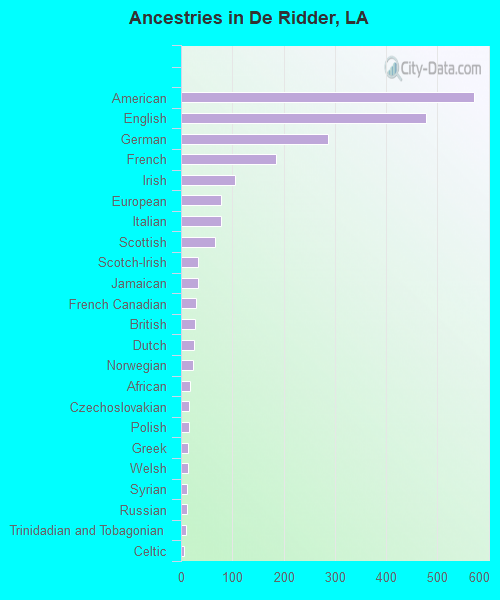
First ancestries reported:
American: 572 (11.1%)
English: 477 (9.3%)
German: 286 (5.6%)
French: 186 (3.6%)
Irish: 105 (2.0%)
European: 78 (1.5%)
Italian: 78 (1.5%)
Scottish: 66 (1.3%)
Scotch-Irish: 34 (0.7%)
Jamaican: 33 (0.6%)
French Canadian: 30 (0.6%)
British: 28 (0.5%)
Dutch: 26 (0.5%)
Norwegian: 23 (0.4%)
African: 17 (0.3%)
Czechoslovakian: 16 (0.3%)
Polish: 16 (0.3%)
Greek: 14 (0.3%)
Welsh: 13 (0.3%)
Syrian: 12 (0.2%)
Russian: 11 (0.2%)
Trinidadian and Tobagonian: 9 (0.2%)
Celtic: 6 (0.1%)
Guyanese: 4 (0.08%)
Nigerian: 4 (0.08%)
South African: 4 (0.08%)
Cajun: 3 (0.06%)
Ukrainian: 3 (0.06%)
Danish: 2 (0.04%)
Swedish: 2 (0.04%)
Belizean: 2 (0.04%)
Scandinavian: 1 (0.02%)
Most common places of birth for foreign-born residents (%):
Mexico
De Ridder:
21.5% (56)
Louisiana:
12.1% (23,732)
Germany
De Ridder:
15.4% (40)
Louisiana:
1.6% (3,186)
Philippines
De Ridder:
6.5% (17)
Louisiana:
3.1% (6,086)
Nicaragua
De Ridder:
5.8% (15)
Louisiana:
2.1% (4,115)
Jamaica
De Ridder:
5.0% (13)
Louisiana:
0.7% (1,460)
Colombia
De Ridder:
4.6% (12)
Louisiana:
1.0% (1,918)
India
De Ridder:
4.2% (11)
Louisiana:
3.9% (7,741)
Pakistan
De Ridder:
3.8% (10)
Louisiana:
1.2% (2,282)
Guyana
De Ridder:
3.5% (9)
Louisiana:
0.3% (505)
Bosnia and Herzegovina
De Ridder:
3.1% (8)
Louisiana:
0.1% (203)
El Salvador
De Ridder:
3.1% (8)
Louisiana:
2.2% (4,241)
Cambodia
De Ridder:
2.7% (7)
Louisiana:
0.2% (483)
South Africa
De Ridder:
2.7% (7)
Louisiana:
0.3% (550)
Korea
De Ridder:
2.3% (6)
Louisiana:
1.0% (1,951)
Vietnam
De Ridder:
1.5% (4)
Louisiana:
9.2% (18,115)
China, excluding Hong Kong and Taiwan
De Ridder:
1.5% (4)
Louisiana:
3.4% (6,779)
Place of birth for U.S.-born residents:
This state: 5,659
Other state: 3,665
Northeast: 288
Midwest: 498
South: 2,211
West: 651
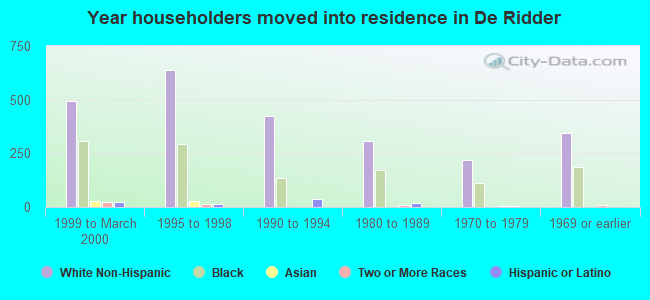
85.5% of De Ridder residents lived in the same house 1 years ago. Out of people who lived in different houses, 25.6% lived in this county. Out of people who lived in different counties, 49.7% lived in Louisiana.
De Ridder:
85.5%
State average:
88.3%
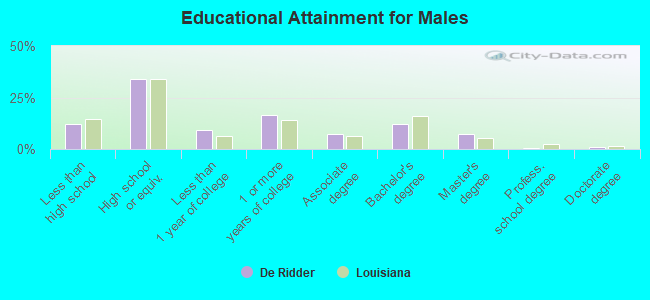
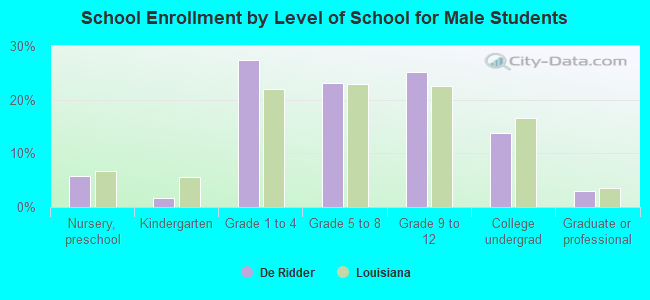
Education attainment for males 25 years and older:
No schooling: 26
Nursery to 4th grade: 0
5th and 6th grade: 9
7th and 8th grade: 81
9th grade: 67
10th grade: 108
11th grade: 57
12th grade, no diploma: 61
High school graduate (or equivalency): 1,136
Less than 1 year of college: 310
Some college more than 1 year, no degree: 556
Associate degree: 252
Bachelor's degree: 409
Master's degree: 240
Professional school degree: 11
Doctorate degree: 26
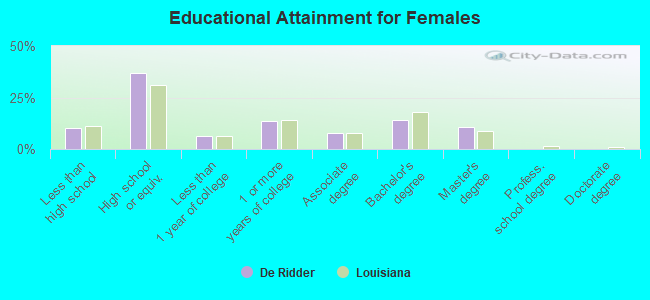
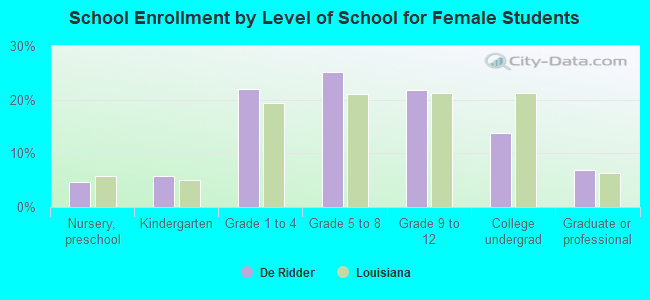
Education attainment for females 25 years and older:
No schooling: 47
Nursery to 4th grade: 7
5th and 6th grade: 16
7th and 8th grade: 45
9th grade: 55
10th grade: 81
11th grade: 49
12th grade, no diploma: 47
High school graduate (or equivalency): 1,264
Less than 1 year of college: 211
Some college more than 1 year, no degree: 464
Associate degree: 271
Bachelor's degree: 483
Master's degree: 365
Professional school degree: 4
Doctorate degree: 6
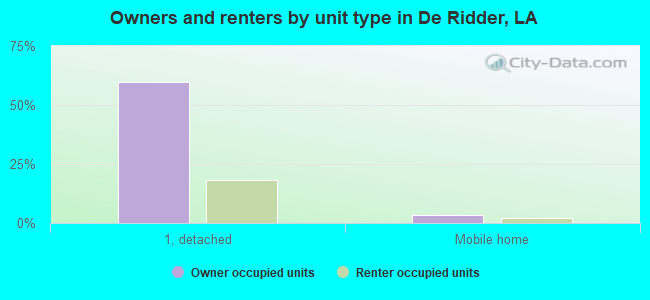
Housing units in structures:
One, detached: 3,704
One, attached: 46
Two: 131
3 or 4: 179
5 to 9: 243
10 to 19: 3
20 to 49: 19
50 or more: 142
Mobile homes: 326
Median worth of mobile homes: $63,724
Housing units lacking complete plumbing facilities in 2022: 5.9%
Housing units lacking complete kitchen facilities in 2022: 4.5%
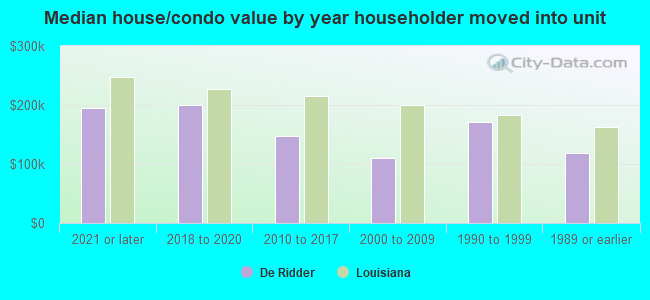
House/condo owner moved in on average 15 years ago