Dearborn, MI (Michigan) Houses and Residents
Estimated median house or condo value in 2022: $215,100 (it was $129,300 in 2000 )
Dearborn:
$215,100Michigan:
$224,400
Lower value quartile - upper value quartile: $167,000 - $294,900Mean price in 2022: Detached houses: $245,791 Here:
$245,791State:
$280,038
Townhouses or other attached units: $294,238 Here:
$294,238State:
$239,520
In 2-unit structures: $190,143 Here:
$190,143State:
$219,481
In 3-to-4-unit structures: $200,731 Here:
$200,731State:
$207,067
In 5-or-more-unit structures: $141,806 Here:
$141,806State:
$192,733
Mobile homes: $220,020 Here:
$220,020State:
$72,868
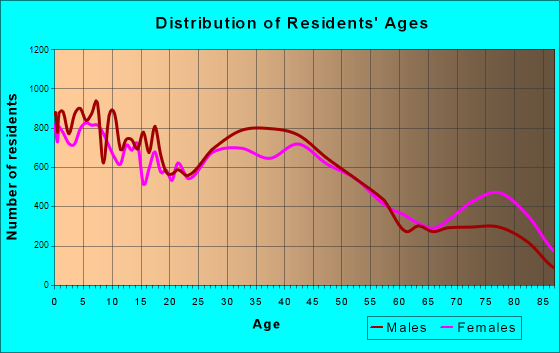
Total population: 95,535 (All urban)
Houses: 40,015 (36,656 occupied: 26,025 owner occupied, 10,631 renter occupied )
% of renters here:
29%State:
27%
Housing density: 1,642 houses/condos per square mile
Median price asked for vacant for-sale houses and condos in 2022: $402,911.
Median contract rent in 2022: $1,072 (lower quartile is $712, upper quartile is $1,646)
Median rent asked for vacant for-rent units in 2022: $1,950
Median gross rent in Dearborn, MI in 2022: $1,289
Housing units in Dearborn with a mortgage: 13,849 (691 second mortgage, 70 home equity loan, 570 both second mortgage and home equity loan )Houses without a mortgage: 343
Median household income for houses/condos with a mortgage: $78,144
Median household income for apartments without a mortgage: $63,183
Median monthly housing costs: $1,147
Data:
Median house or condo value ($)
Median house or condo value ($ change since 2000)
Median house or condo value ($) - White
Median house or condo value ($) - Black or African American
Median house or condo value ($) - Asian
Median house or condo value ($) - Hispanic or Latino
Median house or condo value ($) - American Indian and Alaska Native
Median house or condo value ($) - Multirace
Median house or condo value ($) - Other Race
Median price asked for mobile homes ($)
Household density (households per square mile)
Mean house or condo value by units in structure - 1, detached ($)
Mean house or condo value by units in structure - 1, attached ($)
Mean house or condo value by units in structure - 2 ($)
Mean house or condo value by units in structure by units in structure - 3 or 4 ($)
Mean house or condo value by units in structure - 5 or more ($)
Mean house or condo value by units in structure - Boat, RV, van, etc. ($)
Mean house or condo value by units in structure - Mobile home ($)
Median contract rent ($)
Median contract rent - Lower quartile ($)
Median contract rent - Upper quartile ($)
Median gross rent ($)
Urban houses (%)
Rural houses (%)
Houses occupied (%)
Houses occupied (% change since 2000)
Houses owner occupied (%)
Houses owner occupied (% change since 2000)
Houses renter occupied (%)
Houses renter occupied (% change since 2000)
Vacant housing units - For rent (%)
Vacant housing units - For rent (% change since 2000)
Vacant housing units - For sale only (%)
Vacant housing units - For sale only (% change since 2000)
Vacant housing units - Rented or sold, not occupied (%)
Vacant housing units - Rented or sold, not occupied (% change since 2000)
Vacant housing units - For seasonal, recreational, or occasional use (%)
Vacant housing units - For seasonal, recreational, or occasional use (% change since 2000)
Vacant housing units - For migrant workers (%)
Vacant housing units - For migrant workers (% change since 2000)
Vacant housing units - Other vacant (%)
Vacant housing units - Other vacant (% change since 2000)
Median monthly housing costs ($)
Median household income for houses/condos with a mortgage ($)
Median household income for houses/condos without a mortgage ($)
Median household income ($)
Median household income ($) - White
Median household income ($) - Black or African American
Median household income ($) - Asian
Median household income ($) - Hispanic or Latino
Median household income ($) - American Indian and Alaska Native
Median household income ($) - Multirace
Median household income ($) - Other Race
Mortgage status - with mortgage (%)
Mortgage status - with second mortgage (%)
Mortgage status - with home equity loan (%)
Mortgage status - with both second mortgage and home equity loan (%)
Mortgage status - without a mortgage (%)
Median year house/condo built
Median year apartment built
Household type by relationship - Male householder living alone (%)
Household type by relationship - Male householder not living alone (%)
Household type by relationship - Female householder living alone (%)
Household type by relationship - Female householder not living alone (%)
Household type by relationship - Opposite-Sex spouse (%)
Household type by relationship - Same-Sex spouse (%)
Household type by relationship - Opposite-Sex unmarried partner (%)
Household type by relationship - Same-Sex unmarried partner (%)
Household type by relationship - In group quarters (%)
Size of family households - 2-person household (%)
Size of family households - 3-person household (%)
Size of family households - 4-person household (%)
Size of family households - 5-person household (%)
Size of family households - 6-person household (%)
Size of family households - 7-or-more-person household (%)
Size of nonfamily households - 1-person household (%)
Size of nonfamily households - 2-person household (%)
Size of nonfamily households - 3-person household (%)
Size of nonfamily households - 4-person household (%)
Size of nonfamily households - 5-person household (%)
Size of nonfamily households - 6-person household (%)
Size of nonfamily households - 7-or-moreperson household (%)
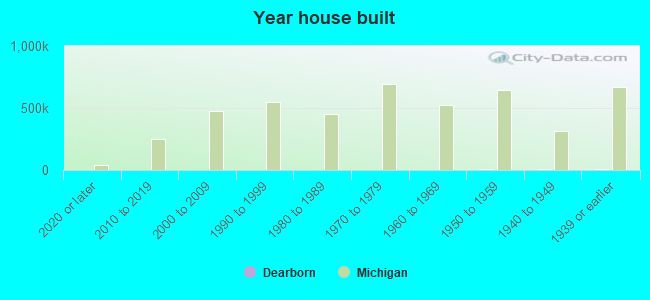
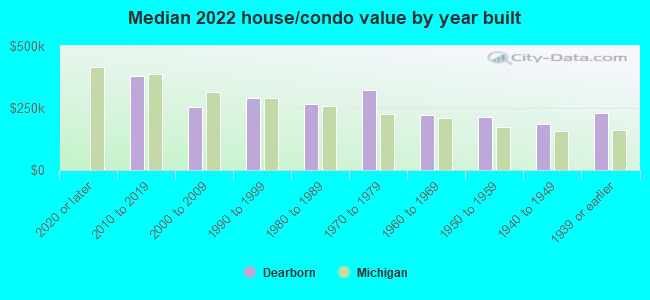
Year house built - Built 2010 or later (%)
Year house built - Built 2000 to 2009 (%)
Year house built - Built 1990 to 1999 (%)
Year house built - Built 1980 to 1989 (%)
Year house built - Built 1970 to 1979 (%)
Year house built - Built 1960 to 1969 (%)
Year house built - Built 1950 to 1959 (%)
Year house built - Built 1940 to 1949 (%)
Year house built - Built 1939 or earlier (%)
Median number of rooms in houses and condos
Median number of rooms in apartments
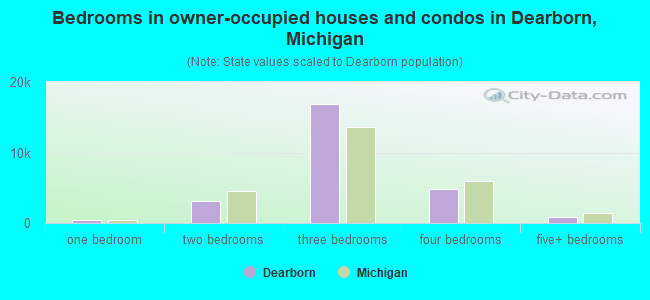
Median number of bedrooms in owner occupied houses
Mean number of bedrooms in owner occupied houses
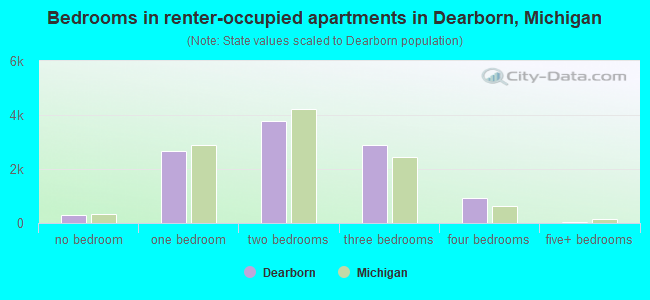
Median number of bedrooms in renter occupied houses
Mean number of bedrooms in renter occupied houses
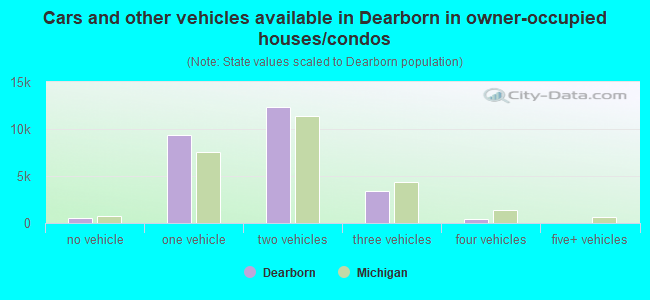
Median number of vehichles in owner occupied houses
Mean number of vehichles in owner occupied houses
Median number of vehichles in renter occupied houses
Mean number of vehichles in renter occupied houses
Rooms in owner-occupied houses - 1 room (%)
Rooms in owner-occupied houses - 2 rooms (%)
Rooms in owner-occupied houses - 3 rooms (%)
Rooms in owner-occupied houses - 4 rooms (%)
Rooms in owner-occupied houses - 5 rooms (%)
Rooms in owner-occupied houses - 6 rooms (%)
Rooms in owner-occupied houses - 7 rooms (%)
Rooms in owner-occupied houses - 8 rooms (%)
Rooms in owner-occupied houses - 9+ rooms (%)
Rooms in renter-occupied houses - 1 room (%)
Rooms in renter-occupied houses - 2 rooms (%)
Rooms in renter-occupied houses - 3 rooms (%)
Rooms in renter-occupied houses - 4 rooms (%)
Rooms in renter-occupied houses - 5 rooms (%)
Rooms in renter-occupied houses - 6 rooms (%)
Rooms in renter-occupied houses - 7 rooms (%)
Rooms in renter-occupied houses - 8 rooms (%)
Rooms in renter-occupied houses - 9+ rooms (%)
Bedrooms in owner-occupied houses - no bedrooms (%)
Bedrooms in owner-occupied houses - 1 bedroom (%)
Bedrooms in owner-occupied houses - 2 bedrooms (%)
Bedrooms in owner-occupied houses - 3 bedrooms (%)
Bedrooms in owner-occupied houses - 4 bedrooms (%)
Bedrooms in owner-occupied houses - 5+ bedrooms (%)
Bedrooms in renter-occupied houses - no bedrooms (%)
Bedrooms in renter-occupied houses - 1 bedroom (%)
Bedrooms in renter-occupied houses - 2 bedrooms (%)
Bedrooms in renter-occupied houses - 3 bedrooms (%)
Bedrooms in renter-occupied houses - 4 bedrooms (%)
Bedrooms in renter-occupied houses - 5+ bedrooms (%)
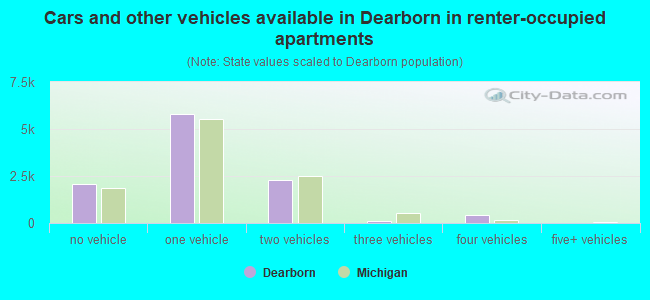
Vehicles available in owner-occupied houses - no vehicle available (%)
Vehicles available in owner-occupied houses - 1 vehicle available(%)
Vehicles available in owner-occupied houses - 2 Vehicles available (%)
Vehicles available in owner-occupied houses - 3 Vehicles available (%)
Vehicles available in owner-occupied houses - 4 Vehicles available (%)
Vehicles available in owner-occupied houses - 5+ Vehicles available (%)
Vehicles available in renter-occupied houses - no vehicle available (%)
Vehicles available in renter-occupied houses - 1 vehicle available (%)
Vehicles available in renter-occupied houses - 2 Vehicles available (%)
Vehicles available in renter-occupied houses - 3 Vehicles available (%)
Vehicles available in renter-occupied houses - 4 Vehicles available (%)
Vehicles available in renter-occupied houses - 5+ Vehicles available (%)
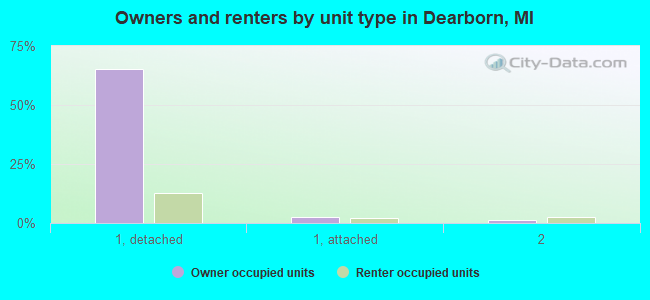
Housing units in structures - 1, detached (%)
Housing units in structures - 1, attached (%)
Housing units in structures - 2 (%)
Housing units in structures - 3 or 4 (%)
Housing units in structures - 5 to 9 (%)
Housing units in structures - 10 to 19 (%)
Housing units in structures - 20 to 49 (%)
Housing units in structures - 50 or more (%)
Housing units in structures - Mobile home (%)
Housing units in structures - Boat, RV, van, etc. (%)
Housing units in structures - Owners - 1, detached (%)
Housing units in structures - Owners - 1, attached (%)
Housing units in structures - Owners - 2 (%)
Housing units in structures - Owners - 3 or 4 (%)
Housing units in structures - Owners - 5 to 9 (%)
Housing units in structures - Owners - 10 to 19 (%)
Housing units in structures - Owners - 20 to 49 (%)
Housing units in structures - Owners - 50 or more (%)
Housing units in structures - Owners - Mobile home (%)
Housing units in structures - Owners - Boat, RV, van, etc. (%)
Housing units in structures - Renters - 1, detached (%)
Housing units in structures - Renters - 1, attached (%)
Housing units in structures - Renters - 2 (%)
Housing units in structures - Renters - 3 or 4 (%)
Housing units in structures - Renters - 5 to 9 (%)
Housing units in structures - Renters - 10 to 19 (%)
Housing units in structures - Renters - 20 to 49 (%)
Housing units in structures - Renters - 50 or more (%)
Housing units in structures - Renters - Mobile home (%)
Housing units in structures - Renters - Boat, RV, van, etc. (%)
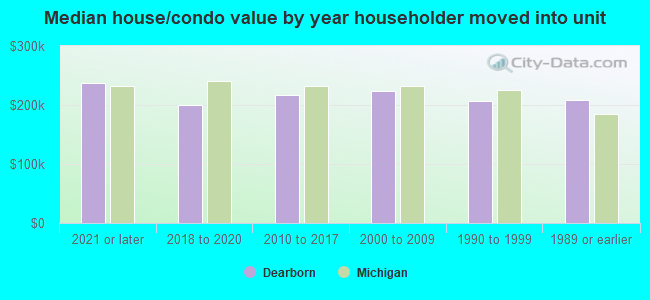
House/condo owner moved in on average (years ago)
Renter moved in on average (years ago)
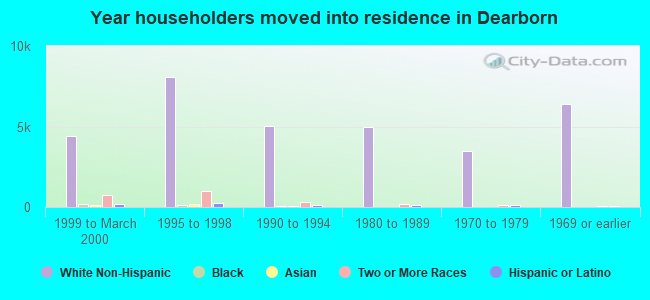
Year householder moved into unit - Moved in 1999 to March 2000 (%)
Year householder moved into unit - Moved in 1999 to March 2000 (%) - White
Year householder moved into unit - Moved in 1999 to March 2000 (%) - Black or African American
Year householder moved into unit - Moved in 1999 to March 2000 (%) - Asian
Year householder moved into unit - Moved in 1999 to March 2000 (%) - Hispanic or Latino
Year householder moved into unit - Moved in 1999 to March 2000 (%) - American Indian and Alaska Native
Year householder moved into unit - Moved in 1999 to March 2000 (%) - Multirace
Year householder moved into unit - Moved in 1999 to March 2000 (%) - Other Race
Year householder moved into unit - Moved in 1995 to 1998 (%)
Year householder moved into unit - Moved in 1995 to 1998 (%) - White
Year householder moved into unit - Moved in 1995 to 1998 (%) - Black or African American
Year householder moved into unit - Moved in 1995 to 1998 (%) - Asian
Year householder moved into unit - Moved in 1995 to 1998 (%) - Hispanic or Latino
Year householder moved into unit - Moved in 1995 to 1998 (%) - American Indian and Alaska Native
Year householder moved into unit - Moved in 1995 to 1998 (%) - Multirace
Year householder moved into unit - Moved in 1995 to 1998 (%) - Other Race
Year householder moved into unit - Moved in 1990 to 1994 (%)
Year householder moved into unit - Moved in 1990 to 1994 (%) - White
Year householder moved into unit - Moved in 1990 to 1994 (%) - Black or African American
Year householder moved into unit - Moved in 1990 to 1994 (%) - Asian
Year householder moved into unit - Moved in 1990 to 1994 (%) - Hispanic or Latino
Year householder moved into unit - Moved in 1990 to 1994 (%) - American Indian and Alaska Native
Year householder moved into unit - Moved in 1990 to 1994 (%) - Multirace
Year householder moved into unit - Moved in 1990 to 1994 (%) - Other Race
Year householder moved into unit - Moved in 1980 to 1989 (%)
Year householder moved into unit - Moved in 1980 to 1989 (%) - White
Year householder moved into unit - Moved in 1980 to 1989 (%) - Black or African American
Year householder moved into unit - Moved in 1980 to 1989 (%) - Asian
Year householder moved into unit - Moved in 1980 to 1989 (%) - Hispanic or Latino
Year householder moved into unit - Moved in 1980 to 1989 (%) - American Indian and Alaska Native
Year householder moved into unit - Moved in 1980 to 1989 (%) - Multirace
Year householder moved into unit - Moved in 1980 to 1989 (%) - Other Race
Year householder moved into unit - Moved in 1970 to 1979 (%)
Year householder moved into unit - Moved in 1970 to 1979 (%) - White
Year householder moved into unit - Moved in 1970 to 1979 (%) - Black or African American
Year householder moved into unit - Moved in 1970 to 1979 (%) - Asian
Year householder moved into unit - Moved in 1970 to 1979 (%) - Hispanic or Latino
Year householder moved into unit - Moved in 1970 to 1979 (%) - American Indian and Alaska Native
Year householder moved into unit - Moved in 1970 to 1979 (%) - Multirace
Year householder moved into unit - Moved in 1970 to 1979 (%) - Other Race
Year householder moved into unit - Moved in 1969 or earlier (%)
Year householder moved into unit - Moved in 1969 or earlier (%) - White
Year householder moved into unit - Moved in 1969 or earlier (%) - Black or African American
Year householder moved into unit - Moved in 1969 or earlier (%) - Asian
Year householder moved into unit - Moved in 1969 or earlier (%) - Hispanic or Latino
Year householder moved into unit - Moved in 1969 or earlier (%) - American Indian and Alaska Native
Year householder moved into unit - Moved in 1969 or earlier (%) - Multirace
Year householder moved into unit - Moved in 1969 or earlier (%) - Other Race
Housing units lacking complete plumbing facilities (%)
Housing units lacking complete kitchen facilities (%)
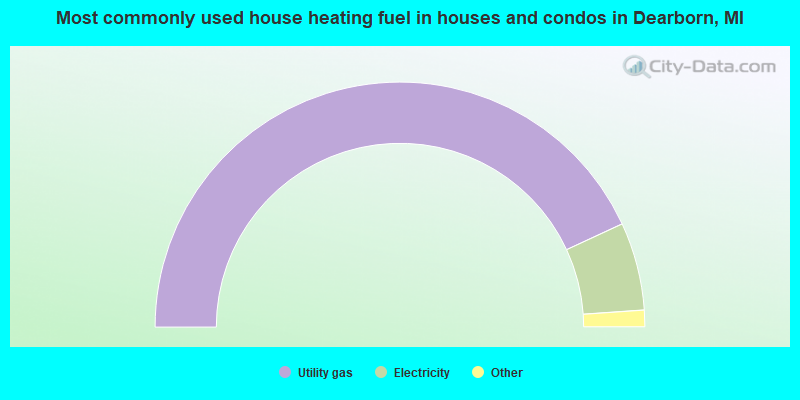
House heating fuel used in houses and condos - Utility gas (%)
House heating fuel used in houses and condos - Bottled, tank, or LP gas (%)
House heating fuel used in houses and condos - Electricity (%)
House heating fuel used in houses and condos - Fuel oil, kerosene, etc. (%)
House heating fuel used in houses and condos - Coal or coke (%)
House heating fuel used in houses and condos - Wood (%)
House heating fuel used in houses and condos - Solar energy (%)
House heating fuel used in houses and condos - Other fuel (%)
House heating fuel used in houses and condos - No fuel used (%)
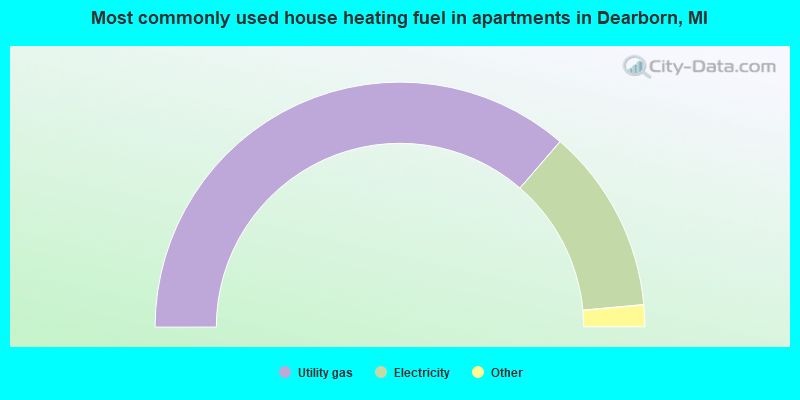
House heating fuel used in apartments - Utility gas (%)
House heating fuel used in apartments - Bottled, tank, or LP gas (%)
House heating fuel used in apartments - Electricity (%)
House heating fuel used in apartments - Fuel oil, kerosene, etc. (%)
House heating fuel used in apartments - Coal or coke (%)
House heating fuel used in apartments - Wood (%)
House heating fuel used in apartments - Solar energy (%)
House heating fuel used in apartments - Other fuel (%)
House heating fuel used in apartments - No fuel used (%)
Latest news about housing in Dearborn, MI collected exclusively by city-data.com from local newspapers, TV, and radio stations
Median year house/condo built: 1949Median year apartment built: 1958Household type by relationship:
Households: 107,712
Male householders: 20,140 (5,342 living alone ), Female householders: 16,516 (6,489 living alone )18,543 spouses (18,496 opposite-sex spouses ), 644 unmarried partners , (644 opposite-sex unmarried partners ), 45,110 children (44,525 natural , 480 adopted , 105 stepchildren ), 1,484 grandchildren , 1,056 brothers or sisters , 1,190 parents , 48 foster children , 680 other relatives , 2,091 non-relatives In group quarters: 210
Size of family households: 8,420 2-persons , 4,931 3-persons , 3,637 4-persons , 3,036 5-persons , 1,588 6-persons , 2,164 7-or-more-persons .
Size of nonfamily households: 11,831 1-person , 574 2-persons , 89 3-persons , 353 4-persons , 33 5-persons .
30,383 married couples with children. single-parent households (478 men , 2,231 women ).
48.7% of residents of Dearborn speak English at home. of residents speak Spanish at home (78% speak English very well , 13% speak English well , 7% speak English not well , 1% don't speak English at all ).of residents speak other Indo-European language at home (83% speak English very well , 8% speak English well , 8% speak English not well , 1% don't speak English at all ).of residents speak Asian or Pacific Island language at home (70% speak English very well , 22% speak English well , 5% speak English not well , 3% don't speak English at all ).of residents speak other language at home (47% speak English very well , 24% speak English well , 18% speak English not well , 11% don't speak English at all ).
Foreign born population: 33,285 (30.9%)of them are naturalized citizens )
Median number of rooms in houses and condos:
Median number of rooms in apartments
Owner-occupied Renter-occupied
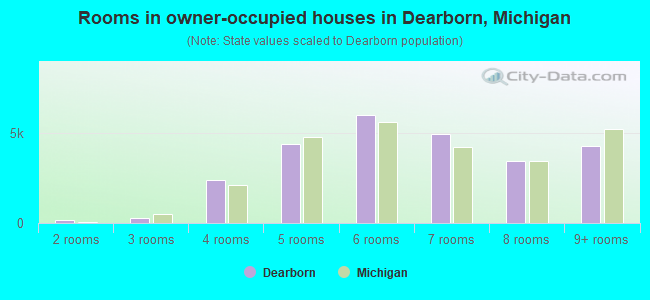
Rooms in owner-occupied houses in Dearborn, Michigan
43 1 room 164 2 rooms 305 3 rooms 2,403 4 rooms 4,386 5 rooms 6,008 6 rooms 4,946 7 rooms 3,470 8 rooms 4,300 9+ rooms
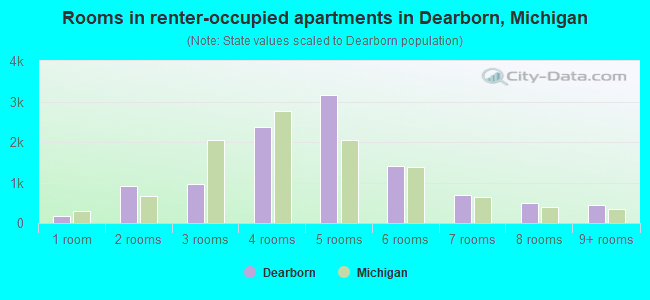
Rooms in renter-occupied apartments in Dearborn, Michigan
175 1 room 919 2 rooms 955 3 rooms 2,373 4 rooms 3,165 5 rooms 1,406 6 rooms 680 7 rooms 506 8 rooms 452 9+ rooms
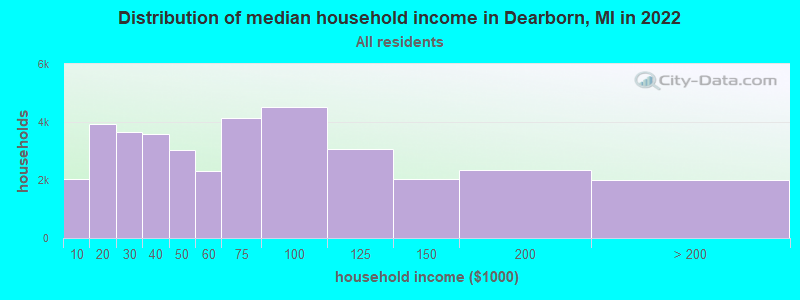
Dearborn, MI household income distribution 2,051 Less than $10,0003,934 $10,000 to $19,9993,639 $20,000 to $29,9993,584 $30,000 to $39,9993,038 $40,000 to $49,9992,312 $50,000 to $59,9994,144 $60,000 to $74,9994,509 $75,000 to $99,9993,074 $100,000 to $124,9992,037 $125,000 to $149,9992,342 $150,000 to $199,9991,992 $200,000 or more
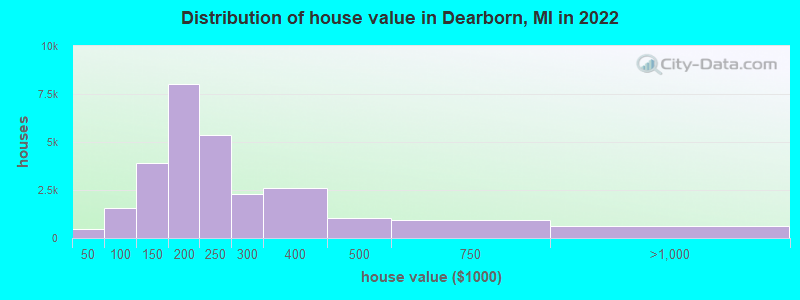
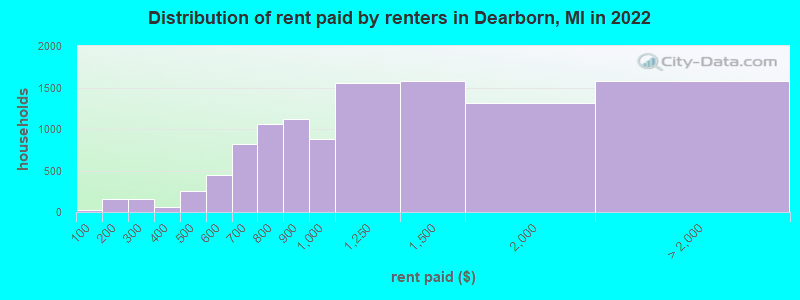
Home value of owner - occupied houses in 2022 in Dearborn, MI 109 Less than $10,00062 $10,000 to $14,99979 $15,000 to $19,99924 $20,000 to $24,99953 $25,000 to $29,99931 $30,000 to $34,99956 $35,000 to $39,99960 $40,000 to $49,999157 $50,000 to $59,999246 $60,000 to $69,999226 $70,000 to $79,999439 $80,000 to $89,999423 $90,000 to $99,9991,864 $100,000 to $124,9992,064 $125,000 to $149,9994,961 $150,000 to $174,9993,075 $175,000 to $199,9995,359 $200,000 to $249,9992,312 $250,000 to $299,9992,616 $300,000 to $399,9991,055 $400,000 to $499,999956 $500,000 to $749,999511 $750,000 to $999,99971 $1,000,000 to $1,499,99918 $1,500,000 to $1,999,99938 $2,000,000 or moreRent paid by renters in 2022 in Dearborn, MI 21 Less than $10033 $100 to $149124 $150 to $19971 $200 to $24981 $250 to $29916 $300 to $34938 $350 to $399139 $400 to $449113 $450 to $499155 $500 to $549292 $550 to $599369 $600 to $649454 $650 to $699609 $700 to $749452 $750 to $7991,116 $800 to $899884 $900 to $9991,552 $1,000 to $1,2491,574 $1,250 to $1,4991,318 $1,500 to $1,999419 $2,000 to $2,49961 $2,500 to $2,99922 $3,000 to $3,499180 $3,500 or more892 No cash rent
Percentage of workers working in this county: 86.1%Number of people working at home: 5,564 (13.3% of all workers )
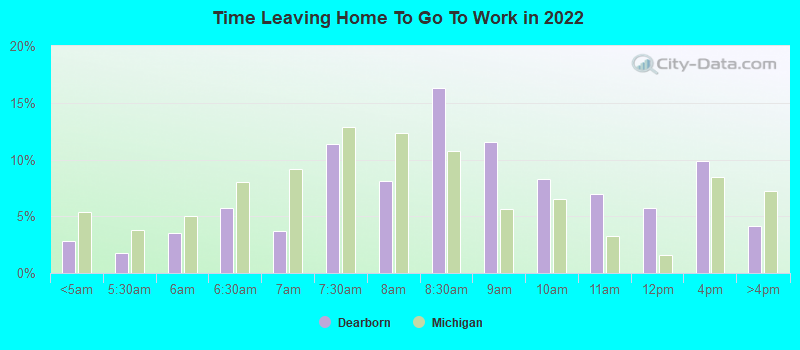
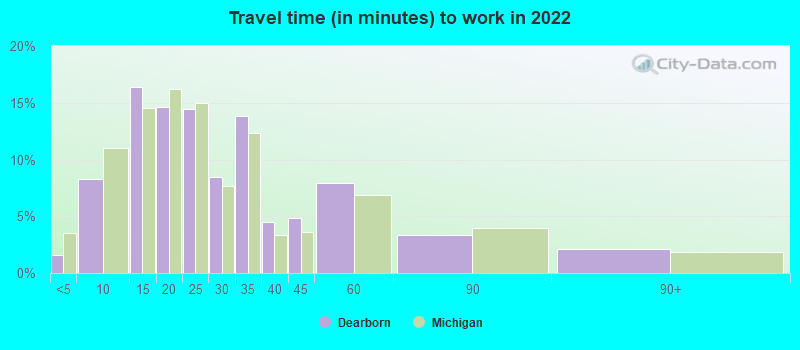
Travel time to work (commute)
Less than 5 minutes: 9565 to 9 minutes: 4,98810 to 14 minutes: 8,75715 to 19 minutes: 5,56320 to 24 minutes: 6,10425 to 29 minutes: 1,73030 to 34 minutes: 4,03935 to 39 minutes: 69940 to 44 minutes: 1,73545 to 59 minutes: 1,60760 to 89 minutes: 1,03290 or more minutes: 751
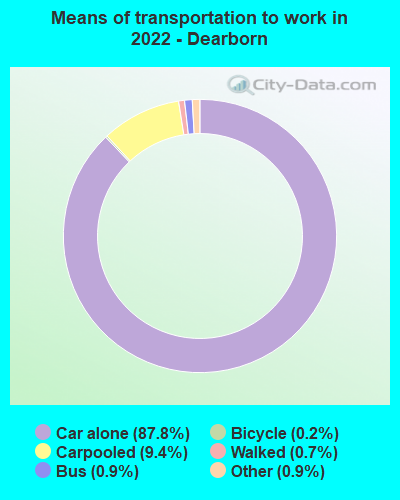
Means of transportation to work:
Drove a car alone: 61,446 (80.0%)Carpooled: 6,504 (8.5%)Bus : 516 (0.7%)Long-distance train or commuter rail : 6 (0.0%)Light rail, streetcar or trolley : 14 (0.0%)Ferryboat: 39 (0.1%)Taxi: 657 (0.9%)Bicycle: 187 (0.2%)Walked: 523 (0.7%)Worked at home: 5,564 (7.2%)
Unemployment by race in 2022
Unemployment rate for White non-Hispanic residents 5.3% Males5.9% FemalesUnemployment rate for Black residents 9.9% Males5.0% FemalesUnemployment rate for American Indian and Alaska Native residents 2.6% MalesUnemployment rate for Asian residents 1.3% Males0.7% FemalesUnemployment rate for other race residents 3.4% Males19.2% FemalesUnemployment rate for two or more race residents 19.0% Males1.4% FemalesUnemployment rate for Hispanic or Latino residents 1.5% Males12.0% Females
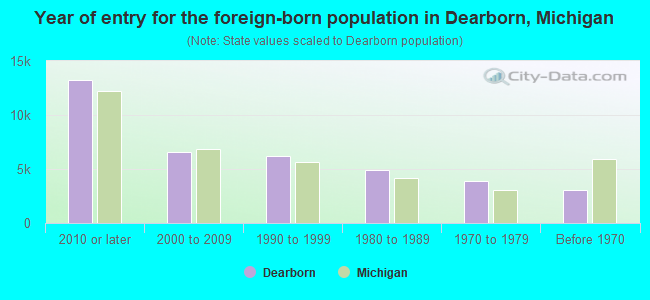
Year of entry for the foreign-born population in Dearborn, Michigan
13,204 2010 or later 6,554 2000 to 2009 6,233 1990 to 1999 4,952 1980 to 1989 3,925 1970 to 1979 3,074 Before 1970
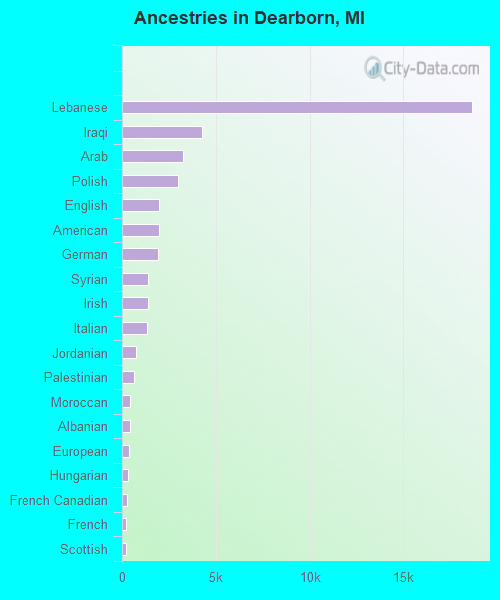
First ancestries reported:
Lebanese: 18,636 (29.3%)
Iraqi: 4,259 (6.7%)
Arab: 3,265 (5.1%)
Polish: 2,965 (4.7%)
English: 1,998 (3.1%)
American: 1,957 (3.1%)
German: 1,908 (3.0%)
Syrian: 1,410 (2.2%)
Irish: 1,377 (2.2%)
Italian: 1,316 (2.1%)
Jordanian: 731 (1.1%)
Palestinian: 627 (1.0%)
Moroccan: 439 (0.7%)
Albanian: 431 (0.7%)
European: 366 (0.6%)
Hungarian: 320 (0.5%)
French Canadian: 250 (0.4%)
French: 233 (0.4%)
Scottish: 229 (0.4%)
Ukrainian: 155 (0.2%)
Iranian: 149 (0.2%)
Nigerian: 132 (0.2%)
Ethiopian: 114 (0.2%)
African: 114 (0.2%)
Greek: 103 (0.2%)
Scotch-Irish: 99 (0.2%)
Swedish: 94 (0.1%)
Dutch: 86 (0.1%)
Norwegian: 81 (0.1%)
Czech: 81 (0.1%)
Northern European: 77 (0.1%)
Afghan: 74 (0.1%)
Canadian: 74 (0.1%)
Armenian: 72 (0.1%)
British: 68 (0.1%)
Eastern European: 67 (0.1%)
Maltese: 67 (0.1%)
Macedonian: 65 (0.1%)
Lithuanian: 44 (0.07%)
Finnish: 37 (0.06%)
Slovak: 35 (0.06%)
Romanian: 33 (0.05%)
Yugoslavian: 31 (0.05%)
Slavic: 30 (0.05%)
Egyptian: 30 (0.05%)
Czechoslovakian: 26 (0.04%)
Scandinavian: 26 (0.04%)
Serbian: 26 (0.04%)
Belgian: 25 (0.04%)
Assyrian: 23 (0.04%)
Danish: 20 (0.03%)
Israeli: 18 (0.03%)
Celtic: 18 (0.03%)
Russian: 17 (0.03%)
Welsh: 16 (0.03%)
Ghanaian: 15 (0.02%)
Portuguese: 11 (0.02%)
Jamaican: 10 (0.02%)
Bulgarian: 9 (0.01%)
Brazilian: 9 (0.01%)
Haitian: 9 (0.01%)
Sudanese: 8 (0.01%)
Turkish: 5 (0.01%)
Most common places of birth for foreign-born residents (%): Yemen Dearborn:
37.9% (11,884)Michigan:
3.1% (21,538)
Lebanon Dearborn:
34.0% (10,659)Michigan:
3.7% (25,634)
Iraq Dearborn:
9.6% (3,006)Michigan:
8.1% (55,954)
India Dearborn:
3.3% (1,038)Michigan:
11.1% (77,240)
Jordan Dearborn:
3.1% (979)Michigan:
0.7% (4,939)
Syria Dearborn:
2.7% (832)Michigan:
0.9% (5,978)
Asia, n.e.c. Dearborn:
1.5% (474)Michigan:
0.3% (2,076)
Place of birth for U.S.-born residents:
This state: 62,167Other state: 9,489Northeast: 2,445Midwest: 2,734South: 3,157West: 1,153 89.1% of Dearborn residents lived in the same house 1 years ago.
Out of people who lived in different houses, 41.4% lived in this county.
Out of people who lived in different counties, 46.8% lived in Michigan.
Dearborn:
89.1%State average:
88.4%
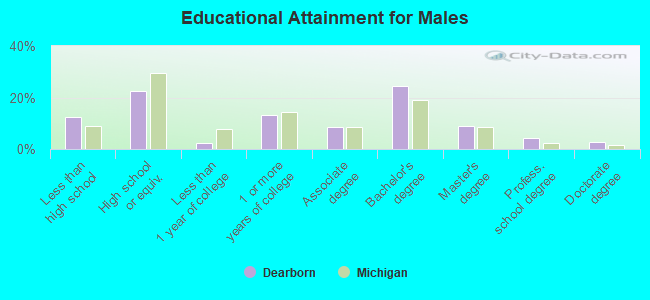
Education attainment for males 25 years and older:
No schooling: 1,290Nursery to 4th grade: 535th and 6th grade: 1187th and 8th grade: 2789th grade: 19410th grade: 33911th grade: 67312th grade, no diploma: 920High school graduate (or equivalency): 7,095Less than 1 year of college: 695Some college more than 1 year, no degree: 4,115Associate degree: 2,688Bachelor's degree: 7,699Master's degree: 2,820Professional school degree: 1,364Doctorate degree: 898
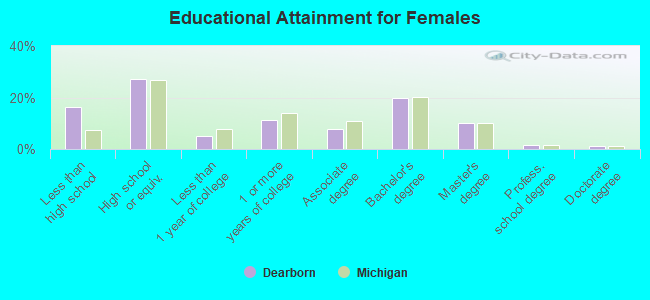
Education attainment for females 25 years and older:
No schooling: 1,952Nursery to 4th grade: 475th and 6th grade: 2807th and 8th grade: 3739th grade: 57310th grade: 57511th grade: 27712th grade, no diploma: 1,138High school graduate (or equivalency): 8,648Less than 1 year of college: 1,573Some college more than 1 year, no degree: 3,591Associate degree: 2,459Bachelor's degree: 6,260Master's degree: 3,189Professional school degree: 483Doctorate degree: 311
Housing units in structures:
One, detached: 28,820One, attached: 2,070Two: 1,4133 or 4: 8985 to 9: 83310 to 19: 1,28920 to 49: 1,04050 or more: 3,082Mobile homes: 570Median worth of mobile homes: $378,200
Housing units lacking complete plumbing facilities in 2022: 2.3%Housing units lacking complete kitchen facilities in 2022: 2.6%House/condo owner moved in on average 9 years ago
Renter moved in on average 3 years ago
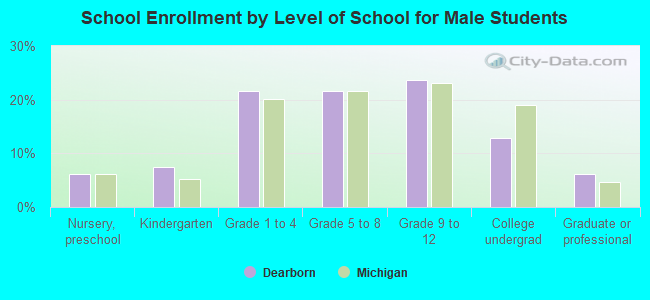
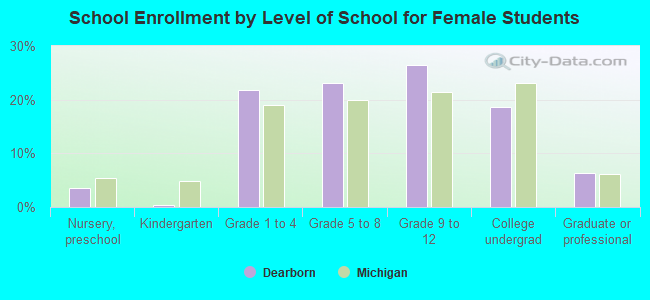
Private vs. public school enrollment:
Students in private schools in grades 1 to 8 (elementary and middle school): 1,221 Students in private schools in grades 9 to 12 (high school): 478 Students in private undergraduate colleges: 618