Derry, NH (New Hampshire) Houses and Residents
| Derry: | $374,323 |
| New Hampshire: | $384,700 |
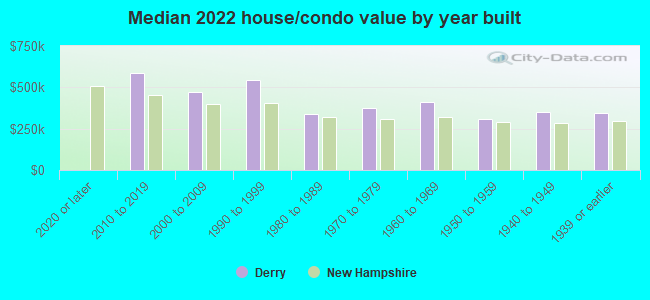
Mean price in 2022:
Detached houses: $383,612
Here: $383,612 State: $491,479 Townhouses or other attached units: $314,112
Here: $314,112 State: $361,001 In 2-unit structures: $287,125
Here: $287,125 State: $368,847 In 3-to-4-unit structures: $310,617
Here: $310,617 State: $575,942 In 5-or-more-unit structures: $157,498
Here: $157,498 State: $274,068 Mobile homes: $127,824
Here: $127,824 State: $124,817
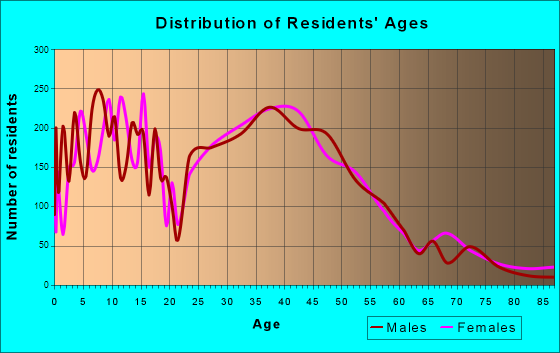
Total population: 22,015 (Urban population: 21,818, Rural population: 652 (all nonfarm))
Houses: 9,943 (9,426 occupied: 5,462 owner occupied, 3,947 renter occupied)
| % of renters here: | 42% |
| State: | 28% |
Housing density: 645 houses/condos per square mile
Median price asked for vacant for-sale houses and condos in 2022: $146,582.
Median contract rent in 2022: $1,344 (lower quartile is $1,104, upper quartile is $1,657)
Median rent asked for vacant for-rent units in 2022: $1,462
Median gross rent in Derry, NH in 2022: $1,430
Housing units in Derry with a mortgage: 3,655 (398 second mortgage, 0 home equity loan, 340 both second mortgage and home equity loan)
Houses without a mortgage: 50
Median household income for houses/condos with a mortgage: $131,356
Median household income for apartments without a mortgage: $72,717
Median monthly housing costs: $1,489
Compare current foreclosures in Derry, NH:
| Photo | Address | Area | Beds / Baths | Price | Details |
|---|---|---|---|---|---|

|
#1
High St
Derry, NH 03038
|
2,149 sq. feet
|
3 baths 4 beds |
show details | |

|
#2
Redfield Cir
Derry, NH 03038
|
2,124 sq. feet
|
3 baths 4 beds |
show details | |

|
#3
Brook St
Derry, NH 03038
|
1,476 sq. feet
|
2 baths 4 beds |
show details | |

|
#4
Michael Ave
Derry, NH 03038
|
1,536 sq. feet
|
1 baths 4 beds |
show details | |

|
#5
Lawrence St
Derry, NH 03038
|
2,124 sq. feet
|
2 baths 3 beds |
show details | |

|
#6
Michael Ave
Derry, NH 03038
|
1,536 sq. feet
|
1 baths 4 beds |
show details | |

|
#7
Pine Blf # 3
Derry, NH 03038
|
1,872 sq. feet
|
2 baths 3 beds |
show details | |

|
#8
Pine Bluf 3
Derry, NH 03038
|
1,872 sq. feet
|
2 baths 3 beds |
show details | |

|
#9
Everett St
Derry, NH 03038
|
1,596 sq. feet
|
1 baths 3 beds |
show details | |

|
#10
Bypass 28
Derry, NH 03038
|
2,300 sq. feet
|
2 baths 4 beds |
show details |
| Photo | Address | Area | Beds / Baths | Price | Details |
|---|---|---|---|---|---|

|
#11
Gayle Dr
Derry, NH 03038
|
1,246 sq. feet
|
1 baths 3 beds |
show details | |

|
#12
Tsienneto Rd Unit 39
Derry, NH 03038
|
1,936 sq. feet
|
1 baths 2 beds |
show details | |

|
#13
Brook St
Derry, NH 03038
|
1,666 sq. feet
|
1 baths 4 beds |
show details | |

|
#14
1/2 Floyd Rd
Derry, NH 03038
|
2,312 sq. feet
|
2 baths 4 beds |
show details | |

|
#15
Sanborn Rd
Derry, NH 03038
|
1,082 sq. feet
|
2 baths 2 beds |
show details | |

|
#16
Brook St
Derry, NH 03038
|
1,476 sq. feet
|
1 baths 4 beds |
show details | |

|
#17
Walnut Hill Rd
Derry, NH 03038
|
2,042 sq. feet
|
2 baths 3 beds |
show details | |

|
#18
Scenic Dr
Derry, NH 03038
|
1,692 sq. feet
|
1 baths 2 beds |
show details | |

|
#19
Fairview Ave
Derry, NH 03038
|
1,510 sq. feet
|
1 baths 3 beds |
show details | |

|
#20
Bypass 28
Derry, NH 03038
|
- sq. feet
|
- baths - beds |
show details |
| Photo | Address | Area | Beds / Baths | Price | Details |
|---|---|---|---|---|---|

|
#21
Robin Ct
Derry, NH 03038
|
- sq. feet
|
- baths - beds |
show details | |

|
#22
Linlew Dr Apt 9
Derry, NH 03038
|
- sq. feet
|
- baths - beds |
show details | |

|
#23
Circle Dr
Derry, NH 03038
|
- sq. feet
|
- baths - beds |
show details | |

|
#24
Brady Ave
Derry, NH 03038
|
- sq. feet
|
- baths - beds |
show details | |

|
#25
Louise Way
Derry, NH 03038
|
- sq. feet
|
- baths - beds |
show details | |

|
#26
Fairway Dr Apt 2116
Derry, NH 03038
|
- sq. feet
|
- baths - beds |
show details | |

|
#27
Kendall Pond Rd
Derry, NH 03038
|
- sq. feet
|
- baths - beds |
show details | |

|
#28
Fairway Dr Apt 248
Derry, NH 03038
|
- sq. feet
|
- baths - beds |
show details | |

|
#29
Franklin St Apt 1
Derry, NH 03038
|
- sq. feet
|
- baths - beds |
show details | |

|
#30
Alyssa Dr
Derry, NH 03038
|
- sq. feet
|
- baths - beds |
show details |
| Photo | Address | Area | Beds / Baths | Price | Details |
|---|---|---|---|---|---|

|
#31
Manchester Rd, Ste 11a Pmb 199
Derry, NH 03038
|
- sq. feet
|
- baths - beds |
show details | |

|
Check over 1 million property listings on Foreclosure.com!
|
browse all offers | |||

Latest news about housing in Derry, NH collected exclusively by city-data.com from local newspapers, TV, and radio stations

 | Derry/Londonderry parents with children who see masks, social isolationist,comstant fear of ppl faith in TV as INHUMANE? (11 replies) |
| What's wrong with mobile homes and apartments? (13 replies) |
| Whats up with NH houses? (117 replies) |
| How's Derry nowadays? (8 replies) |
| New Hampshire property tax question (9 replies) |
| Housing options in southern NH (21 replies) |
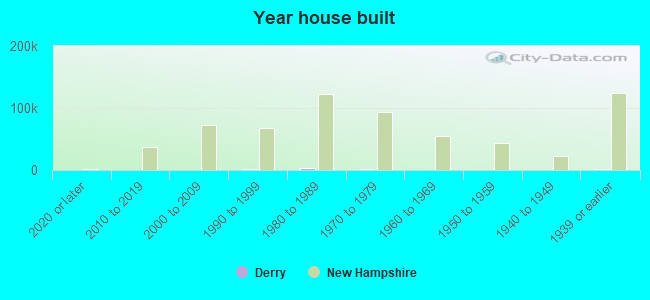
Median year apartment built: 1980
Household type by relationship:
Households: 23,337- Male householders: 4,077 (853 living alone), Female householders: 5,322 (1,626 living alone)
4,267 spouses (4,205 opposite-sex spouses), 848 unmarried partners, (817 opposite-sex unmarried partners), 6,877 children (6,316 natural, 52 adopted, 508 stepchildren), 528 grandchildren, 102 brothers or sisters, 168 parents, 76 foster children, 254 other relatives, 606 non-relatives
- In group quarters: 208
Size of family households: 2,687 2-persons, 1,421 3-persons, 1,130 4-persons, 431 5-persons, 83 6-persons, 117 7-or-more-persons.
Size of nonfamily households: 2,811 1-person, 599 2-persons, 202 3-persons, 36 4-persons.
2,503 married couples with children.
1,424 single-parent households (444 men, 980 women).
91.8% of residents of Derry speak English at home.
3.2% of residents speak Spanish at home (79% speak English very well, 10% speak English well, 10% don't speak English at all).
2.1% of residents speak other Indo-European language at home (80% speak English very well, 19% speak English well, 1% speak English not well).
2.2% of residents speak Asian or Pacific Island language at home (85% speak English very well, 13% speak English well, 2% speak English not well).
0.2% of residents speak other language at home (100% speak English very well).
Foreign born population: 1,268 (5.4%)
(57.3% of them are naturalized citizens)
| Here: | 6.0 |
| State: | 6.4 |
| Here: | 3.5 |
| State: | 4.0 |
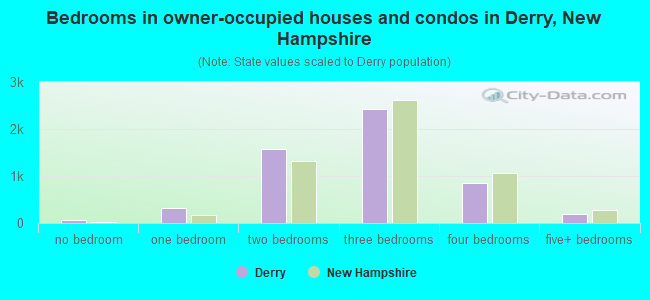
- Bedrooms in owner-occupied houses and condos in Derry, New Hampshire
- 71no bedroom
- 3191 bedroom
- 1,5842 bedrooms
- 2,4343 bedrooms
- 8534 bedrooms
- 2025+ bedrooms
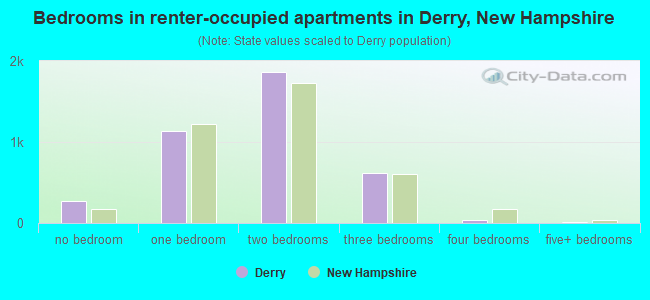
- Bedrooms in renter-occupied apartments in Derry, New Hampshire
- 275no bedroom
- 1,1341 bedroom
- 1,8672 bedrooms
- 6213 bedrooms
- 324 bedrooms
- 185+ bedrooms
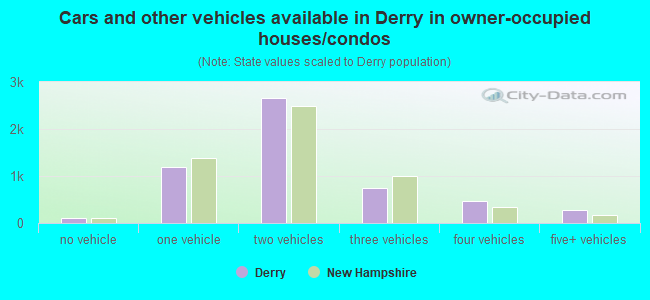
- Cars and other vehicles available in Derry in owner-occupied houses/condos
- 103no vehicle
- 1,1931 vehicle
- 2,6612 vehicles
- 7473 vehicles
- 4714 vehicles
- 2875+ vehicles
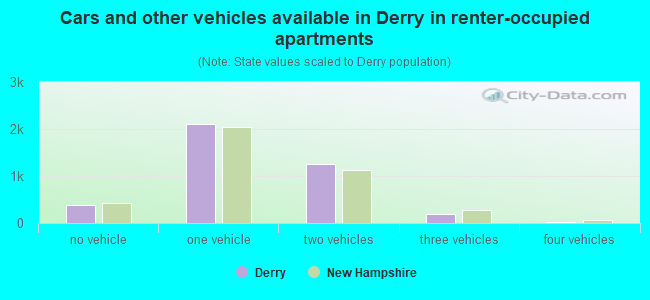
- Cars and other vehicles available in Derry in renter-occupied apartments
- 380no vehicle
- 2,1021 vehicle
- 1,2482 vehicles
- 1973 vehicles
- 204 vehicles
- 05+ vehicles
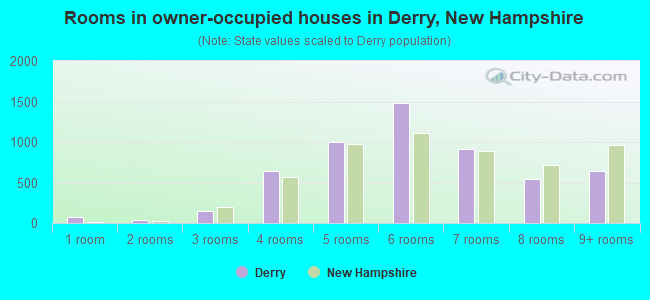
- Rooms in owner-occupied houses in Derry, New Hampshire
- 711 room
- 312 rooms
- 1433 rooms
- 6374 rooms
- 1,0015 rooms
- 1,4786 rooms
- 9157 rooms
- 5408 rooms
- 6459+ rooms
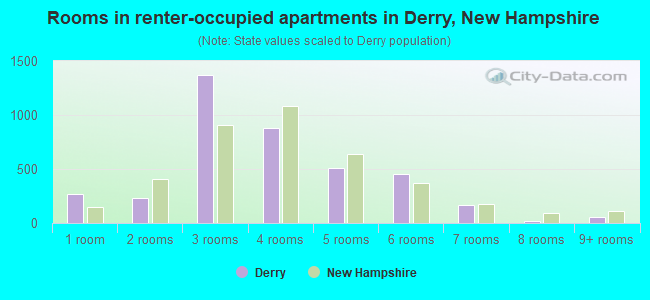
- Rooms in renter-occupied apartments in Derry, New Hampshire
- 2651 room
- 2342 rooms
- 1,3673 rooms
- 8834 rooms
- 5085 rooms
- 4546 rooms
- 1717 rooms
- 158 rooms
- 519+ rooms
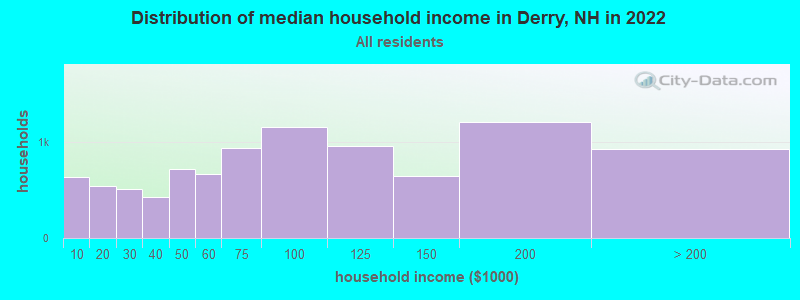
Derry, NH household income distribution

- 641Less than $10,000
- 542$10,000 to $19,999
- 512$20,000 to $29,999
- 426$30,000 to $39,999
- 724$40,000 to $49,999
- 667$50,000 to $59,999
- 947$60,000 to $74,999
- 1,161$75,000 to $99,999
- 958$100,000 to $124,999
- 653$125,000 to $149,999
- 1,214$150,000 to $199,999
- 933$200,000 or more
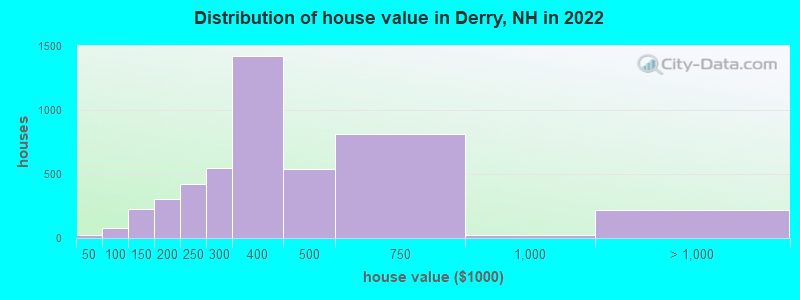
Home value of owner - occupied houses in 2022 in Derry, NH
-
- 10Less than $10,000
- 15$40,000 to $49,999
- 17$70,000 to $79,999
- 42$80,000 to $89,999
- 94$100,000 to $124,999
- 134$125,000 to $149,999
- 61$150,000 to $174,999
- 241$175,000 to $199,999
- 419$200,000 to $249,999
- 543$250,000 to $299,999
- 1,424$300,000 to $399,999
- 537$400,000 to $499,999
- 811$500,000 to $749,999
- 21$750,000 to $999,999
- 44$1,000,000 to $1,499,999
- 175$2,000,000 or more
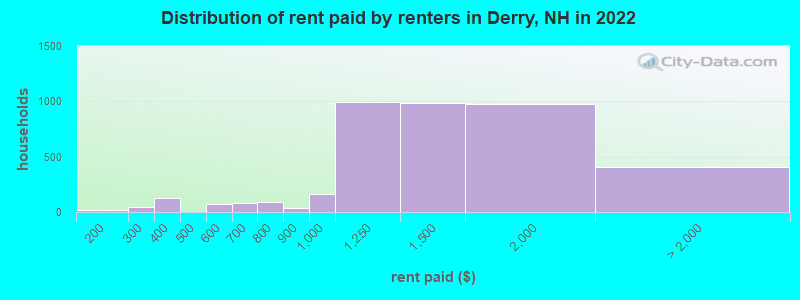
Rent paid by renters in 2022 in Derry, NH
-
- 20$150 to $199
- 27$200 to $249
- 20$250 to $299
- 69$300 to $349
- 59$350 to $399
- 73$500 to $549
- 52$600 to $649
- 31$650 to $699
- 16$700 to $749
- 74$750 to $799
- 34$800 to $899
- 167$900 to $999
- 993$1,000 to $1,249
- 987$1,250 to $1,499
- 976$1,500 to $1,999
- 134$2,000 to $2,499
- 21$3,500 or more
- 248No cash rent
Percentage of workers working in this county: 59.3%
Number of people working at home: 2,296 (18.8% of all workers)
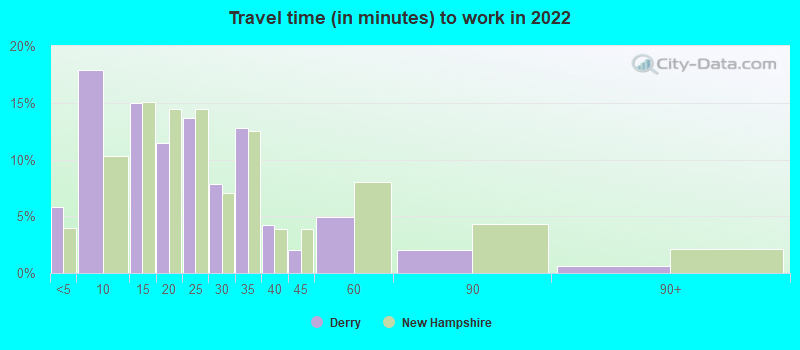
Travel time to work (commute)
- Less than 5 minutes: 371
- 5 to 9 minutes: 1,173
- 10 to 14 minutes: 659
- 15 to 19 minutes: 1,150
- 20 to 24 minutes: 1,315
- 25 to 29 minutes: 734
- 30 to 34 minutes: 1,421
- 35 to 39 minutes: 597
- 40 to 44 minutes: 499
- 45 to 59 minutes: 758
- 60 to 89 minutes: 656
- 90 or more minutes: 409
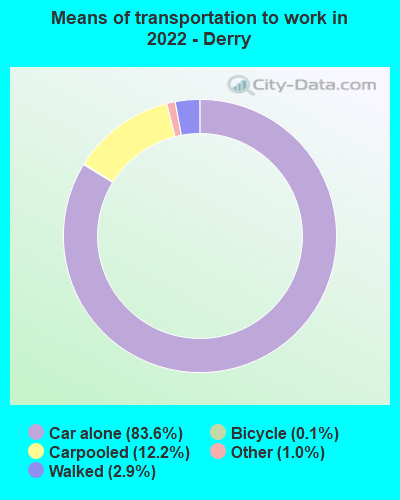
Means of transportation to work:
- Drove a car alone: 6,025 (63.7%)
- Carpooled: 943 (10.0%)
- Subway or elevated rail: 5 (0.1%)
- Taxi: 109 (1.2%)
- Bicycle: 17 (0.2%)
- Walked: 164 (1.7%)
- Worked at home: 2,296 (24.3%)
- Unemployment by race in 2022
- Unemployment rate for White non-Hispanic residents
- 4.1%Males
- 2.6%Females
- Unemployment rate for other race residents
- 43.7%Males
- Unemployment rate for Hispanic or Latino residents
- 16.0%Males
- 20.2%Females
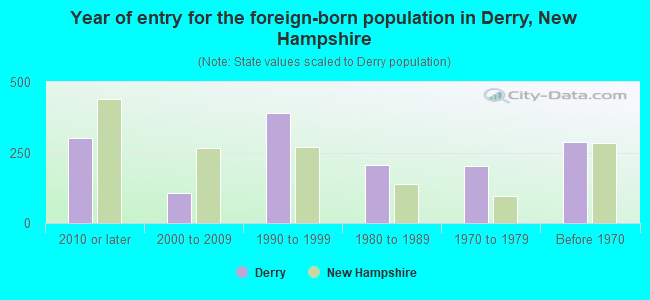
- Year of entry for the foreign-born population in Derry, New Hampshire
- 3032010 or later
- 1062000 to 2009
- 3891990 to 1999
- 2061980 to 1989
- 2021970 to 1979
- 286Before 1970
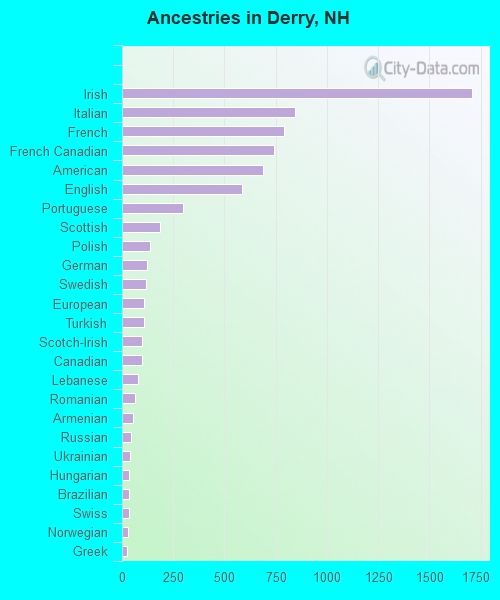
First ancestries reported:
- Irish: 1,705 (20.0%)
- Italian: 845 (9.9%)
- French: 792 (9.3%)
- French Canadian: 743 (8.7%)
- American: 690 (8.1%)
- English: 583 (6.8%)
- Portuguese: 297 (3.5%)
- Scottish: 186 (2.2%)
- Polish: 139 (1.6%)
- German: 120 (1.4%)
- Swedish: 118 (1.4%)
- European: 107 (1.3%)
- Turkish: 105 (1.2%)
- Scotch-Irish: 100 (1.2%)
- Canadian: 100 (1.2%)
- Lebanese: 80 (0.9%)
- Romanian: 63 (0.7%)
- Armenian: 53 (0.6%)
- Russian: 44 (0.5%)
- Ukrainian: 37 (0.4%)
- Hungarian: 36 (0.4%)
- Brazilian: 33 (0.4%)
- Swiss: 33 (0.4%)
- Norwegian: 29 (0.3%)
- Greek: 23 (0.3%)
- Belgian: 19 (0.2%)
- Danish: 17 (0.2%)
- Czech: 12 (0.1%)
- Scandinavian: 11 (0.1%)
- Austrian: 9 (0.1%)
- Zimbabwean: 5 (0.06%)
- Dutch: 4 (0.05%)
- Nigerian: 1 (0.01%)
Most common places of birth for foreign-born residents (%):
| Derry: | 13.5% (160) |
| New Hampshire: | 9.1% (7,609) |
| Derry: | 9.0% (106) |
| New Hampshire: | 1.3% (1,058) |
| Derry: | 8.8% (104) |
| New Hampshire: | 4.5% (3,775) |
| Derry: | 7.4% (87) |
| New Hampshire: | 7.0% (5,842) |
| Derry: | 6.7% (79) |
| New Hampshire: | 9.1% (7,618) |
| Derry: | 6.5% (77) |
| New Hampshire: | 1.3% (1,066) |
| Derry: | 6.0% (71) |
| New Hampshire: | 0.5% (436) |
| Derry: | 5.7% (67) |
| New Hampshire: | 1.9% (1,607) |
| Derry: | 5.1% (60) |
| New Hampshire: | 0.6% (527) |
| Derry: | 4.1% (49) |
| New Hampshire: | 3.6% (2,964) |
| Derry: | 3.1% (37) |
| New Hampshire: | 0.8% (654) |
| Derry: | 3.0% (36) |
| New Hampshire: | 1.0% (861) |
| Derry: | 2.5% (30) |
| New Hampshire: | 0.2% (182) |
| Derry: | 2.5% (29) |
| New Hampshire: | 0.1% (113) |
| Derry: | 2.4% (28) |
| New Hampshire: | 3.3% (2,742) |
| Derry: | 2.1% (25) |
| New Hampshire: | 0.9% (743) |
| Derry: | 2.1% (25) |
| New Hampshire: | 2.2% (1,838) |
| Derry: | 1.6% (19) |
| New Hampshire: | 0.2% (146) |
Place of birth for U.S.-born residents:
- This state: 6,494
- Other state: 15,309
- Northeast: 12,697
- Midwest: 577
- South: 1,197
- West: 842
89.7% of Derry residents lived in the same house 1 years ago.
Out of people who lived in different houses, 33.3% lived in this county.
Out of people who lived in different counties, 35.7% lived in New Hampshire.
| Derry: | 89.7% |
| State average: | 89.8% |
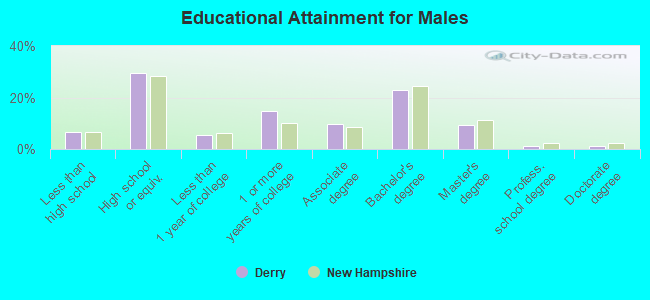
Education attainment for males 25 years and older:
- No schooling: 45
- Nursery to 4th grade: 12
- 5th and 6th grade: 9
- 7th and 8th grade: 0
- 9th grade: 60
- 10th grade: 168
- 11th grade: 145
- 12th grade, no diploma: 60
- High school graduate (or equivalency): 2,198
- Less than 1 year of college: 408
- Some college more than 1 year, no degree: 1,089
- Associate degree: 722
- Bachelor's degree: 1,707
- Master's degree: 684
- Professional school degree: 79
- Doctorate degree: 79
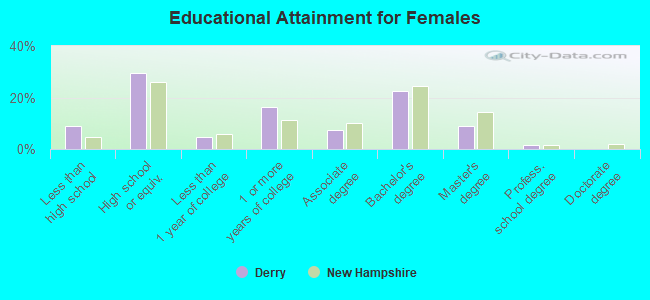
Education attainment for females 25 years and older:
- No schooling: 25
- Nursery to 4th grade: 0
- 5th and 6th grade: 0
- 7th and 8th grade: 39
- 9th grade: 20
- 10th grade: 249
- 11th grade: 165
- 12th grade, no diploma: 311
- High school graduate (or equivalency): 2,690
- Less than 1 year of college: 421
- Some college more than 1 year, no degree: 1,471
- Associate degree: 660
- Bachelor's degree: 2,050
- Master's degree: 813
- Professional school degree: 130
- Doctorate degree: 14
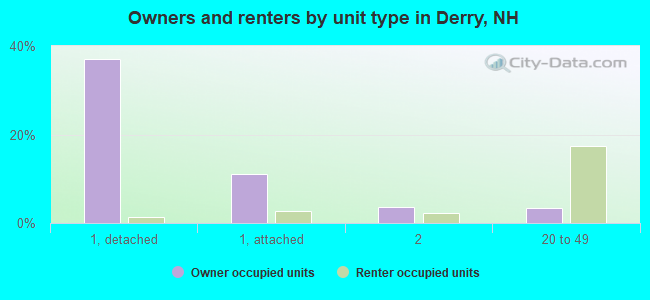
Housing units in structures:
- One, detached: 4,092
- One, attached: 1,468
- Two: 434
- 3 or 4: 343
- 5 to 9: 541
- 10 to 19: 844
- 20 to 49: 1,849
- 50 or more: 237
- Mobile homes: 130
Median worth of mobile homes: $120,638
Housing units lacking complete kitchen facilities in 2022: 3.1%
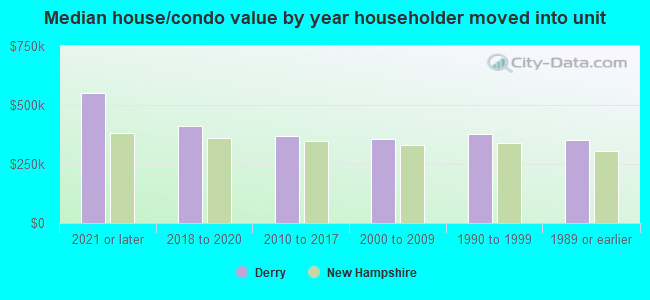
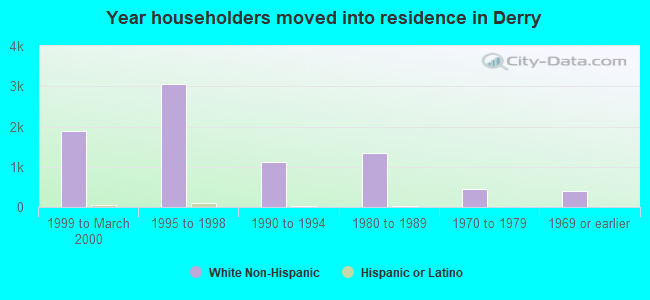
House/condo owner moved in on average 11 years ago
Renter moved in on average 5 years ago
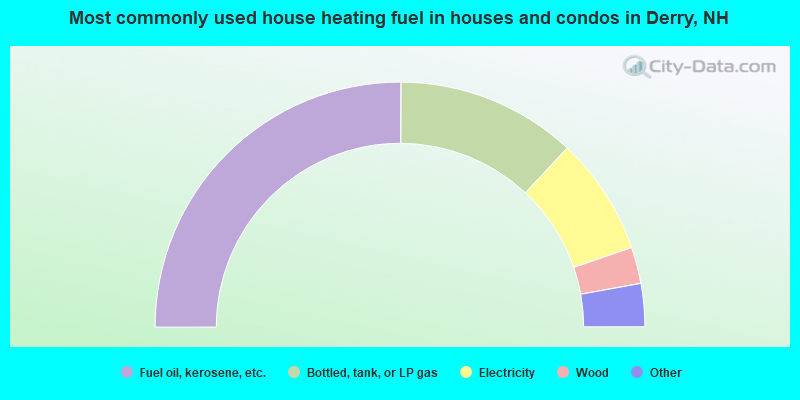
- 50.2%Fuel oil, kerosene, etc.
- 23.8%Bottled, tank, or LP gas
- 15.6%Electricity
- 4.8%Wood
- 3.0%Other fuel
- 2.4%Utility gas
- 0.3%No fuel used
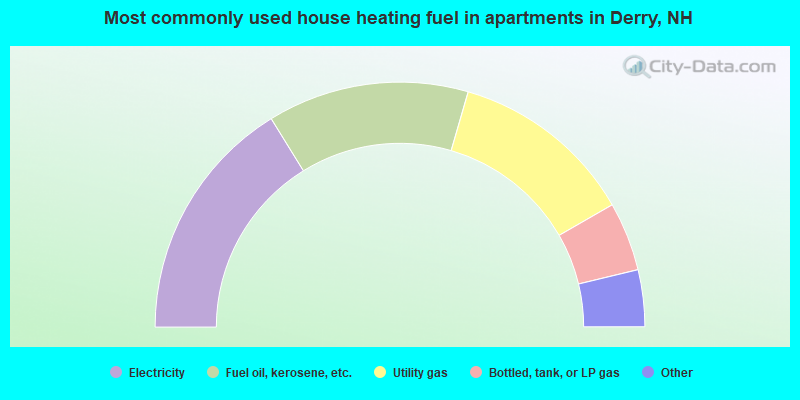
- 32.4%Electricity
- 26.6%Fuel oil, kerosene, etc.
- 24.4%Utility gas
- 9.1%Bottled, tank, or LP gas
- 3.6%No fuel used
- 2.0%Other fuel
- 1.3%Wood
- 0.5%Coal or coke
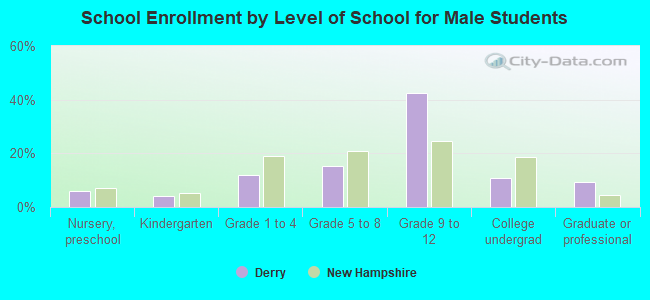
Private vs. public school enrollment:
| Here: | 3.6% |
| New Hampshire: | 11.4% |
| Here: | 29.9% |
| New Hampshire: | 14.0% |
| Here: | 38.9% |
| New Hampshire: | 38.0% |