Dinuba, CA (California) Houses and Residents
| Dinuba: | $296,425 |
| California: | $715,900 |
Total population: 23,667 (Urban population: 16,834 (all inside urban clusters), Rural population: 44 (all nonfarm))
Houses: 6,809 (6,512 occupied: 3,837 owner occupied, 2,659 renter occupied)
| % of renters here: | 41% |
| State: | 44% |
Housing density: 1,990 houses/condos per square mile
Median price asked for vacant for-sale houses and condos in 2022: $76,072.
Median contract rent in 2022: $881 (lower quartile is $584, upper quartile is $1,094)
Median rent asked for vacant for-rent units in 2022: $1,908
Median gross rent in Dinuba, CA in 2022: $1,138
Housing units in Dinuba with a mortgage: 2,740 (194 second mortgage, 0 home equity loan, 164 both second mortgage and home equity loan)
Houses without a mortgage: 0
Median household income for houses/condos with a mortgage: $98,027
Median household income for apartments without a mortgage: $50,420
Median monthly housing costs: $1,184
Compare current foreclosures near Dinuba, CA:
| Photo | Address | Area | Beds / Baths | Price | Details |
|---|---|---|---|---|---|

|
#1
N Smith Ave
Dinuba, CA 93618
|
1,647 sq. feet
|
2 baths 3 beds |
$304,950
|
show details |

|
#2
S J St
Dinuba, CA 93618
|
1,220 sq. feet
|
1 baths 3 beds |
show details | |

|
#3
Avenue 392
Dinuba, CA 93618
|
1,950 sq. feet
|
2 baths 3 beds |
show details | |

|
#4
W Nebraska Ave
Dinuba, CA 93618
|
3,367 sq. feet
|
2 baths 4 beds |
show details | |

|
#5
S P St
Dinuba, CA 93618
|
1,648 sq. feet
|
2 baths 4 beds |
show details | |

|
#6
W North Way
Dinuba, CA 93618
|
2,125 sq. feet
|
2 baths 4 beds |
show details | |

|
#7
Payan Ave
Dinuba, CA 93618
|
1,428 sq. feet
|
2 baths 4 beds |
show details | |

|
#8
E Marshall Ave
Dinuba, CA 93618
|
1,099 sq. feet
|
- baths - beds |
show details | |

|
#9
Tulip Cir
Dinuba, CA 93618
|
- sq. feet
|
- baths - beds |
show details | |

|
#10
Brookside Dr
Dinuba, CA 93618
|
- sq. feet
|
- baths - beds |
show details |
| Photo | Address | Area | Beds / Baths | Price | Details |
|---|---|---|---|---|---|

|
#11
N Crawford Ave Spc 6
Dinuba, CA 93618
|
- sq. feet
|
- baths - beds |
show details | |

|
#12
Bellis Ave
Dinuba, CA 93618
|
- sq. feet
|
- baths - beds |
show details | |

|
#13
Rosemary Ave Apt 108c
Dinuba, CA 93618
|
- sq. feet
|
- baths - beds |
show details | |

|
#14
E Park Way
Dinuba, CA 93618
|
952 sq. feet
|
- baths - beds |
show details | |

|
#15
Road 74
Dinuba, CA 93618
|
- sq. feet
|
- baths - beds |
show details | |

|
#16
Road 108
Dinuba, CA 93618
|
- sq. feet
|
- baths - beds |
show details | |

|
#17
Autumn Dr
Dinuba, CA 93618
|
- sq. feet
|
- baths - beds |
show details | |

|
#18
N Smith Ave
Dinuba, CA 93618
|
- sq. feet
|
- baths - beds |
show details | |

|
#19
E Gerald Ave
Dinuba, CA 93618
|
1,177 sq. feet
|
- baths - beds |
show details | |

|
#20
N Oakwood Ct
Visalia, CA 93291
|
2,076 sq. feet
|
2 baths 4 beds |
show details |
| Photo | Address | Area | Beds / Baths | Price | Details |
|---|---|---|---|---|---|

|
#21
Farr Road
Goshen, CA 93227
|
1,092 sq. feet
|
2 baths 3 beds |
show details | |

|
#22
E Douglas Ave
Visalia, CA 93292
|
1,795 sq. feet
|
2 baths 3 beds |
show details | |

|
#23
N Conyer St
Visalia, CA 93291
|
1,219 sq. feet
|
2 baths 2 beds |
show details | |

|
#24
E Cypress Ave
Parlier, CA 93648
|
1,120 sq. feet
|
2 baths 3 beds |
show details | |

|
#25
N Jacob St
Visalia, CA 93291
|
1,211 sq. feet
|
2 baths 3 beds |
show details | |

|
#26
E Vine Ct
Visalia, CA 93292
|
2,009 sq. feet
|
3 baths 3 beds |
show details | |

|
#27
N Divisadero St
Visalia, CA 93291
|
885 sq. feet
|
1 baths 1 beds |
show details | |

|
#28
S Fontana St
Visalia, CA 93277
|
1,272 sq. feet
|
2 baths 3 beds |
show details | |

|
#29
S Julianna Ave
Parlier, CA 93648
|
1,426 sq. feet
|
2 baths 4 beds |
show details | |

|
#30
S Verde Vista St
Visalia, CA 93277
|
1,580 sq. feet
|
2 baths 3 beds |
show details |
| Photo | Address | Area | Beds / Baths | Price | Details |
|---|---|---|---|---|---|

|
#31
W Whitendale Ave
Visalia, CA 93277
|
1,885 sq. feet
|
1 baths 3 beds |
show details | |

|
#32
W Sunnyview Ave
Visalia, CA 93291
|
2,289 sq. feet
|
2 baths 4 beds |
show details | |

|
#33
W Walnut Ave
Visalia, CA 93277
|
1,958 sq. feet
|
1 baths 4 beds |
show details | |

|
#34
Harvest Ave
Goshen, CA 93227
|
1,177 sq. feet
|
2 baths 3 beds |
show details | |

|
#35
Skansen St
Kingsburg, CA 93631
|
- sq. feet
|
2 baths 3 beds |
show details | |

|
#36
Northview St
Selma, CA 93662
|
1,469 sq. feet
|
2 baths 4 beds |
show details | |

|
#37
E Chavez Ave
Visalia, CA 93291
|
1,570 sq. feet
|
2 baths 3 beds |
show details | |

|
#38
Gloria Ave
Sanger, CA 93657
|
1,240 sq. feet
|
2 baths 3 beds |
show details | |

|
#39
N Anthony Ct
Visalia, CA 93291
|
1,531 sq. feet
|
2 baths 3 beds |
show details | |

|
#40
E Ostler St
Selma, CA 93662
|
1,089 sq. feet
|
1 baths 3 beds |
show details |
| Photo | Address | Area | Beds / Baths | Price | Details |
|---|---|---|---|---|---|

|
#41
W Delta Ave
Visalia, CA 93291
|
1,582 sq. feet
|
2 baths 3 beds |
show details | |

|
#42
N Leslie Ct
Visalia, CA 93291
|
1,077 sq. feet
|
2 baths 3 beds |
show details | |

|
#43
W Robin Ave
Visalia, CA 93291
|
1,018 sq. feet
|
2 baths 3 beds |
show details | |

|
#44
E Modoc Ct
Visalia, CA 93291
|
1,306 sq. feet
|
2 baths 4 beds |
show details | |

|
#45
Myrtle Ave
Sanger, CA 93657
|
925 sq. feet
|
1 baths 2 beds |
show details | |

|
#46
Heather Ave
Ivanhoe, CA 93235
|
1,825 sq. feet
|
2 baths 5 beds |
show details | |

|
#47
W Delta Ave
Visalia, CA 93291
|
1,972 sq. feet
|
2 baths 4 beds |
show details | |

|
#48
W Elowin Ave
Visalia, CA 93291
|
1,637 sq. feet
|
2 baths 3 beds |
show details | |

|
#49
Hoag Ave
Sanger, CA 93657
|
1,096 sq. feet
|
1 baths 3 beds |
show details | |

|
Check over 1 million property listings on Foreclosure.com!
|
browse all offers | |||

Latest news about housing in Dinuba, CA collected exclusively by city-data.com from local newspapers, TV, and radio stations

 | San Joaquin Valley Gentrification thread(Fresno, Merced, Stockton, Bakersfield) (351 replies) |
| Considering moving to Visalia, could use some input (3 replies) |
| Where to live in the Central Valley? (10 replies) |
| Area in between route 99 and I5 (17 replies) |
| The Central Valley (sans Sacramento) (11 replies) |
| Nonwhite youth population growing in California and nation, report finds (30 replies) |

Median year apartment built: 1975
Household type by relationship:
Households: 24,926- Male householders: 2,922 (245 living alone), Female householders: 3,519 (385 living alone)
3,266 spouses (3,243 opposite-sex spouses), 373 unmarried partners, (373 opposite-sex unmarried partners), 10,299 children (10,125 natural, 79 adopted, 93 stepchildren), 1,392 grandchildren, 580 brothers or sisters, 776 parents, 26 foster children, 1,143 other relatives, 391 non-relatives
- In group quarters: 235
Size of family households: 1,355 2-persons, 1,045 3-persons, 1,023 4-persons, 1,139 5-persons, 739 6-persons, 266 7-or-more-persons.
Size of nonfamily households: 666 1-person, 124 2-persons, 29 3-persons, 97 5-persons.
3,881 married couples with children.
3,157 single-parent households (441 men, 2,716 women).
34.9% of residents of Dinuba speak English at home.
66.5% of residents speak Spanish at home (64% speak English very well, 11% speak English well, 12% speak English not well, 14% don't speak English at all).
0.4% of residents speak other Indo-European language at home (88% speak English very well, 12% speak English not well).
0.1% of residents speak Asian or Pacific Island language at home (83% speak English very well, 17% speak English well).
0.1% of residents speak other language at home (88% speak English very well, 12% speak English not well).
Foreign born population: 6,162 (24.7%)
(40.6% of them are naturalized citizens)
| Here: | 5.6 |
| State: | 6.0 |
| Here: | 4.6 |
| State: | 3.9 |

- Bedrooms in owner-occupied houses and condos in Dinuba, California
- 40no bedroom
- 141 bedroom
- 5032 bedrooms
- 2,2003 bedrooms
- 9364 bedrooms
- 1455+ bedrooms

- Bedrooms in renter-occupied apartments in Dinuba, California
- 46no bedroom
- 2611 bedroom
- 1,0322 bedrooms
- 1,1633 bedrooms
- 1374 bedrooms
- 205+ bedrooms

- Cars and other vehicles available in Dinuba in owner-occupied houses/condos
- 144no vehicle
- 6961 vehicle
- 1,3142 vehicles
- 1,0403 vehicles
- 5164 vehicles
- 1285+ vehicles

- Cars and other vehicles available in Dinuba in renter-occupied apartments
- 172no vehicle
- 1,2711 vehicle
- 8752 vehicles
- 2213 vehicles
- 534 vehicles
- 685+ vehicles
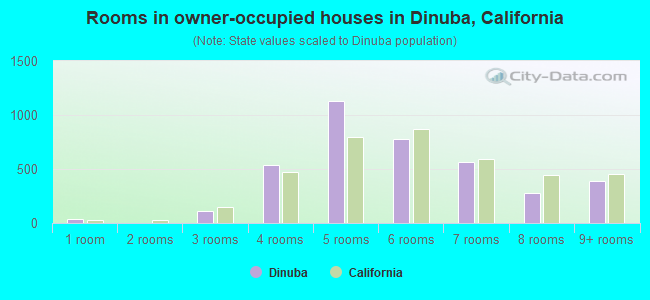
- Rooms in owner-occupied houses in Dinuba, California
- 401 room
- 02 rooms
- 1123 rooms
- 5404 rooms
- 1,1295 rooms
- 7826 rooms
- 5667 rooms
- 2798 rooms
- 3909+ rooms

- Rooms in renter-occupied apartments in Dinuba, California
- 461 room
- 152 rooms
- 4323 rooms
- 8154 rooms
- 8425 rooms
- 3936 rooms
- 637 rooms
- 118 rooms
- 429+ rooms


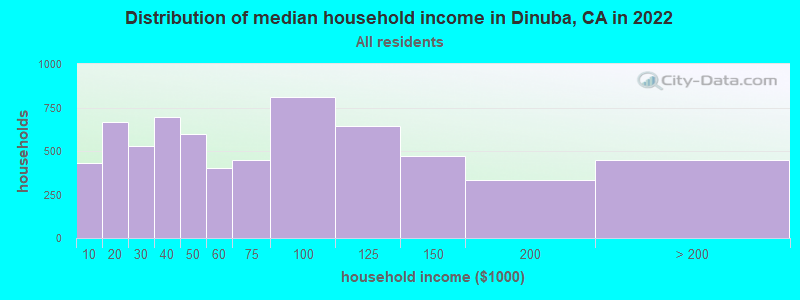
Dinuba, CA household income distribution

- 429Less than $10,000
- 668$10,000 to $19,999
- 530$20,000 to $29,999
- 694$30,000 to $39,999
- 599$40,000 to $49,999
- 403$50,000 to $59,999
- 447$60,000 to $74,999
- 812$75,000 to $99,999
- 641$100,000 to $124,999
- 472$125,000 to $149,999
- 331$150,000 to $199,999
- 446$200,000 or more
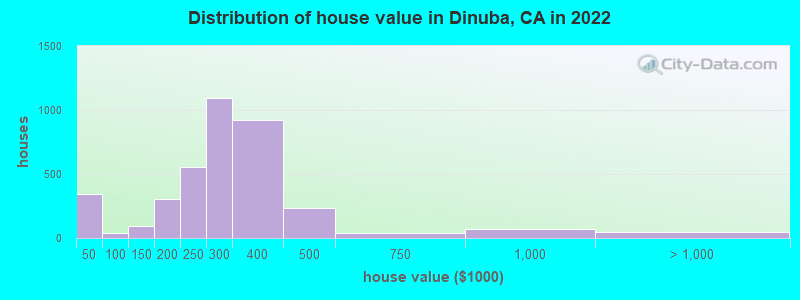
Home value of owner - occupied houses in 2022 in Dinuba, CA
-
- 136Less than $10,000
- 23$15,000 to $19,999
- 46$20,000 to $24,999
- 51$25,000 to $29,999
- 63$30,000 to $34,999
- 21$35,000 to $39,999
- 17$50,000 to $59,999
- 2$80,000 to $89,999
- 17$90,000 to $99,999
- 54$100,000 to $124,999
- 35$125,000 to $149,999
- 172$150,000 to $174,999
- 129$175,000 to $199,999
- 556$200,000 to $249,999
- 1,097$250,000 to $299,999
- 922$300,000 to $399,999
- 234$400,000 to $499,999
- 38$500,000 to $749,999
- 69$750,000 to $999,999
- 27$1,000,000 to $1,499,999
- 18$1,500,000 to $1,999,999
Rent paid by renters in 2022 in Dinuba, CA
-
- 125Less than $100
- 126$100 to $149
- 5$150 to $199
- 21$200 to $249
- 25$250 to $299
- 17$300 to $349
- 26$400 to $449
- 44$450 to $499
- 38$500 to $549
- 100$550 to $599
- 144$600 to $649
- 30$650 to $699
- 100$700 to $749
- 130$750 to $799
- 252$800 to $899
- 371$900 to $999
- 599$1,000 to $1,249
- 107$1,250 to $1,499
- 111$1,500 to $1,999
- 15$2,000 to $2,499
- 15$3,000 to $3,499
- 59No cash rent


Percentage of workers working in this county: 64.9%
Number of people working at home: 270 (2.8% of all workers)
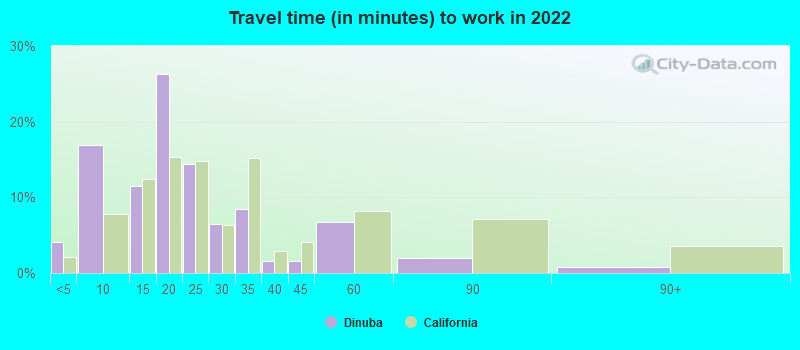
Travel time to work (commute)
- Less than 5 minutes: 246
- 5 to 9 minutes: 1,420
- 10 to 14 minutes: 984
- 15 to 19 minutes: 1,532
- 20 to 24 minutes: 1,262
- 25 to 29 minutes: 662
- 30 to 34 minutes: 1,465
- 35 to 39 minutes: 77
- 40 to 44 minutes: 457
- 45 to 59 minutes: 961
- 60 to 89 minutes: 298
- 90 or more minutes: 134
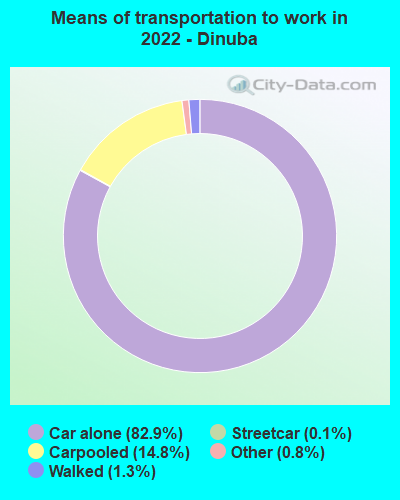
Means of transportation to work:
- Drove a car alone: 5,697 (77.4%)
- Carpooled: 1,273 (17.3%)
- Subway or elevated rail: 9 (0.1%)
- Taxi: 45 (0.6%)
- Walked: 83 (1.1%)
- Worked at home: 270 (3.7%)

- Unemployment by race in 2022
- Unemployment rate for White non-Hispanic residents
- 2.4%Males
- 8.0%Females
- Unemployment rate for American Indian and Alaska Native residents
- 14.4%Males
- 3.3%Females
- Unemployment rate for other race residents
- 10.7%Males
- 6.2%Females
- Unemployment rate for two or more race residents
- 8.1%Males
- 3.1%Females
- Unemployment rate for Hispanic or Latino residents
- 10.0%Males
- 6.3%Females

- Year of entry for the foreign-born population in Dinuba, California
- 6622010 or later
- 1,7432000 to 2009
- 1,1971990 to 1999
- 1,4221980 to 1989
- 8181970 to 1979
- 675Before 1970

First ancestries reported:
- American: 482 (2.8%)
- English: 156 (0.9%)
- German: 85 (0.5%)
- Armenian: 59 (0.3%)
- Irish: 59 (0.3%)
- European: 29 (0.2%)
- Welsh: 26 (0.1%)
- Swiss: 18 (0.1%)
- Greek: 6 (0.03%)
Most common places of birth for foreign-born residents (%):
| Dinuba: | 94.1% (5,503) |
| California: | 37.2% (3,881,193) |
Place of birth for U.S.-born residents:
- This state: 16,861
- Other state: 1,479
- Northeast: 61
- Midwest: 383
- South: 636
- West: 385
94.1% of Dinuba residents lived in the same house 1 years ago.
Out of people who lived in different houses, 27.2% lived in this county.
Out of people who lived in different counties, 93.6% lived in California.
| Dinuba: | 94.1% |
| State average: | 88.9% |
Education attainment for males 25 years and older:
- No schooling: 497
- Nursery to 4th grade: 290
- 5th and 6th grade: 340
- 7th and 8th grade: 170
- 9th grade: 79
- 10th grade: 55
- 11th grade: 123
- 12th grade, no diploma: 247
- High school graduate (or equivalency): 2,126
- Less than 1 year of college: 530
- Some college more than 1 year, no degree: 845
- Associate degree: 481
- Bachelor's degree: 409
- Master's degree: 205
- Professional school degree: 3
- Doctorate degree: 55

Education attainment for females 25 years and older:
- No schooling: 502
- Nursery to 4th grade: 331
- 5th and 6th grade: 333
- 7th and 8th grade: 53
- 9th grade: 347
- 10th grade: 75
- 11th grade: 61
- 12th grade, no diploma: 229
- High school graduate (or equivalency): 1,961
- Less than 1 year of college: 400
- Some college more than 1 year, no degree: 895
- Associate degree: 881
- Bachelor's degree: 612
- Master's degree: 275
- Professional school degree: 143
- Doctorate degree: 0


Housing units in structures:
- One, detached: 5,030
- One, attached: 85
- Two: 146
- 3 or 4: 380
- 5 to 9: 423
- 10 to 19: 287
- 20 to 49: 102
- 50 or more: 156
- Mobile homes: 195
Median worth of mobile homes: $37,250
Housing units lacking complete kitchen facilities in 2022: 1.6%
House/condo owner moved in on average 13 years ago
Renter moved in on average 6 years ago

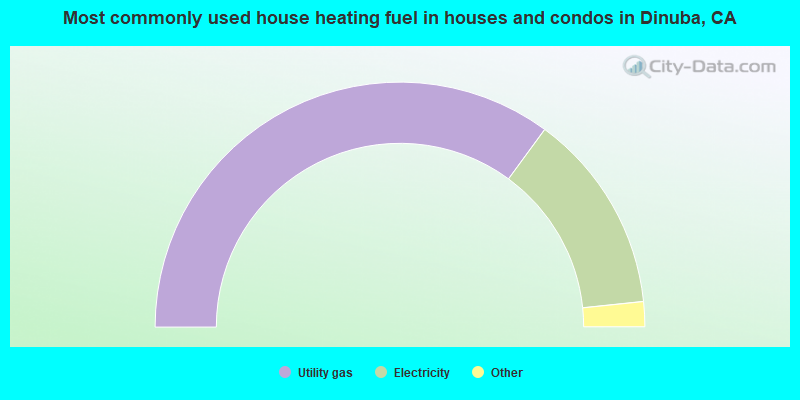
- 70.2%Utility gas
- 26.6%Electricity
- 2.0%Solar energy
- 0.6%Wood
- 0.5%Bottled, tank, or LP gas
- 0.1%Other fuel

- 60.2%Utility gas
- 35.9%Electricity
- 1.6%Bottled, tank, or LP gas
- 1.4%Wood
- 0.6%No fuel used
- 0.3%Solar energy
Private vs. public school enrollment:
| Here: | 13.5% |
| California: | 10.5% |
| Here: | 0.0% |
| California: | 8.5% |
| Here: | 13.5% |
| California: | 15.9% |


