Dinuba, California Submit your own pictures of this city and show them to the world
OSM Map
General Map
Google Map
MSN Map
OSM Map
General Map
Google Map
MSN Map
OSM Map
General Map
Google Map
MSN Map
OSM Map
General Map
Google Map
MSN Map
Please wait while loading the map...
Population in 2022: 25,285 (99% urban, 1% rural). Population change since 2000: +50.1%Males: 12,576 Females: 12,709
March 2022 cost of living index in Dinuba: 89.0 (less than average, U.S. average is 100) Percentage of residents living in poverty in 2022: 27.8%for White Non-Hispanic residents , 33.3% for Black residents , 29.2% for Hispanic or Latino residents , 14.4% for American Indian residents , 31.7% for other race residents , 29.6% for two or more races residents )
Profiles of local businesses
Business Search - 14 Million verified businesses
Data:
Median household income ($)
Median household income (% change since 2000)
Household income diversity
Ratio of average income to average house value (%)
Ratio of average income to average rent
Median household income ($) - White
Median household income ($) - Black or African American
Median household income ($) - Asian
Median household income ($) - Hispanic or Latino
Median household income ($) - American Indian and Alaska Native
Median household income ($) - Multirace
Median household income ($) - Other Race
Median household income for houses/condos with a mortgage ($)
Median household income for apartments without a mortgage ($)
Races - White alone (%)
Races - White alone (% change since 2000)
Races - Black alone (%)
Races - Black alone (% change since 2000)
Races - American Indian alone (%)
Races - American Indian alone (% change since 2000)
Races - Asian alone (%)
Races - Asian alone (% change since 2000)
Races - Hispanic (%)
Races - Hispanic (% change since 2000)
Races - Native Hawaiian and Other Pacific Islander alone (%)
Races - Native Hawaiian and Other Pacific Islander alone (% change since 2000)
Races - Two or more races (%)
Races - Two or more races (% change since 2000)
Races - Other race alone (%)
Races - Other race alone (% change since 2000)
Racial diversity
Unemployment (%)
Unemployment (% change since 2000)
Unemployment (%) - White
Unemployment (%) - Black or African American
Unemployment (%) - Asian
Unemployment (%) - Hispanic or Latino
Unemployment (%) - American Indian and Alaska Native
Unemployment (%) - Multirace
Unemployment (%) - Other Race
Population density (people per square mile)
Population - Males (%)
Population - Females (%)
Population - Males (%) - White
Population - Males (%) - Black or African American
Population - Males (%) - Asian
Population - Males (%) - Hispanic or Latino
Population - Males (%) - American Indian and Alaska Native
Population - Males (%) - Multirace
Population - Males (%) - Other Race
Population - Females (%) - White
Population - Females (%) - Black or African American
Population - Females (%) - Asian
Population - Females (%) - Hispanic or Latino
Population - Females (%) - American Indian and Alaska Native
Population - Females (%) - Multirace
Population - Females (%) - Other Race
Coronavirus confirmed cases (May 18, 2024)
Deaths caused by coronavirus (May 18, 2024)
Coronavirus confirmed cases (per 100k population) (May 18, 2024)
Deaths caused by coronavirus (per 100k population) (May 18, 2024)
Daily increase in number of cases (May 18, 2024)
Weekly increase in number of cases (May 18, 2024)
Cases doubled (in days) (May 18, 2024)
Hospitalized patients (Apr 18, 2022)
Negative test results (Apr 18, 2022)
Total test results (Apr 18, 2022)
COVID Vaccine doses distributed (per 100k population) (Sep 19, 2023)
COVID Vaccine doses administered (per 100k population) (Sep 19, 2023)
COVID Vaccine doses distributed (Sep 19, 2023)
COVID Vaccine doses administered (Sep 19, 2023)
Likely homosexual households (%)
Likely homosexual households (% change since 2000)
Likely homosexual households - Lesbian couples (%)
Likely homosexual households - Lesbian couples (% change since 2000)
Likely homosexual households - Gay men (%)
Likely homosexual households - Gay men (% change since 2000)
Cost of living index
Median gross rent ($)
Median contract rent ($)
Median monthly housing costs ($)
Median house or condo value ($)
Median house or condo value ($ change since 2000)
Mean house or condo value by units in structure - 1, detached ($)
Mean house or condo value by units in structure - 1, attached ($)
Mean house or condo value by units in structure - 2 ($)
Mean house or condo value by units in structure by units in structure - 3 or 4 ($)
Mean house or condo value by units in structure - 5 or more ($)
Mean house or condo value by units in structure - Boat, RV, van, etc. ($)
Mean house or condo value by units in structure - Mobile home ($)
Median house or condo value ($) - White
Median house or condo value ($) - Black or African American
Median house or condo value ($) - Asian
Median house or condo value ($) - Hispanic or Latino
Median house or condo value ($) - American Indian and Alaska Native
Median house or condo value ($) - Multirace
Median house or condo value ($) - Other Race
Median resident age
Resident age diversity
Median resident age - Males
Median resident age - Females
Median resident age - White
Median resident age - Black or African American
Median resident age - Asian
Median resident age - Hispanic or Latino
Median resident age - American Indian and Alaska Native
Median resident age - Multirace
Median resident age - Other Race
Median resident age - Males - White
Median resident age - Males - Black or African American
Median resident age - Males - Asian
Median resident age - Males - Hispanic or Latino
Median resident age - Males - American Indian and Alaska Native
Median resident age - Males - Multirace
Median resident age - Males - Other Race
Median resident age - Females - White
Median resident age - Females - Black or African American
Median resident age - Females - Asian
Median resident age - Females - Hispanic or Latino
Median resident age - Females - American Indian and Alaska Native
Median resident age - Females - Multirace
Median resident age - Females - Other Race
Commute - mean travel time to work (minutes)
Travel time to work - Less than 5 minutes (%)
Travel time to work - Less than 5 minutes (% change since 2000)
Travel time to work - 5 to 9 minutes (%)
Travel time to work - 5 to 9 minutes (% change since 2000)
Travel time to work - 10 to 19 minutes (%)
Travel time to work - 10 to 19 minutes (% change since 2000)
Travel time to work - 20 to 29 minutes (%)
Travel time to work - 20 to 29 minutes (% change since 2000)
Travel time to work - 30 to 39 minutes (%)
Travel time to work - 30 to 39 minutes (% change since 2000)
Travel time to work - 40 to 59 minutes (%)
Travel time to work - 40 to 59 minutes (% change since 2000)
Travel time to work - 60 to 89 minutes (%)
Travel time to work - 60 to 89 minutes (% change since 2000)
Travel time to work - 90 or more minutes (%)
Travel time to work - 90 or more minutes (% change since 2000)
Marital status - Never married (%)
Marital status - Now married (%)
Marital status - Separated (%)
Marital status - Widowed (%)
Marital status - Divorced (%)
Median family income ($)
Median family income (% change since 2000)
Median non-family income ($)
Median non-family income (% change since 2000)
Median per capita income ($)
Median per capita income (% change since 2000)
Median family income ($) - White
Median family income ($) - Black or African American
Median family income ($) - Asian
Median family income ($) - Hispanic or Latino
Median family income ($) - American Indian and Alaska Native
Median family income ($) - Multirace
Median family income ($) - Other Race
Median year house/condo built
Median year apartment built
Year house built - Built 2005 or later (%)
Year house built - Built 2000 to 2004 (%)
Year house built - Built 1990 to 1999 (%)
Year house built - Built 1980 to 1989 (%)
Year house built - Built 1970 to 1979 (%)
Year house built - Built 1960 to 1969 (%)
Year house built - Built 1950 to 1959 (%)
Year house built - Built 1940 to 1949 (%)
Year house built - Built 1939 or earlier (%)
Average household size
Household density (households per square mile)
Average household size - White
Average household size - Black or African American
Average household size - Asian
Average household size - Hispanic or Latino
Average household size - American Indian and Alaska Native
Average household size - Multirace
Average household size - Other Race
Occupied housing units (%)
Vacant housing units (%)
Owner occupied housing units (%)
Renter occupied housing units (%)
Vacancy status - For rent (%)
Vacancy status - For sale only (%)
Vacancy status - Rented or sold, not occupied (%)
Vacancy status - For seasonal, recreational, or occasional use (%)
Vacancy status - For migrant workers (%)
Vacancy status - Other vacant (%)
Residents with income below the poverty level (%)
Residents with income below 50% of the poverty level (%)
Children below poverty level (%)
Poor families by family type - Married-couple family (%)
Poor families by family type - Male, no wife present (%)
Poor families by family type - Female, no husband present (%)
Poverty status for native-born residents (%)
Poverty status for foreign-born residents (%)
Poverty among high school graduates not in families (%)
Poverty among people who did not graduate high school not in families (%)
Residents with income below the poverty level (%) - White
Residents with income below the poverty level (%) - Black or African American
Residents with income below the poverty level (%) - Asian
Residents with income below the poverty level (%) - Hispanic or Latino
Residents with income below the poverty level (%) - American Indian and Alaska Native
Residents with income below the poverty level (%) - Multirace
Residents with income below the poverty level (%) - Other Race
Air pollution - Air Quality Index (AQI)
Air pollution - CO
Air pollution - NO2
Air pollution - SO2
Air pollution - Ozone
Air pollution - PM10
Air pollution - PM25
Air pollution - Pb
Crime - Murders per 100,000 population
Crime - Rapes per 100,000 population
Crime - Robberies per 100,000 population
Crime - Assaults per 100,000 population
Crime - Burglaries per 100,000 population
Crime - Thefts per 100,000 population
Crime - Auto thefts per 100,000 population
Crime - Arson per 100,000 population
Crime - City-data.com crime index
Crime - Violent crime index
Crime - Property crime index
Crime - Murders per 100,000 population (5 year average)
Crime - Rapes per 100,000 population (5 year average)
Crime - Robberies per 100,000 population (5 year average)
Crime - Assaults per 100,000 population (5 year average)
Crime - Burglaries per 100,000 population (5 year average)
Crime - Thefts per 100,000 population (5 year average)
Crime - Auto thefts per 100,000 population (5 year average)
Crime - Arson per 100,000 population (5 year average)
Crime - City-data.com crime index (5 year average)
Crime - Violent crime index (5 year average)
Crime - Property crime index (5 year average)
1996 Presidential Elections Results (%) - Democratic Party (Clinton)
1996 Presidential Elections Results (%) - Republican Party (Dole)
1996 Presidential Elections Results (%) - Other
2000 Presidential Elections Results (%) - Democratic Party (Gore)
2000 Presidential Elections Results (%) - Republican Party (Bush)
2000 Presidential Elections Results (%) - Other
2004 Presidential Elections Results (%) - Democratic Party (Kerry)
2004 Presidential Elections Results (%) - Republican Party (Bush)
2004 Presidential Elections Results (%) - Other
2008 Presidential Elections Results (%) - Democratic Party (Obama)
2008 Presidential Elections Results (%) - Republican Party (McCain)
2008 Presidential Elections Results (%) - Other
2012 Presidential Elections Results (%) - Democratic Party (Obama)
2012 Presidential Elections Results (%) - Republican Party (Romney)
2012 Presidential Elections Results (%) - Other
2016 Presidential Elections Results (%) - Democratic Party (Clinton)
2016 Presidential Elections Results (%) - Republican Party (Trump)
2016 Presidential Elections Results (%) - Other
2020 Presidential Elections Results (%) - Democratic Party (Biden)
2020 Presidential Elections Results (%) - Republican Party (Trump)
2020 Presidential Elections Results (%) - Other
Ancestries Reported - Arab (%)
Ancestries Reported - Czech (%)
Ancestries Reported - Danish (%)
Ancestries Reported - Dutch (%)
Ancestries Reported - English (%)
Ancestries Reported - French (%)
Ancestries Reported - French Canadian (%)
Ancestries Reported - German (%)
Ancestries Reported - Greek (%)
Ancestries Reported - Hungarian (%)
Ancestries Reported - Irish (%)
Ancestries Reported - Italian (%)
Ancestries Reported - Lithuanian (%)
Ancestries Reported - Norwegian (%)
Ancestries Reported - Polish (%)
Ancestries Reported - Portuguese (%)
Ancestries Reported - Russian (%)
Ancestries Reported - Scotch-Irish (%)
Ancestries Reported - Scottish (%)
Ancestries Reported - Slovak (%)
Ancestries Reported - Subsaharan African (%)
Ancestries Reported - Swedish (%)
Ancestries Reported - Swiss (%)
Ancestries Reported - Ukrainian (%)
Ancestries Reported - United States (%)
Ancestries Reported - Welsh (%)
Ancestries Reported - West Indian (%)
Ancestries Reported - Other (%)
Educational Attainment - No schooling completed (%)
Educational Attainment - Less than high school (%)
Educational Attainment - High school or equivalent (%)
Educational Attainment - Less than 1 year of college (%)
Educational Attainment - 1 or more years of college (%)
Educational Attainment - Associate degree (%)
Educational Attainment - Bachelor's degree (%)
Educational Attainment - Master's degree (%)
Educational Attainment - Professional school degree (%)
Educational Attainment - Doctorate degree (%)
School Enrollment - Nursery, preschool (%)
School Enrollment - Kindergarten (%)
School Enrollment - Grade 1 to 4 (%)
School Enrollment - Grade 5 to 8 (%)
School Enrollment - Grade 9 to 12 (%)
School Enrollment - College undergrad (%)
School Enrollment - Graduate or professional (%)
School Enrollment - Not enrolled in school (%)
School enrollment - Public schools (%)
School enrollment - Private schools (%)
School enrollment - Not enrolled (%)
Median number of rooms in houses and condos
Median number of rooms in apartments
Housing units lacking complete plumbing facilities (%)
Housing units lacking complete kitchen facilities (%)
Density of houses
Urban houses (%)
Rural houses (%)
Households with people 60 years and over (%)
Households with people 65 years and over (%)
Households with people 75 years and over (%)
Households with one or more nonrelatives (%)
Households with no nonrelatives (%)
Population in households (%)
Family households (%)
Nonfamily households (%)
Population in families (%)
Family households with own children (%)
Median number of bedrooms in owner occupied houses
Mean number of bedrooms in owner occupied houses
Median number of bedrooms in renter occupied houses
Mean number of bedrooms in renter occupied houses
Median number of vehichles in owner occupied houses
Mean number of vehichles in owner occupied houses
Median number of vehichles in renter occupied houses
Mean number of vehichles in renter occupied houses
Mortgage status - with mortgage (%)
Mortgage status - with second mortgage (%)
Mortgage status - with home equity loan (%)
Mortgage status - with both second mortgage and home equity loan (%)
Mortgage status - without a mortgage (%)
Average family size
Average family size - White
Average family size - Black or African American
Average family size - Asian
Average family size - Hispanic or Latino
Average family size - American Indian and Alaska Native
Average family size - Multirace
Average family size - Other Race
Geographical mobility - Same house 1 year ago (%)
Geographical mobility - Moved within same county (%)
Geographical mobility - Moved from different county within same state (%)
Geographical mobility - Moved from different state (%)
Geographical mobility - Moved from abroad (%)
Place of birth - Born in state of residence (%)
Place of birth - Born in other state (%)
Place of birth - Native, outside of US (%)
Place of birth - Foreign born (%)
Housing units in structures - 1, detached (%)
Housing units in structures - 1, attached (%)
Housing units in structures - 2 (%)
Housing units in structures - 3 or 4 (%)
Housing units in structures - 5 to 9 (%)
Housing units in structures - 10 to 19 (%)
Housing units in structures - 20 to 49 (%)
Housing units in structures - 50 or more (%)
Housing units in structures - Mobile home (%)
Housing units in structures - Boat, RV, van, etc. (%)
House/condo owner moved in on average (years ago)
Renter moved in on average (years ago)
Year householder moved into unit - Moved in 1999 to March 2000 (%)
Year householder moved into unit - Moved in 1995 to 1998 (%)
Year householder moved into unit - Moved in 1990 to 1994 (%)
Year householder moved into unit - Moved in 1980 to 1989 (%)
Year householder moved into unit - Moved in 1970 to 1979 (%)
Year householder moved into unit - Moved in 1969 or earlier (%)
Means of transportation to work - Drove car alone (%)
Means of transportation to work - Carpooled (%)
Means of transportation to work - Public transportation (%)
Means of transportation to work - Bus or trolley bus (%)
Means of transportation to work - Streetcar or trolley car (%)
Means of transportation to work - Subway or elevated (%)
Means of transportation to work - Railroad (%)
Means of transportation to work - Ferryboat (%)
Means of transportation to work - Taxicab (%)
Means of transportation to work - Motorcycle (%)
Means of transportation to work - Bicycle (%)
Means of transportation to work - Walked (%)
Means of transportation to work - Other means (%)
Working at home (%)
Industry diversity
Most Common Industries - Agriculture, forestry, fishing and hunting, and mining (%)
Most Common Industries - Agriculture, forestry, fishing and hunting (%)
Most Common Industries - Mining, quarrying, and oil and gas extraction (%)
Most Common Industries - Construction (%)
Most Common Industries - Manufacturing (%)
Most Common Industries - Wholesale trade (%)
Most Common Industries - Retail trade (%)
Most Common Industries - Transportation and warehousing, and utilities (%)
Most Common Industries - Transportation and warehousing (%)
Most Common Industries - Utilities (%)
Most Common Industries - Information (%)
Most Common Industries - Finance and insurance, and real estate and rental and leasing (%)
Most Common Industries - Finance and insurance (%)
Most Common Industries - Real estate and rental and leasing (%)
Most Common Industries - Professional, scientific, and management, and administrative and waste management services (%)
Most Common Industries - Professional, scientific, and technical services (%)
Most Common Industries - Management of companies and enterprises (%)
Most Common Industries - Administrative and support and waste management services (%)
Most Common Industries - Educational services, and health care and social assistance (%)
Most Common Industries - Educational services (%)
Most Common Industries - Health care and social assistance (%)
Most Common Industries - Arts, entertainment, and recreation, and accommodation and food services (%)
Most Common Industries - Arts, entertainment, and recreation (%)
Most Common Industries - Accommodation and food services (%)
Most Common Industries - Other services, except public administration (%)
Most Common Industries - Public administration (%)
Occupation diversity
Most Common Occupations - Management, business, science, and arts occupations (%)
Most Common Occupations - Management, business, and financial occupations (%)
Most Common Occupations - Management occupations (%)
Most Common Occupations - Business and financial operations occupations (%)
Most Common Occupations - Computer, engineering, and science occupations (%)
Most Common Occupations - Computer and mathematical occupations (%)
Most Common Occupations - Architecture and engineering occupations (%)
Most Common Occupations - Life, physical, and social science occupations (%)
Most Common Occupations - Education, legal, community service, arts, and media occupations (%)
Most Common Occupations - Community and social service occupations (%)
Most Common Occupations - Legal occupations (%)
Most Common Occupations - Education, training, and library occupations (%)
Most Common Occupations - Arts, design, entertainment, sports, and media occupations (%)
Most Common Occupations - Healthcare practitioners and technical occupations (%)
Most Common Occupations - Health diagnosing and treating practitioners and other technical occupations (%)
Most Common Occupations - Health technologists and technicians (%)
Most Common Occupations - Service occupations (%)
Most Common Occupations - Healthcare support occupations (%)
Most Common Occupations - Protective service occupations (%)
Most Common Occupations - Fire fighting and prevention, and other protective service workers including supervisors (%)
Most Common Occupations - Law enforcement workers including supervisors (%)
Most Common Occupations - Food preparation and serving related occupations (%)
Most Common Occupations - Building and grounds cleaning and maintenance occupations (%)
Most Common Occupations - Personal care and service occupations (%)
Most Common Occupations - Sales and office occupations (%)
Most Common Occupations - Sales and related occupations (%)
Most Common Occupations - Office and administrative support occupations (%)
Most Common Occupations - Natural resources, construction, and maintenance occupations (%)
Most Common Occupations - Farming, fishing, and forestry occupations (%)
Most Common Occupations - Construction and extraction occupations (%)
Most Common Occupations - Installation, maintenance, and repair occupations (%)
Most Common Occupations - Production, transportation, and material moving occupations (%)
Most Common Occupations - Production occupations (%)
Most Common Occupations - Transportation occupations (%)
Most Common Occupations - Material moving occupations (%)
People in Group quarters - Institutionalized population (%)
People in Group quarters - Correctional institutions (%)
People in Group quarters - Federal prisons and detention centers (%)
People in Group quarters - Halfway houses (%)
People in Group quarters - Local jails and other confinement facilities (including police lockups) (%)
People in Group quarters - Military disciplinary barracks (%)
People in Group quarters - State prisons (%)
People in Group quarters - Other types of correctional institutions (%)
People in Group quarters - Nursing homes (%)
People in Group quarters - Hospitals/wards, hospices, and schools for the handicapped (%)
People in Group quarters - Hospitals/wards and hospices for chronically ill (%)
People in Group quarters - Hospices or homes for chronically ill (%)
People in Group quarters - Military hospitals or wards for chronically ill (%)
People in Group quarters - Other hospitals or wards for chronically ill (%)
People in Group quarters - Hospitals or wards for drug/alcohol abuse (%)
People in Group quarters - Mental (Psychiatric) hospitals or wards (%)
People in Group quarters - Schools, hospitals, or wards for the mentally retarded (%)
People in Group quarters - Schools, hospitals, or wards for the physically handicapped (%)
People in Group quarters - Institutions for the deaf (%)
People in Group quarters - Institutions for the blind (%)
People in Group quarters - Orthopedic wards and institutions for the physically handicapped (%)
People in Group quarters - Wards in general hospitals for patients who have no usual home elsewhere (%)
People in Group quarters - Wards in military hospitals for patients who have no usual home elsewhere (%)
People in Group quarters - Juvenile institutions (%)
People in Group quarters - Long-term care (%)
People in Group quarters - Homes for abused, dependent, and neglected children (%)
People in Group quarters - Residential treatment centers for emotionally disturbed children (%)
People in Group quarters - Training schools for juvenile delinquents (%)
People in Group quarters - Short-term care, detention or diagnostic centers for delinquent children (%)
People in Group quarters - Type of juvenile institution unknown (%)
People in Group quarters - Noninstitutionalized population (%)
People in Group quarters - College dormitories (includes college quarters off campus) (%)
People in Group quarters - Military quarters (%)
People in Group quarters - On base (%)
People in Group quarters - Barracks, unaccompanied personnel housing (UPH), (Enlisted/Officer), ;and similar group living quarters for military personnel (%)
People in Group quarters - Transient quarters for temporary residents (%)
People in Group quarters - Military ships (%)
People in Group quarters - Group homes (%)
People in Group quarters - Homes or halfway houses for drug/alcohol abuse (%)
People in Group quarters - Homes for the mentally ill (%)
People in Group quarters - Homes for the mentally retarded (%)
People in Group quarters - Homes for the physically handicapped (%)
People in Group quarters - Other group homes (%)
People in Group quarters - Religious group quarters (%)
People in Group quarters - Dormitories (%)
People in Group quarters - Agriculture workers' dormitories on farms (%)
People in Group quarters - Job Corps and vocational training facilities (%)
People in Group quarters - Other workers' dormitories (%)
People in Group quarters - Crews of maritime vessels (%)
People in Group quarters - Other nonhousehold living situations (%)
People in Group quarters - Other noninstitutional group quarters (%)
Residents speaking English at home (%)
Residents speaking English at home - Born in the United States (%)
Residents speaking English at home - Native, born elsewhere (%)
Residents speaking English at home - Foreign born (%)
Residents speaking Spanish at home (%)
Residents speaking Spanish at home - Born in the United States (%)
Residents speaking Spanish at home - Native, born elsewhere (%)
Residents speaking Spanish at home - Foreign born (%)
Residents speaking other language at home (%)
Residents speaking other language at home - Born in the United States (%)
Residents speaking other language at home - Native, born elsewhere (%)
Residents speaking other language at home - Foreign born (%)
Class of Workers - Employee of private company (%)
Class of Workers - Self-employed in own incorporated business (%)
Class of Workers - Private not-for-profit wage and salary workers (%)
Class of Workers - Local government workers (%)
Class of Workers - State government workers (%)
Class of Workers - Federal government workers (%)
Class of Workers - Self-employed workers in own not incorporated business and Unpaid family workers (%)
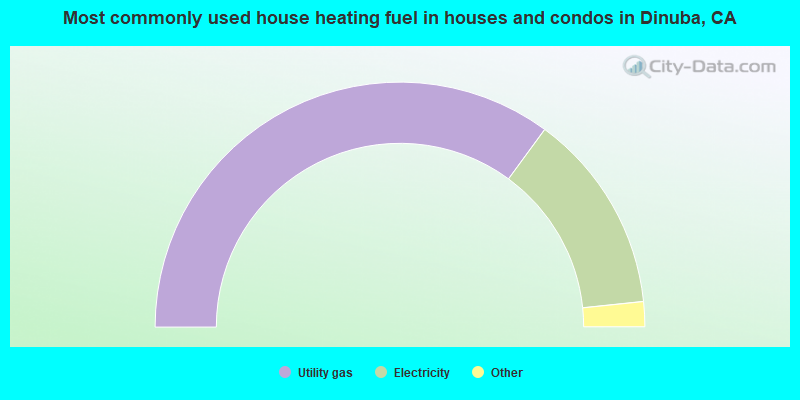
House heating fuel used in houses and condos - Utility gas (%)
House heating fuel used in houses and condos - Bottled, tank, or LP gas (%)
House heating fuel used in houses and condos - Electricity (%)
House heating fuel used in houses and condos - Fuel oil, kerosene, etc. (%)
House heating fuel used in houses and condos - Coal or coke (%)
House heating fuel used in houses and condos - Wood (%)
House heating fuel used in houses and condos - Solar energy (%)
House heating fuel used in houses and condos - Other fuel (%)
House heating fuel used in houses and condos - No fuel used (%)
House heating fuel used in apartments - Utility gas (%)
House heating fuel used in apartments - Bottled, tank, or LP gas (%)
House heating fuel used in apartments - Electricity (%)
House heating fuel used in apartments - Fuel oil, kerosene, etc. (%)
House heating fuel used in apartments - Coal or coke (%)
House heating fuel used in apartments - Wood (%)
House heating fuel used in apartments - Solar energy (%)
House heating fuel used in apartments - Other fuel (%)
House heating fuel used in apartments - No fuel used (%)
Armed forces status - In Armed Forces (%)
Armed forces status - Civilian (%)
Armed forces status - Civilian - Veteran (%)
Armed forces status - Civilian - Nonveteran (%)
Fatal accidents locations in years 2005-2021
Fatal accidents locations in 2005
Fatal accidents locations in 2006
Fatal accidents locations in 2007
Fatal accidents locations in 2008
Fatal accidents locations in 2009
Fatal accidents locations in 2010
Fatal accidents locations in 2011
Fatal accidents locations in 2012
Fatal accidents locations in 2013
Fatal accidents locations in 2014
Fatal accidents locations in 2015
Fatal accidents locations in 2016
Fatal accidents locations in 2017
Fatal accidents locations in 2018
Fatal accidents locations in 2019
Fatal accidents locations in 2020
Fatal accidents locations in 2021
Alcohol use - People drinking some alcohol every month (%)
Alcohol use - People not drinking at all (%)
Alcohol use - Average days/month drinking alcohol
Alcohol use - Average drinks/week
Alcohol use - Average days/year people drink much
Audiometry - Average condition of hearing (%)
Audiometry - People that can hear a whisper from across a quiet room (%)
Audiometry - People that can hear normal voice from across a quiet room (%)
Audiometry - Ears ringing, roaring, buzzing (%)
Audiometry - Had a job exposure to loud noise (%)
Audiometry - Had off-work exposure to loud noise (%)
Blood Pressure & Cholesterol - Has high blood pressure (%)
Blood Pressure & Cholesterol - Checking blood pressure at home (%)
Blood Pressure & Cholesterol - Frequently checking blood cholesterol (%)
Blood Pressure & Cholesterol - Has high cholesterol level (%)
Consumer Behavior - Money monthly spent on food at supermarket/grocery store
Consumer Behavior - Money monthly spent on food at other stores
Consumer Behavior - Money monthly spent on eating out
Consumer Behavior - Money monthly spent on carryout/delivered foods
Consumer Behavior - Income spent on food at supermarket/grocery store (%)
Consumer Behavior - Income spent on food at other stores (%)
Consumer Behavior - Income spent on eating out (%)
Consumer Behavior - Income spent on carryout/delivered foods (%)
Current Health Status - General health condition (%)
Current Health Status - Blood donors (%)
Current Health Status - Has blood ever tested for HIV virus (%)
Current Health Status - Left-handed people (%)
Dermatology - People using sunscreen (%)
Diabetes - Diabetics (%)
Diabetes - Had a blood test for high blood sugar (%)
Diabetes - People taking insulin (%)
Diet Behavior & Nutrition - Diet health (%)
Diet Behavior & Nutrition - Milk product consumption (# of products/month)
Diet Behavior & Nutrition - Meals not home prepared (#/week)
Diet Behavior & Nutrition - Meals from fast food or pizza place (#/week)
Diet Behavior & Nutrition - Ready-to-eat foods (#/month)
Diet Behavior & Nutrition - Frozen meals/pizza (#/month)
Drug Use - People that ever used marijuana or hashish (%)
Drug Use - Ever used hard drugs (%)
Drug Use - Ever used any form of cocaine (%)
Drug Use - Ever used heroin (%)
Drug Use - Ever used methamphetamine (%)
Health Insurance - People covered by health insurance (%)
Kidney Conditions-Urology - Avg. # of times urinating at night
Medical Conditions - People with asthma (%)
Medical Conditions - People with anemia (%)
Medical Conditions - People with psoriasis (%)
Medical Conditions - People with overweight (%)
Medical Conditions - Elderly people having difficulties in thinking or remembering (%)
Medical Conditions - People who ever received blood transfusion (%)
Medical Conditions - People having trouble seeing even with glass/contacts (%)
Medical Conditions - People with arthritis (%)
Medical Conditions - People with gout (%)
Medical Conditions - People with congestive heart failure (%)
Medical Conditions - People with coronary heart disease (%)
Medical Conditions - People with angina pectoris (%)
Medical Conditions - People who ever had heart attack (%)
Medical Conditions - People who ever had stroke (%)
Medical Conditions - People with emphysema (%)
Medical Conditions - People with thyroid problem (%)
Medical Conditions - People with chronic bronchitis (%)
Medical Conditions - People with any liver condition (%)
Medical Conditions - People who ever had cancer or malignancy (%)
Mental Health - People who have little interest in doing things (%)
Mental Health - People feeling down, depressed, or hopeless (%)
Mental Health - People who have trouble sleeping or sleeping too much (%)
Mental Health - People feeling tired or having little energy (%)
Mental Health - People with poor appetite or overeating (%)
Mental Health - People feeling bad about themself (%)
Mental Health - People who have trouble concentrating on things (%)
Mental Health - People moving or speaking slowly or too fast (%)
Mental Health - People having thoughts they would be better off dead (%)
Oral Health - Average years since last visit a dentist
Oral Health - People embarrassed because of mouth (%)
Oral Health - People with gum disease (%)
Oral Health - General health of teeth and gums (%)
Oral Health - Average days a week using dental floss/device
Oral Health - Average days a week using mouthwash for dental problem
Oral Health - Average number of teeth
Pesticide Use - Households using pesticides to control insects (%)
Pesticide Use - Households using pesticides to kill weeds (%)
Physical Activity - People doing vigorous-intensity work activities (%)
Physical Activity - People doing moderate-intensity work activities (%)
Physical Activity - People walking or bicycling (%)
Physical Activity - People doing vigorous-intensity recreational activities (%)
Physical Activity - People doing moderate-intensity recreational activities (%)
Physical Activity - Average hours a day doing sedentary activities
Physical Activity - Average hours a day watching TV or videos
Physical Activity - Average hours a day using computer
Physical Functioning - People having limitations keeping them from working (%)
Physical Functioning - People limited in amount of work they can do (%)
Physical Functioning - People that need special equipment to walk (%)
Physical Functioning - People experiencing confusion/memory problems (%)
Physical Functioning - People requiring special healthcare equipment (%)
Prescription Medications - Average number of prescription medicines taking
Preventive Aspirin Use - Adults 40+ taking low-dose aspirin (%)
Reproductive Health - Vaginal deliveries (%)
Reproductive Health - Cesarean deliveries (%)
Reproductive Health - Deliveries resulted in a live birth (%)
Reproductive Health - Pregnancies resulted in a delivery (%)
Reproductive Health - Women breastfeeding newborns (%)
Reproductive Health - Women that had a hysterectomy (%)
Reproductive Health - Women that had both ovaries removed (%)
Reproductive Health - Women that have ever taken birth control pills (%)
Reproductive Health - Women taking birth control pills (%)
Reproductive Health - Women that have ever used Depo-Provera or injectables (%)
Reproductive Health - Women that have ever used female hormones (%)
Sexual Behavior - People 18+ that ever had sex (vaginal, anal, or oral) (%)
Sexual Behavior - Males 18+ that ever had vaginal sex with a woman (%)
Sexual Behavior - Males 18+ that ever performed oral sex on a woman (%)
Sexual Behavior - Males 18+ that ever had anal sex with a woman (%)
Sexual Behavior - Males 18+ that ever had any sex with a man (%)
Sexual Behavior - Females 18+ that ever had vaginal sex with a man (%)
Sexual Behavior - Females 18+ that ever performed oral sex on a man (%)
Sexual Behavior - Females 18+ that ever had anal sex with a man (%)
Sexual Behavior - Females 18+ that ever had any kind of sex with a woman (%)
Sexual Behavior - Average age people first had sex
Sexual Behavior - Average number of female sex partners in lifetime (males 18+)
Sexual Behavior - Average number of female vaginal sex partners in lifetime (males 18+)
Sexual Behavior - Average age people first performed oral sex on a woman (18+)
Sexual Behavior - Average number of woman performed oral sex on in lifetime (18+)
Sexual Behavior - Average number of male sex partners in lifetime (males 18+)
Sexual Behavior - Average number of male anal sex partners in lifetime (males 18+)
Sexual Behavior - Average age people first performed oral sex on a man (18+)
Sexual Behavior - Average number of male oral sex partners in lifetime (18+)
Sexual Behavior - People using protection when performing oral sex (%)
Sexual Behavior - Average number of times people have vaginal or anal sex a year
Sexual Behavior - People having sex without condom (%)
Sexual Behavior - Average number of male sex partners in lifetime (females 18+)
Sexual Behavior - Average number of male vaginal sex partners in lifetime (females 18+)
Sexual Behavior - Average number of female sex partners in lifetime (females 18+)
Sexual Behavior - Circumcised males 18+ (%)
Sleep Disorders - Average hours sleeping at night
Sleep Disorders - People that has trouble sleeping (%)
Smoking-Cigarette Use - People smoking cigarettes (%)
Taste & Smell - People 40+ having problems with smell (%)
Taste & Smell - People 40+ having problems with taste (%)
Taste & Smell - People 40+ that ever had wisdom teeth removed (%)
Taste & Smell - People 40+ that ever had tonsils teeth removed (%)
Taste & Smell - People 40+ that ever had a loss of consciousness because of a head injury (%)
Taste & Smell - People 40+ that ever had a broken nose or other serious injury to face or skull (%)
Taste & Smell - People 40+ that ever had two or more sinus infections (%)
Weight - Average height (inches)
Weight - Average weight (pounds)
Weight - Average BMI
Weight - People that are obese (%)
Weight - People that ever were obese (%)
Weight - People trying to lose weight (%)
22,634 90.8% Hispanic 1,821 7.3% White alone 392 1.6% Two or more races 205 0.8% Other race alone 100 0.4% Asian alone 79 0.3% Black alone 20 0.08% American Indian alone 2 0.01% Native Hawaiian and Other
Officers per 1,000 residents here:
1.29California average:
2.30
Latest news from Dinuba, CA collected exclusively by city-data.com from local newspapers, TV, and radio stations
Ancestries: American (2.8%).
Current Local Time:
Land area: 3.42 square miles.
Population density: 7,391 people per square mile (high).
5,849 residents are foreign born (23.3% Latin America ).
This city:
23.5%California:
26.5%
Median real estate property taxes paid for housing units with mortgages in 2022: $2,017 (0.7%)Median real estate property taxes paid for housing units with no mortgage in 2022: $2,064 (0.8%)
Nearest city with pop. 50,000+: Visalia, CA
Nearest city with pop. 200,000+: Fresno, CA
Nearest city with pop. 1,000,000+: Los Angeles, CA
Nearest cities:
Monson, CA (2.2 miles),
Latitude: 36.54 N, Longitude: 119.39 W
Nickname or alias (official or unofficial): Raisinland
Daytime population change due to commuting: -2,333 (-9.4%)Workers who live and work in this city: 2,684 (27.7%)
Single-family new house construction building permits:
2022: 41 buildings , average cost: $158,6002021: 96 buildings , average cost: $163,5002020: 90 buildings , average cost: $158,5002019: 236 buildings , average cost: $140,8002018: 97 buildings , average cost: $136,4002017: 72 buildings , average cost: $106,8002016: 21 buildings , average cost: $85,8002015: 115 buildings , average cost: $100,4002014: 24 buildings , average cost: $121,8002013: 84 buildings , average cost: $104,5002012: 50 buildings , average cost: $116,5002011: 64 buildings , average cost: $125,6002010: 245 buildings , average cost: $125,9002009: 67 buildings , average cost: $131,6002008: 44 buildings , average cost: $99,2002007: 125 buildings , average cost: $127,9002006: 154 buildings , average cost: $128,7002005: 86 buildings , average cost: $98,0002004: 43 buildings , average cost: $107,6002003: 37 buildings , average cost: $103,5002002: 39 buildings , average cost: $96,0002001: 82 buildings , average cost: $89,6002000: 74 buildings , average cost: $89,9001999: 95 buildings , average cost: $83,6001998: 72 buildings , average cost: $98,7001997: 38 buildings , average cost: $90,800Unemployment in December 2023: Here:
16.1%California:
5.1%
Population change in the 1990s: +3,750 (+28.6%).
Most common occupations in Dinuba, CA (%)
Both Males Females
Agricultural workers, including supervisors (18.2%)
Other production occupations, including supervisors (6.9%)
Building and grounds cleaning and maintenance occupations (3.8%)
Retail sales workers, except cashiers (3.6%)
Other sales and related occupations, including supervisors (3.5%)
Electrical equipment mechanics and other installation, maintenance, and repair workers, including supervisors (2.9%)
Other management occupations, except farmers and farm managers (2.8%)
Agricultural workers, including supervisors (23.7%)
Other production occupations, including supervisors (6.0%)
Electrical equipment mechanics and other installation, maintenance, and repair workers, including supervisors (5.1%)
Building and grounds cleaning and maintenance occupations (5.1%)
Retail sales workers, except cashiers (4.5%)
Driver/sales workers and truck drivers (4.1%)
Vehicle and mobile equipment mechanics, installers, and repairers (3.4%)
Agricultural workers, including supervisors (10.7%)
Other production occupations, including supervisors (8.3%)
Other teachers, instructors, education, training, and library occupations (5.3%)
Other office and administrative support workers, including supervisors (5.0%)
Other sales and related occupations, including supervisors (4.3%)
Child care workers (3.9%)
Registered nurses (3.2%)
Earthquake activity:
Dinuba-area historical earthquake activity is significantly above California state average. It is 8550% greater than the overall U.S. average. On 7/21/1952 at 11:52:14, a magnitude 7.7 (7.7 UK, Class: Major, Intensity: VIII - XII) earthquake occurred 109.1 miles away from the city center, causing $50,000,000 total damage On 4/18/1906 at 13:12:21, a magnitude 7.9 (7.9 UK) earthquake occurred 222.7 miles away from the city center, causing $524,000,000 total damage On 11/4/1927 at 13:51:53, a magnitude 7.5 (7.5 UK) earthquake occurred 145.6 miles away from Dinuba center On 6/28/1992 at 11:57:34, a magnitude 7.6 (6.2 MB, 7.6 MS, 7.3 MW, Depth: 0.7 mi) earthquake occurred 229.4 miles away from the city center, causing 3 deaths ( 1 shaking deaths, 2 other deaths) and 400 injuries, causing $100,000,000 total damage and $40,000,000 insured lossesOn 12/21/1932 at 06:10:09, a magnitude 7.2 (7.2 UK) earthquake occurred 153.6 miles away from Dinuba center On 10/18/1989 at 00:04:15, a magnitude 7.1 (6.5 MB, 7.1 MS, 6.9 MW, 7.0 ML) earthquake occurred 137.5 miles away from the city center, causing 62 deaths ( 62 shaking deaths) and 3757 injuries, causing $1,305,032,704 total damage Magnitude types: body-wave magnitude (MB), local magnitude (ML), surface-wave magnitude (MS), moment magnitude (MW) Natural disasters: The number of natural disasters in Tulare County (14) is near the US average (15).Major Disasters (Presidential) Declared: 10Emergencies Declared: 2Floods: 8, Storms: 5, Winter Storms: 4, Freezes: 2, Landslides: 2, Drought: 1, Fire: 1, Hurricane: 1, Mudslide: 1, Other: 1 (Note: some incidents may be assigned to more than one category). Hospitals and medical centers in Dinuba: ALTA DISTRICT HSP (500 ADELAIDE WAY)
NEW COVENANT CARE CENTER OF DINUBA (1730 S. COLLEGE AVE.)
Other hospitals and medical centers near Dinuba: GOLDEN LIVINGCENTER- REEDLEY (Nursing Home, about 5 miles away; REEDLEY, CA)
SIERRA VIEW HOMES (Nursing Home, about 5 miles away; REEDLEY, CA)
PALM VILLAGE RETIREMENT COMM. (Nursing Home, about 5 miles away; REEDLEY, CA)
PLEASANT VIEW MANOR (Nursing Home, about 5 miles away; REEDLEY, CA)
KINGS VIEW HOSPITAL (Hospital, about 6 miles away; REEDLEY, CA)
ADVENTIST MEDICAL CENTER - REEDLEY (about 6 miles away; REEDLEY, CA)
SIERRA KINGS DISTRICT HOSPITAL D/P SNF (Nursing Home, about 6 miles away; REEDLEY, CA)
Colleges/universities with over 2000 students nearest to Dinuba:
Reedley College (about 6 miles; Reedley, CA ; Full-time enrollment: 8,144)
San Joaquin Valley College-Visalia (about 16 miles; Visalia, CA ; FT enrollment: 2,386)
College of the Sequoias (about 16 miles; Visalia, CA ; FT enrollment: 6,982)
Fresno Pacific University (about 23 miles; Fresno, CA ; FT enrollment: 3,083)
California State University-Fresno (about 28 miles; Fresno, CA ; FT enrollment: 18,993)
Fresno City College (about 28 miles; Fresno, CA ; FT enrollment: 12,994)
Institute of Technology Inc (about 28 miles; Clovis, CA ; FT enrollment: 2,483)
Public high schools in Dinuba:
Public elementary/middle schools in Dinuba: WASHINGTON INTERMEDIATE Students: 774, Location: 1150 N. HAYES AVE., Grades: 7-8)JOHN F. KENNEDY ELEMENTARY Students: 409, Location: 999 N. CRAWFORD, Grades: KG-6)JEFFERSON ELEMENTARY Students: 372, Location: 1660 E. SIERRA WAY, Grades: KG-6)ROOSEVELT ELEMENTARY Students: 356, Location: 1311 EUCLID AVE., Grades: KG-6)GRAND VIEW ELEMENTARY Students: 219, Location: 39746 RD. 64, Grades: KG-6)LINCOLN ELEMENTARY Location: 850 N. EATON AVE., Grades: KG-6)
WILSON ELEMENTARY Location: 305 E. KAMM AVE., Grades: KG-6)
MONSON-SULTANA ELEMENTARY Location: 10643 AVE. 416, Grades: KG-8)
Private elementary/middle school in Dinuba: DINUBA JR ACADEMY Students: 27, Location: 218 S CRAWFORD AVE, Grades: PK-8)
See full list of schools located in Dinuba User-submitted facts and corrections:
Dinuba Mennonite Brethren Church is one of the larger churches in Dinuba and should be included in church list.Address 110 Nichols Ave. Dinuba, CA 93618 Tel. 591-1176
Notable locations in Dinuba: (A) , Dinuba Womens Club (B) , Dinuba City Hall (C) , Dinuba Branch Tulare County Library (D) , Tulare County Building (E) , Dinuba Senior Citizens Center (F) , Dinuba Public School Administration Building (G) , Dinuba Community Center (H) . Display/hide their locations on the map
Shopping Centers: (1) , Palm Village Shopping Center (2) , Northgate Plaza Shopping Centr (3) . Display/hide their locations on the map
Churches in Dinuba include: (A) , Church of Christ (B) , Dinuba Christian Church (C) , First Baptist Church (D) , First Lutheran Church (E) , First Presbyterian Church (F) , First Southern Baptist Church (G) , Foursquare Gospel Church (H) , Kingdom Hall of Jehovahs Witnesses (I) . Display/hide their locations on the map
Parks in Dinuba include: (1) , College Park (2) , Roosevelt Park (3) . Display/hide their locations on the map
Tourist attraction:
Hotel:
Court:
Birthplace of: Cruz Bustamante - California politician, Bryce DeWitt - Physicist, William Michaelian - Novelist, Stephen H. Burum - Cinematographer, Loren Toews - Football player, Manuel Muñoz (writer) - Short story writer, Russ Letlow - Football player.
Tulare County has a predicted average indoor radon screening level between 2 and 4 pCi/L (pico curies per liter) - Moderate Potential Drinking water stations with addresses in Dinuba and their reported violations in the past:
FRUIT PATCH INC (Population served: 125, Groundwater):
Past health violations:
MCL, Monthly (TCR) - In MAR-2012, Contaminant: Coliform. Follow-up actions: St Violation/Reminder Notice (APR-10-2012), St Compliance achieved (MAY-10-2012)
MCL, Single Sample - Between JUL-2010 and SEP-2010, Contaminant: Nitrate. Follow-up actions: St AO (w/o penalty) issued (AUG-30-2010), St Compliance achieved (DEC-09-2010)
MCL, Single Sample - Between JAN-2010 and DEC-2010, Contaminant: Nitrate. Follow-up actions: St AO (w/o penalty) issued (AUG-30-2010), St Compliance achieved (DEC-09-2010)
MCL, Monthly (TCR) - Between JAN-2006 and MAR-2006, Contaminant: Coliform. Follow-up actions: St Formal NOV issued (APR-10-2006), St Compliance achieved (MAY-10-2012)
MCL, Monthly (TCR) - Between JAN-2006 and MAR-2006, Contaminant: Coliform
Past monitoring violations:
3 regular monitoring violations
Population served: 25, Groundwater):
Past health violations:
MCL, Average - Between JAN-2014 and MAR-2014, Contaminant: Nitrate. Follow-up actions: St AO (w/o penalty) issued (JUL-28-2010)
MCL, Average - Between OCT-2013 and DEC-2013, Contaminant: Nitrate. Follow-up actions: St AO (w/o penalty) issued (JUL-28-2010)
MCL, Average - Between JUL-2013 and SEP-2013, Contaminant: Nitrate. Follow-up actions: St AO (w/o penalty) issued (JUL-28-2010)
MCL, Average - Between APR-2013 and JUN-2013, Contaminant: Nitrate. Follow-up actions: St AO (w/o penalty) issued (JUL-28-2010)
MCL, Average - Between JAN-2013 and MAR-2013, Contaminant: Nitrate. Follow-up actions: St AO (w/o penalty) issued (JUL-28-2010)
MCL, Average - Between OCT-2012 and DEC-2012, Contaminant: Nitrate. Follow-up actions: St AO (w/o penalty) issued (JUL-28-2010)
17 other older health violations
Past monitoring violations:
4 routine major monitoring violations
Population served: 25, Groundwater):
Past health violations:
MCL, Average - Between JAN-2014 and MAR-2014, Contaminant: Nitrate. Follow-up actions: St AO (w/o penalty) issued (JUL-28-2010)
MCL, Average - Between OCT-2013 and DEC-2013, Contaminant: Nitrate. Follow-up actions: St AO (w/o penalty) issued (JUL-28-2010)
MCL, Monthly (TCR) - In SEP-2013, Contaminant: Coliform. Follow-up actions: St AO (w/o penalty) issued (OCT-10-2013)
MCL, Average - Between JUL-2013 and SEP-2013, Contaminant: Nitrate. Follow-up actions: St AO (w/o penalty) issued (JUL-28-2010)
MCL, Average - Between APR-2013 and JUN-2013, Contaminant: Nitrate. Follow-up actions: St AO (w/o penalty) issued (JUL-28-2010)
MCL, Average - Between JAN-2013 and MAR-2013, Contaminant: Nitrate. Follow-up actions: St AO (w/o penalty) issued (JUL-28-2010)
23 other older health violations
Past monitoring violations:
One regular monitoring violation
Average household size: This city:
3.8 peopleCalifornia:
2.9 people
Percentage of family households: This city:
84.4%Whole state:
68.7%
Percentage of households with unmarried partners: This city:
10.4%Whole state:
7.2%
Likely homosexual households (counted as self-reported same-sex unmarried-partner households)
Lesbian couples: 0.3% of all households Gay men: 0.3% of all households
People in group quarters in Dinuba in 2010:
85 people in nursing facilities/skilled-nursing facilities
40 people in group homes intended for adults
30 people in workers' group living quarters and job corps centers
7 people in emergency and transitional shelters (with sleeping facilities) for people experiencing homelessness
People in group quarters in Dinuba in 2000:
78 people in nursing homes
20 people in agriculture workers' dormitories on farms
16 people in other noninstitutional group quarters
Banks with branches in Dinuba (2011 data):
Bank of the Sierra: Dinuba Branch at 401 East Tulare Street, branch established on 1885/01/01. Info updated 2006/11/03: Bank assets: $1,332.3 mil, Deposits: $1,091.7 mil, headquarters in Porterville, CA, positive income , Commercial Lending Specialization, 26 total offices , Holding Company: Sierra Bancorp
Bank of the West: Dinuba Branch at 345 East Tulare Street, branch established on 1926/01/01. Info updated 2009/11/16: Bank assets: $62,408.3 mil, Deposits: $43,995.2 mil, headquarters in San Francisco, CA, positive income , 647 total offices , Holding Company: Bnp Paribas
Bank of America, National Association: Dinuba Branch at 240 East Tulare Street, branch established on 1904/10/17. Info updated 2009/11/18: Bank assets: $1,451,969.3 mil, Deposits: $1,077,176.8 mil, headquarters in Charlotte, NC, positive income , 5782 total offices , Holding Company: Bank Of America Corporation
Rabobank, National Association: Dinuba Branch at 130 East Tulare Street, branch established on 1980/01/02. Info updated 2011/01/27: Bank assets: $11,745.0 mil, Deposits: $8,446.0 mil, headquarters in Roseville, CA, positive income , Agricultural Specialization, 124 total offices , Holding Company: Cooperatieve Centrale Raiffeisen-Boerenleenbank B.A., "rabobank Nederland
For population 15 years and over in Dinuba:
Never married: 42.2%Now married: 42.2%Separated: 2.4%Widowed: 5.5%Divorced: 7.7% For population 25 years and over in Dinuba:
High school or higher: 71.4%Bachelor's degree or higher: 12.3%Graduate or professional degree: 5.1%Unemployed: 18.4%Mean travel time to work (commute): 23.8 minutes
Education Gini index (Inequality in education) Here:
20.3California average:
15.5
Religion statistics for Dinuba, CA (based on Tulare County data)
Religion Adherents Congregations Catholic 102,772 26 Evangelical Protestant 53,285 300 Other 13,983 37 Mainline Protestant 8,690 37 Black Protestant 757 5 Orthodox 650 2 None 262,042 -
Source: Clifford Grammich, Kirk Hadaway, Richard Houseal, Dale E.Jones, Alexei Krindatch, Richie Stanley and Richard H.Taylor. 2012. 2010 U.S.Religion Census: Religious Congregations & Membership Study. Association of Statisticians of American Religious Bodies. Jones, Dale E., et al. 2002. Congregations and Membership in the United States 2000. Nashville, TN: Glenmary Research Center. Graphs represent county-level data
Food Environment Statistics: Number of grocery stores : 119Tulare County :
2.84 / 10,000 pop.California :
2.14 / 10,000 pop.
Number of supercenters and club stores : 3Tulare County :
0.07 / 10,000 pop.California :
0.04 / 10,000 pop.
Number of convenience stores (no gas) : 32Here :
0.76 / 10,000 pop.State :
0.62 / 10,000 pop.
Number of convenience stores (with gas) : 89This county :
2.12 / 10,000 pop.State :
1.49 / 10,000 pop.
Number of full-service restaurants : 215Tulare County :
5.13 / 10,000 pop.State :
7.42 / 10,000 pop.
Adult diabetes rate : Tulare County :
7.3%California :
7.3%
Adult obesity rate : Tulare County :
28.2%California :
21.3%
Low-income preschool obesity rate : This county :
16.9%California :
17.9%
Health and Nutrition:
Average overall health of teeth and gums : Dinuba:
45.9%California:
48.0%
Average BMI : Dinuba:
28.4California:
28.1
People feeling badly about themselves : Dinuba:
23.0%California:
20.2%
People not drinking alcohol at all : Average hours sleeping at night : Overweight people : Dinuba:
30.7%California:
31.5%
General health condition : This city:
53.6%California:
56.4%
Average condition of hearing : Dinuba:
81.1%California:
80.9%
More about Health and Nutrition of Dinuba, CA Residents
Local government employment and payroll (March 2022)
Function
Full-time employees
Monthly full-time payroll
Average yearly full-time wage
Part-time employees
Monthly part-time payroll
Police Protection - Officers
34 $352,375 $124,368 0 $0 Firefighters
26 $196,443 $90,666 2 $143 Streets and Highways
15 $67,826 $54,261 1 $2,699 Police - Other
14 $76,829 $65,853 0 $0 Financial Administration
13 $57,556 $53,129 0 $0 Parks and Recreation
10 $43,409 $52,091 34 $33,870 Other Government Administration
7 $70,804 $121,378 5 $1,875 Fire - Other
5 $38,637 $92,729 0 $0 Sewerage
4 $19,415 $58,245 0 $0 Other and Unallocable
3 $14,121 $56,484 3 $4,329 Water Supply
2 $8,901 $53,406 0 $0 Solid Waste Management
1 $4,601 $55,212 0 $0 Health
0 $0 1 $2,365
Totals for Government
134 $950,916 $85,157 46 $45,281
Dinuba government finances - Expenditure in 2017 (per resident):
Construction - Sewerage: $1,863,000 ($73.68)
Regular Highways: $1,748,000 ($69.13)Housing and Community Development: $514,000 ($20.33)General - Other: $498,000 ($19.70)Local Fire Protection: $299,000 ($11.83)Protective Inspection and Regulation - Other: $245,000 ($9.69)Water Utilities: $132,000 ($5.22)Current Operations - Police Protection: $8,633,000 ($341.43)
Central Staff Services: $6,364,000 ($251.69)Parks and Recreation: $4,069,000 ($160.93)Solid Waste Management: $3,129,000 ($123.75)Regular Highways: $2,299,000 ($90.92)Water Utilities: $2,298,000 ($90.88)Local Fire Protection: $2,188,000 ($86.53)Sewerage: $2,155,000 ($85.23)Transit Utilities: $2,139,000 ($84.60)Health - Other: $1,402,000 ($55.45)Financial Administration: $537,000 ($21.24)Housing and Community Development: $270,000 ($10.68)Gas Utilities: $141,000 ($5.58)General - Interest on Debt: $4,940,000 ($195.37)
Other Capital Outlay - Regular Highways: $1,133,000 ($44.81)
Sewerage: $554,000 ($21.91)Judicial and Legal Services: $209,000 ($8.27)General - Other: $196,000 ($7.75)Housing and Community Development: $178,000 ($7.04)Police Protection: $98,000 ($3.88)Central Staff Services: $66,000 ($2.61)Parks and Recreation: $42,000 ($1.66)Total Salaries and Wages: $76,000 ($3.01)
Transit Utilities - Interest on Debt: $1,000 ($0.04)
Water Utilities - Interest on Debt: $156,000 ($6.17)
Dinuba government finances - Revenue in 2017 (per resident):
Charges - Solid Waste Management: $3,090,000 ($122.21)
Other: $3,009,000 ($119.00)Sewerage: $2,948,000 ($116.59)Parks and Recreation: $2,262,000 ($89.46)Regular Highways: $403,000 ($15.94)Federal Intergovernmental - Other: $2,415,000 ($95.51)
Transit Utilities: $268,000 ($10.60)Local Intergovernmental - Transit Utilities: $516,000 ($20.41)
Other: $73,000 ($2.89)Miscellaneous - General Revenue - Other: $2,346,000 ($92.78)
Special Assessments: $467,000 ($18.47)Interest Earnings: $329,000 ($13.01)Fines and Forfeits: $52,000 ($2.06)Revenue - Water Utilities: $2,716,000 ($107.42)
Transit Utilities: $231,000 ($9.14)Gas Utilities: $200,000 ($7.91)State Intergovernmental - Health and Hospitals: $1,370,000 ($54.18)
Transit Utilities: $1,182,000 ($46.75)Highways: $720,000 ($28.48)Other: $85,000 ($3.36)General Local Government Support: $6,000 ($0.24)Tax - General Sales and Gross Receipts: $9,808,000 ($387.90)
Property: $6,864,000 ($271.47)Other: $2,964,000 ($117.22)Public Utilities Sales: $1,698,000 ($67.15)Other License: $1,065,000 ($42.12)Other Selective Sales: $281,000 ($11.11)Occupation and Business License - Other: $221,000 ($8.74)Documentary and Stock Transfer: $41,000 ($1.62)
Dinuba government finances - Debt in 2017 (per resident):
Long Term Debt - Beginning Outstanding - Unspecified Public Purpose: $82,116,000 ($3247.62)
Outstanding Unspecified Public Purpose: $81,234,000 ($3212.73)Retired Unspecified Public Purpose: $26,370,000 ($1042.91)Issue, Unspecified Public Purpose: $25,489,000 ($1008.07)
Dinuba government finances - Cash and Securities in 2017 (per resident):
Bond Funds - Cash and Securities: $6,059,000 ($239.63)
Other Funds - Cash and Securities: $40,191,000 ($1589.52)
Sinking Funds - Cash and Securities: $3,798,000 ($150.21)
3.84% of this county's 2021 resident taxpayers lived in other counties in 2020 ($53,510 average adjusted gross income )
Here:
3.84%California average:
5.19%
0.01% of residents moved from foreign countries ($107 average AGI )Tulare County:
0.01%California average:
0.03%
Top counties from which taxpayers relocated into this county between 2020 and 2021:
3.70% of this county's 2020 resident taxpayers moved to other counties in 2021 ($58,158 average adjusted gross income )
Here:
3.70%California average:
6.14%
0.01% of residents moved to foreign countries ($170 average AGI )Tulare County:
0.01%California average:
0.02%
Top counties to which taxpayers relocated from this county between 2020 and 2021:
Businesses in Dinuba, CA
Name Count Name Count
Ace Hardware 1 MasterBrand Cabinets 1 AutoZone 1 McDonald's 2 Baskin-Robbins 1 Nike 1 Best Western 1 Panda Express 1 Burger King 1 Payless 1 Carl\s Jr. 1 Penske 1 Chevrolet 1 Pizza Hut 1 Circle K 1 RadioShack 1 Cricket Wireless 3 Rite Aid 2 FedEx 2 SAS Shoes 1 GNC 2 Sears 1 GameStop 1 Sprint Nextel 1 H&R Block 1 Starbucks 1 Holiday Inn 1 T-Mobile 3 IHOP 1 Taco Bell 1 Jack In The Box 1 U-Haul 1 Jones New York 1 UPS 1 KFC 1 Vans 1 Kmart 1 Walgreens 1 Little Caesars Pizza 1 Walmart 1 Long John Silver's 1
Strongest AM radio stations in Dinuba:
KWRU (940 AM; 50 kW; FRESNO, CA)
KMJ (580 AM; 50 kW; FRESNO, CA; Owner: INFINITY RADIO OPERATIONS INC.)
KRDU (1130 AM; 6 kW; DINUBA, CA; Owner: CAPSTAR TX LIMITED PARTNERSHIP)
KOOR (790 AM; 10 kW; CLOVIS, CA; Owner: INFINITY RADIO OPERATIONS INC.)
KERI (1180 AM; 50 kW; WASCO-GREENACRES, CA; Owner: KWSO, INC.)
KIRV (1510 AM; daytime; 10 kW; FRESNO, CA; Owner: GORE-OVERGAARD BROADCASTING, INC)
KYNO (1300 AM; 5 kW; FRESNO, CA; Owner: SPANISH CATHOLIC RADIO OF FRESNO, LLC)
KXEX (1550 AM; 10 kW; FRESNO, CA; Owner: RAK COMMUNICATIONS, INC.)
KAVT (1680 AM; 10 kW; FRESNO, CA; Owner: RAK COMMUNICATIONS, INC.)
KJUG (1270 AM; 5 kW; TULARE, CA; Owner: WESTCOAST BROADCASTING, INC.)
KFIG (1430 AM; 5 kW; FRESNO, CA; Owner: BIG DAWG BROADCASTING, LLC)
KIGS (620 AM; 1 kW; HANFORD, CA; Owner: PERREIRA BROADCASTING)
KGDP (660 AM; 50 kW; ORCUTT, CA; Owner: RADIO REPRESENTATIVES, INC.)
Strongest FM radio stations in Dinuba:
KMAK (100.3 FM; ORANGE COVE, CA; Owner: RICHARD B. SMITH)
K203CM (88.5 FM; SANGER, CA; Owner: EDUCATIONAL MEDIA FOUNDATION)
KWYE (101.1 FM; FRESNO, CA; Owner: INFINITY RADIO OPERATIONS INC.)
KZPO (103.3 FM; LINDSAY, CA; Owner: LINDSAY BROADCASTING)
KDUV (88.9 FM; VISALIA, CA; Owner: COMMUNITY EDUCATIONAL B/CASTNG, INC.)
KJUG-FM (106.7 FM; TULARE, CA; Owner: WESTCOAST BROADCASTING, INC.)
K220EY (91.9 FM; PORTERVILLE, CA; Owner: FAMILY STATIONS, INC.)
KMGV (97.9 FM; FRESNO, CA; Owner: INFINITY RADIO OPERATIONS INC.)
KUFW (90.5 FM; WOODLAKE, CA; Owner: NATIONAL FARM WORKERS SERVICE CENTER)
KFNO (90.3 FM; FRESNO, CA; Owner: FAMILY STATIONS, INC.)
KLBN (105.1 FM; AUBERRY, CA; Owner: LOTUS COMMUNICATIONS CORP.)
KRNC (105.9 FM; FRESNO, CA; Owner: INFINITY RADIO OPERATIONS INC.)
KOQO-FM (101.9 FM; FRESNO, CA; Owner: INFINITY RADIO OPERATIONS INC.)
KFCF (88.1 FM; FRESNO, CA; Owner: FRESNO FREE COLLEGE FOUNDATION)
KVPR (89.3 FM; FRESNO, CA; Owner: WHITE ASH BROADCASTING, INC.)
KSKS (93.7 FM; FRESNO, CA; Owner: INFINITY RADIO OPERATIONS INC.)
KFRR (104.1 FM; WOODLAKE, CA; Owner: IONOSPHERE B/CASTING LTD PARTNERSHIP)
KMQA (100.5 FM; EAST PORTERVILLE, CA; Owner: MOON BROADCASTING PORTERVILLE L.L.C.)
KQKL (88.5 FM; SELMA, CA; Owner: EDUCATIONAL MEDIA FOUNDATION)
KFYE (106.3 FM; KINGSBURG, CA; Owner: EDUCATIONAL MEDIA FOUNDATION)
TV broadcast stations around Dinuba:
KCWB-LP (Channel 13; REEDLEY, CA; Owner: GARY M. COCOLA FAMILY TRUST, GARY M. COCOLA TRUSTEE)
K02OH (Channel 2; FRESNO, CA; Owner: W. R. PORTEE AND LORRAINE PORTEE)
KSDI-LP (Channel 33; FRESNO, CA; Owner: GARY M. COCOLA FAMILY TRUST, GARY M. COCOLA TRUSTEE)
KVPT (Channel 18; FRESNO, CA; Owner: VALLEY PUBLIC TELEVISION, INC.)
KMPH (Channel 26; VISALIA, CA; Owner: PAPPAS TELECASTING INCORPORATED)
KGMC (Channel 43; CLOVIS, CA; Owner: GARY M. COCOLA FAMILY TRUST, GARY M. COCOLA TRUSTEE)
National Bridge Inventory (NBI) Statistics 3 Number of bridges13ft / 4.1m Total length6,460 Total average daily traffic637 Total average daily truck traffic14,935 Total future (year 2041) average daily traffic
Home Mortgage Disclosure Act Aggregated Statistics For Year 2009(Based on 1 full and 2 partial tracts) A) FHA, FSA/RHS & VA B) Conventional C) Refinancings D) Home Improvement Loans F) Non-occupant Loans on G) Loans On Manufactured Number Average Value Number Average Value Number Average Value Number Average Value Number Average Value Number Average Value
LOANS ORIGINATED 60 $148,443 9 $73,309 50 $139,412 0 $0 6 $76,657 1 $18,000 APPLICATIONS APPROVED, NOT ACCEPTED 5 $153,002 4 $136,488 5 $111,722 2 $10,580 1 $103,870 0 $0 APPLICATIONS DENIED 7 $134,711 6 $62,457 54 $146,005 9 $42,117 9 $92,352 2 $65,990 APPLICATIONS WITHDRAWN 10 $130,745 1 $106,620 19 $167,747 0 $0 1 $58,250 0 $0 FILES CLOSED FOR INCOMPLETENESS 0 $0 1 $100,000 6 $139,610 2 $40,000 2 $97,000 0 $0
Aggregated Statistics For Year 2008(Based on 1 full and 2 partial tracts) A) FHA, FSA/RHS & VA B) Conventional C) Refinancings D) Home Improvement Loans F) Non-occupant Loans on G) Loans On Manufactured Number Average Value Number Average Value Number Average Value Number Average Value Number Average Value Number Average Value
LOANS ORIGINATED 43 $164,687 27 $97,027 62 $147,299 13 $121,795 14 $130,242 2 $29,740 APPLICATIONS APPROVED, NOT ACCEPTED 2 $182,085 6 $87,570 30 $150,693 5 $91,860 2 $145,775 3 $46,490 APPLICATIONS DENIED 4 $200,345 12 $134,298 91 $169,837 25 $91,997 11 $166,397 3 $37,210 APPLICATIONS WITHDRAWN 6 $198,813 6 $134,072 34 $169,677 5 $119,792 6 $131,383 0 $0 FILES CLOSED FOR INCOMPLETENESS 0 $0 1 $87,990 7 $180,517 2 $122,765 2 $129,345 0 $0
Aggregated Statistics For Year 2007(Based on 1 full and 2 partial tracts) A) FHA, FSA/RHS & VA B) Conventional C) Refinancings D) Home Improvement Loans E) Loans on Dwellings For 5+ Families F) Non-occupant Loans on G) Loans On Manufactured Number Average Value Number Average Value Number Average Value Number Average Value Number Average Value Number Average Value Number Average Value
LOANS ORIGINATED 9 $173,766 78 $137,904 210 $172,488 34 $115,761 1 $425,000 40 $142,592 3 $45,667 APPLICATIONS APPROVED, NOT ACCEPTED 0 $0 20 $136,962 90 $176,587 10 $110,890 0 $0 9 $199,958 1 $28,000 APPLICATIONS DENIED 0 $0 42 $169,043 219 $195,681 49 $87,939 1 $330,000 32 $145,315 2 $49,380 APPLICATIONS WITHDRAWN 1 $127,000 14 $160,978 87 $189,529 7 $109,984 1 $320,000 4 $147,248 0 $0 FILES CLOSED FOR INCOMPLETENESS 0 $0 3 $131,400 28 $208,054 1 $545,270 0 $0 1 $401,870 0 $0
Aggregated Statistics For Year 2006(Based on 1 full and 2 partial tracts) A) FHA, FSA/RHS & VA B) Conventional C) Refinancings D) Home Improvement Loans E) Loans on Dwellings For 5+ Families F) Non-occupant Loans on G) Loans On Manufactured Number Average Value Number Average Value Number Average Value Number Average Value Number Average Value Number Average Value Number Average Value
LOANS ORIGINATED 19 $155,208 153 $153,745 333 $155,210 56 $91,040 2 $768,580 50 $163,258 1 $15,000 APPLICATIONS APPROVED, NOT ACCEPTED 2 $117,000 44 $150,946 68 $185,656 13 $123,502 0 $0 16 $162,091 0 $0 APPLICATIONS DENIED 2 $163,590 72 $154,231 208 $168,185 30 $99,411 0 $0 32 $170,217 1 $49,000 APPLICATIONS WITHDRAWN 0 $0 28 $139,064 173 $173,343 10 $118,008 1 $1,055,000 13 $156,603 0 $0 FILES CLOSED FOR INCOMPLETENESS 1 $79,190 6 $135,888 41 $168,383 2 $139,345 0 $0 5 $159,964 0 $0
Aggregated Statistics For Year 2005(Based on 1 full and 2 partial tracts) A) FHA, FSA/RHS & VA B) Conventional C) Refinancings D) Home Improvement Loans E) Loans on Dwellings For 5+ Families F) Non-occupant Loans on G) Loans On Manufactured Number Average Value Number Average Value Number Average Value Number Average Value Number Average Value Number Average Value Number Average Value
LOANS ORIGINATED 11 $138,067 227 $140,335 342 $146,593 58 $93,445 2 $3,980,975 51 $132,661 2 $32,025 APPLICATIONS APPROVED, NOT ACCEPTED 0 $0 27 $129,627 55 $140,648 16 $66,064 0 $0 7 $111,449 1 $40,790 APPLICATIONS DENIED 2 $118,215 63 $132,751 189 $139,253 58 $74,284 0 $0 18 $133,721 5 $51,800 APPLICATIONS WITHDRAWN 3 $118,503 33 $141,433 211 $146,956 27 $119,713 0 $0 13 $162,502 1 $21,000 FILES CLOSED FOR INCOMPLETENESS 0 $0 4 $116,288 43 $147,462 1 $40,000 0 $0 6 $100,465 0 $0
Aggregated Statistics For Year 2004(Based on 1 full and 2 partial tracts) A) FHA, FSA/RHS & VA B) Conventional C) Refinancings D) Home Improvement Loans E) Loans on Dwellings For 5+ Families F) Non-occupant Loans on G) Loans On Manufactured Number Average Value Number Average Value Number Average Value Number Average Value Number Average Value Number Average Value Number Average Value
LOANS ORIGINATED 22 $116,403 134 $115,806 305 $109,810 44 $70,105 4 $484,165 40 $95,664 2 $42,475 APPLICATIONS APPROVED, NOT ACCEPTED 2 $120,000 17 $134,879 91 $118,245 9 $84,977 1 $1,055,880 6 $112,332 0 $0 APPLICATIONS DENIED 1 $96,790 51 $90,093 197 $104,888 52 $69,436 0 $0 11 $77,234 3 $137,903 APPLICATIONS WITHDRAWN 2 $118,000 38 $104,129 213 $118,254 12 $87,292 0 $0 8 $81,364 2 $22,500 FILES CLOSED FOR INCOMPLETENESS 0 $0 2 $183,480 26 $118,458 3 $56,667 0 $0 1 $170,000 0 $0
Aggregated Statistics For Year 2003(Based on 1 full and 2 partial tracts) A) FHA, FSA/RHS & VA B) Conventional C) Refinancings D) Home Improvement Loans F) Non-occupant Loans on Number Average Value Number Average Value Number Average Value Number Average Value Number Average Value
LOANS ORIGINATED 60 $109,667 115 $101,877 312 $95,050 14 $28,469 51 $85,502 APPLICATIONS APPROVED, NOT ACCEPTED 0 $0 13 $90,465 40 $94,292 1 $57,960 6 $86,522 APPLICATIONS DENIED 1 $91,510 25 $85,112 205 $94,302 15 $28,988 7 $54,796 APPLICATIONS WITHDRAWN 2 $109,000 6 $120,025 149 $104,272 4 $30,862 7 $88,719 FILES CLOSED FOR INCOMPLETENESS 0 $0 6 $83,950 17 $96,432 1 $55,000 2 $105,165
Aggregated Statistics For Year 1999(Based on 2 partial tracts) A) FHA, FSA/RHS & VA B) Conventional C) Refinancings D) Home Improvement Loans E) Loans on Dwellings For 5+ Families F) Non-occupant Loans on Number Average Value Number Average Value Number Average Value Number Average Value Number Average Value Number Average Value
LOANS ORIGINATED 31 $91,786 20 $90,347 35 $75,318 6 $23,032 1 $90,220 4 $64,382 APPLICATIONS APPROVED, NOT ACCEPTED 1 $64,520 2 $58,880 7 $74,877 4 $17,650 0 $0 1 $83,150 APPLICATIONS DENIED 3 $119,040 10 $108,926 42 $73,016 7 $19,207 0 $0 3 $66,830 APPLICATIONS WITHDRAWN 2 $91,670 9 $138,329 30 $94,296 1 $22,770 0 $0 2 $118,215 FILES CLOSED FOR INCOMPLETENESS 0 $0 0 $0 6 $79,380 1 $19,400 0 $0 0 $0
Detailed HMDA statistics for the following Tracts:
0004.02
, 0005.01 , 0005.02
Private Mortgage Insurance Companies Aggregated Statistics For Year 2009(Based on 1 full and 2 partial tracts) A) Conventional B) Refinancings Number Average Value Number Average Value
LOANS ORIGINATED 1 $149,000 1 $145,000 APPLICATIONS APPROVED, NOT ACCEPTED 0 $0 1 $202,380 APPLICATIONS DENIED 0 $0 0 $0 APPLICATIONS WITHDRAWN 0 $0 0 $0 FILES CLOSED FOR INCOMPLETENESS 0 $0 0 $0
Aggregated Statistics For Year 2008(Based on 1 full and 2 partial tracts) A) Conventional B) Refinancings C) Non-occupant Loans on Number Average Value Number Average Value Number Average Value
LOANS ORIGINATED 5 $201,412 3 $185,797 1 $147,000 APPLICATIONS APPROVED, NOT ACCEPTED 4 $146,062 12 $230,407 0 $0 APPLICATIONS DENIED 1 $121,430 0 $0 0 $0 APPLICATIONS WITHDRAWN 0 $0 0 $0 0 $0 FILES CLOSED FOR INCOMPLETENESS 0 $0 1 $267,000 1 $267,000
Aggregated Statistics For Year 2007(Based on 1 full and 2 partial tracts) A) Conventional B) Refinancings Number Average Value Number Average Value
LOANS ORIGINATED 8 $226,125 15 $222,487 APPLICATIONS APPROVED, NOT ACCEPTED 1 $190,000 2 $239,000 APPLICATIONS DENIED 0 $0 1 $145,180 APPLICATIONS WITHDRAWN 0 $0 3 $209,787 FILES CLOSED FOR INCOMPLETENESS 0 $0 0 $0
Aggregated Statistics For Year 2006(Based on 1 full and 2 partial tracts) A) Conventional B) Refinancings C) Non-occupant Loans on Number Average Value Number Average Value Number Average Value
LOANS ORIGINATED 6 $198,288 6 $271,112 0 $0 APPLICATIONS APPROVED, NOT ACCEPTED 2 $163,230 4 $179,750 1 $150,460 APPLICATIONS DENIED 0 $0 0 $0 0 $0 APPLICATIONS WITHDRAWN 0 $0 0 $0 0 $0 FILES CLOSED FOR INCOMPLETENESS 0 $0 0 $0 0 $0
Aggregated Statistics For Year 2005(Based on 1 full and 2 partial tracts) A) Conventional B) Refinancings C) Non-occupant Loans on Number Average Value Number Average Value Number Average Value
LOANS ORIGINATED 21 $188,660 16 $157,256 3 $129,650 APPLICATIONS APPROVED, NOT ACCEPTED 1 $376,060 5 $133,086 0 $0 APPLICATIONS DENIED 0 $0 0 $0 0 $0 APPLICATIONS WITHDRAWN 2 $112,625 1 $149,000 1 $150,460 FILES CLOSED FOR INCOMPLETENESS 0 $0 0 $0 0 $0
Aggregated Statistics For Year 2004(Based on 1 full and 2 partial tracts) A) Conventional B) Refinancings C) Non-occupant Loans on Number Average Value Number Average Value Number Average Value
LOANS ORIGINATED 27 $149,276 16 $143,809 6 $113,092 APPLICATIONS APPROVED, NOT ACCEPTED 6 $124,215 6 $110,108 3 $99,137 APPLICATIONS DENIED 0 $0 0 $0 0 $0 APPLICATIONS WITHDRAWN 0 $0 1 $125,000 0 $0 FILES CLOSED FOR INCOMPLETENESS 0 $0 0 $0 0 $0
Aggregated Statistics For Year 2003(Based on 1 full and 2 partial tracts) A) Conventional B) Refinancings C) Non-occupant Loans on Number Average Value Number Average Value Number Average Value
LOANS ORIGINATED 34 $123,546 37 $119,455 9 $89,834 APPLICATIONS APPROVED, NOT ACCEPTED 7 $108,611 12 $129,823 1 $45,750 APPLICATIONS DENIED 2 $105,875 1 $118,000 1 $45,750 APPLICATIONS WITHDRAWN 0 $0 2 $117,500 0 $0 FILES CLOSED FOR INCOMPLETENESS 0 $0 0 $0 0 $0
Aggregated Statistics For Year 1999(Based on 2 partial tracts) A) Conventional B) Refinancings Number Average Value Number Average Value
LOANS ORIGINATED 6 $107,085 3 $93,980 APPLICATIONS APPROVED, NOT ACCEPTED 0 $0 1 $131,730 APPLICATIONS DENIED 1 $43,180 0 $0 APPLICATIONS WITHDRAWN 0 $0 1 $52,820 FILES CLOSED FOR INCOMPLETENESS 0 $0 0 $0
Detailed PMIC statistics for the following Tracts:
0004.02
, 0005.01 , 0005.02 Dinuba compared to California state average:
Median household income below state average. Median house value significantly below state average. Black race population percentage significantly below state average. Hispanic race population percentage significantly above state average. Median age below state average. Length of stay since moving in significantly above state average. Percentage of population with a bachelor's degree or higher below state average.
#10 on the list of "Top 101 cities with largest percentage of females in occupations: material moving occupations (population 5,000+)"
#36 on the list of "Top 101 cities with largest percentage of males in occupations: farming, fishing, and forestry occupations (population 5,000+)"
#36 on the list of "Top 101 cities with largest percentage of males in industries: agriculture, forestry, fishing and hunting (population 5,000+)"
#49 on the list of "Top 101 cities with largest percentage of females in industries: agriculture, forestry, fishing and hunting (population 5,000+)"
#56 on the list of "Top 101 cities with largest percentage of females in occupations: farming, fishing, and forestry occupations (population 5,000+)"
#6 on the list of "Top 101 counties with the highest Particulate Matter (PM2.5 ) Annual air pollution readings in 2012 (µg/m3 )"
#7 on the list of "Top 101 counties with the highest Particulate Matter (PM10 ) Annual air pollution readings in 2012 (µg/m3 )"
#10 on the list of "Top 101 counties with the highest number of births per 1000 residents 2007-2013"
#16 on the list of "Top 101 counties with the highest Ozone (1-hour) air pollution readings in 2012 (ppm)"
#25 on the list of "Top 101 counties with the lowest percentage of residents relocating to foreign countries in 2011"
Top Patent Applicants
Ken Klippenstein (1)
Michael Scott Reimer (1)
Jonathan William Hoeflinger (1)
Mark Cook (1)
Alex Jeffrey Tangonan (1)
Total of 5 patent applications in 2008-2024.
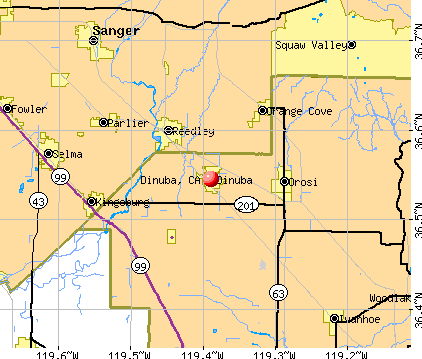


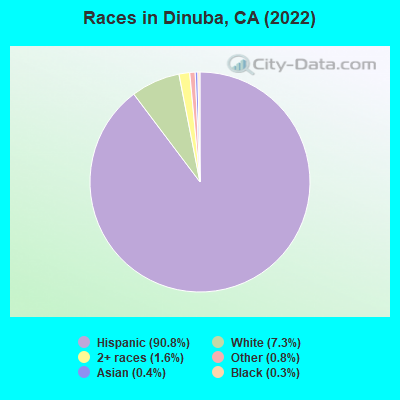
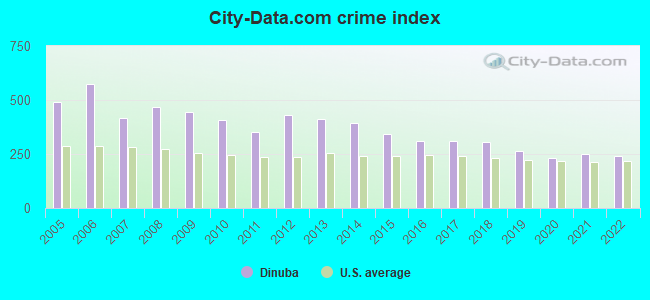
 Recent articles from our blog. Our writers, many of them Ph.D. graduates or candidates, create easy-to-read articles on a wide variety of topics.

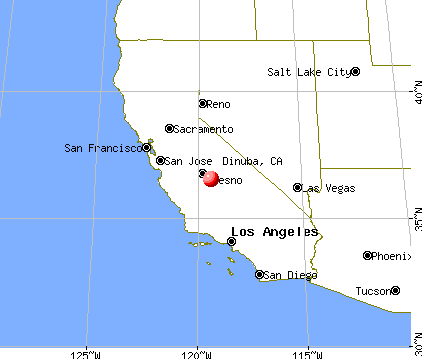
 (15.9 miles
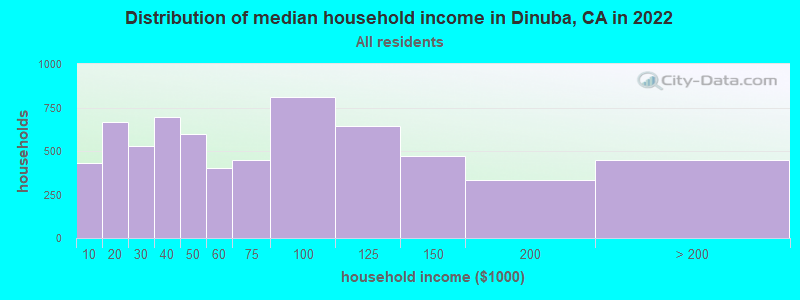
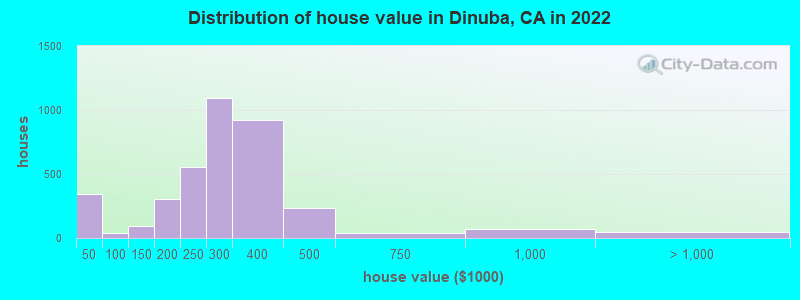
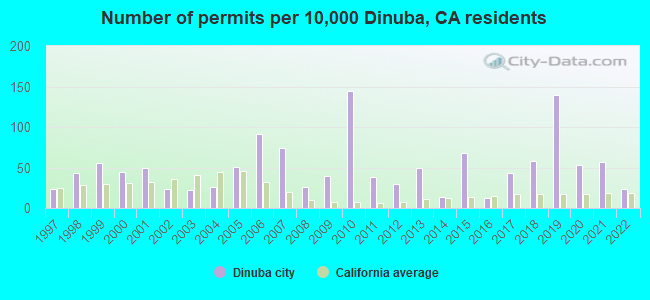
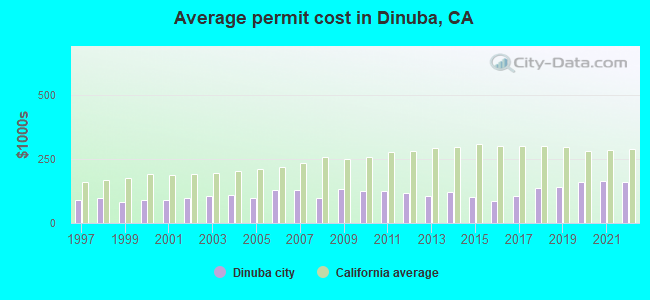
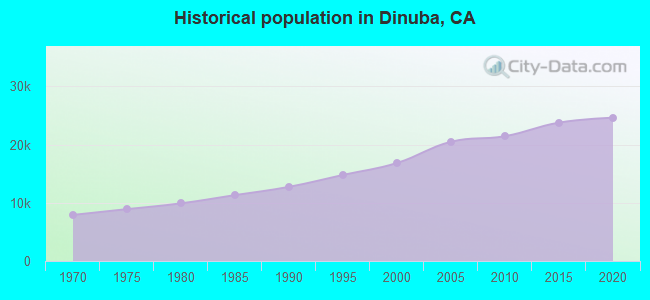
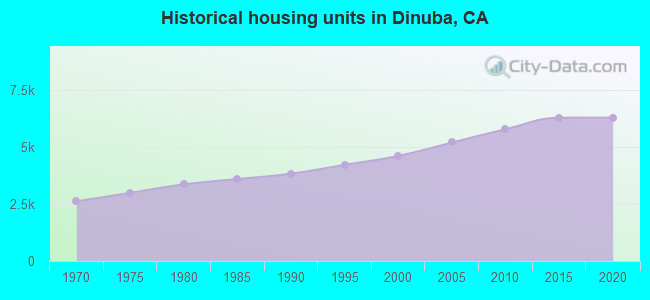
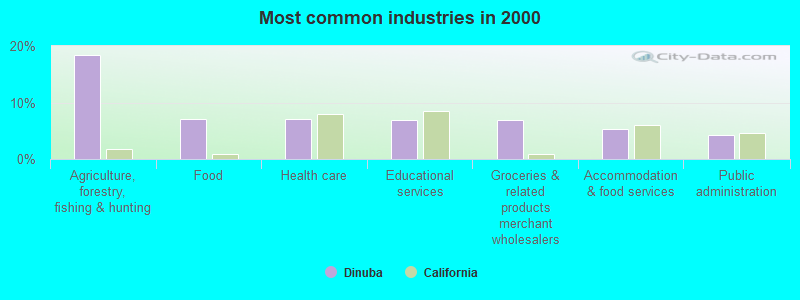
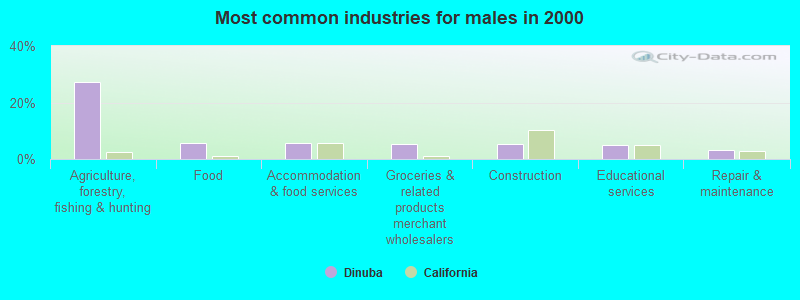
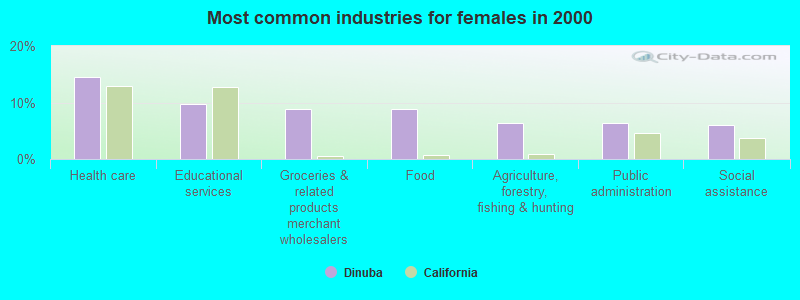
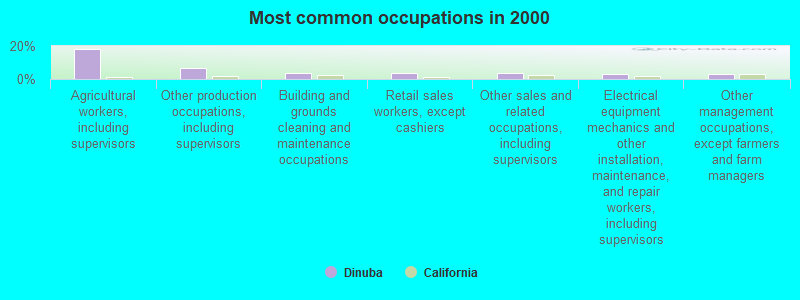
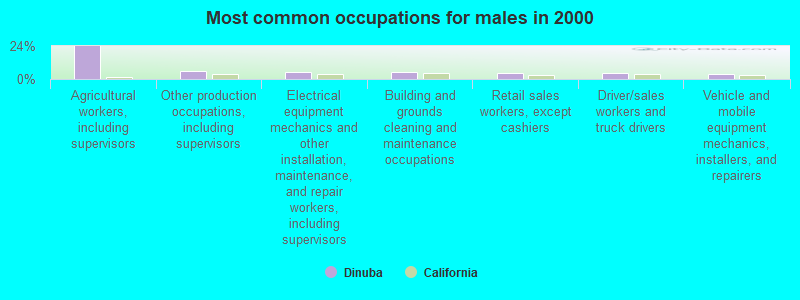
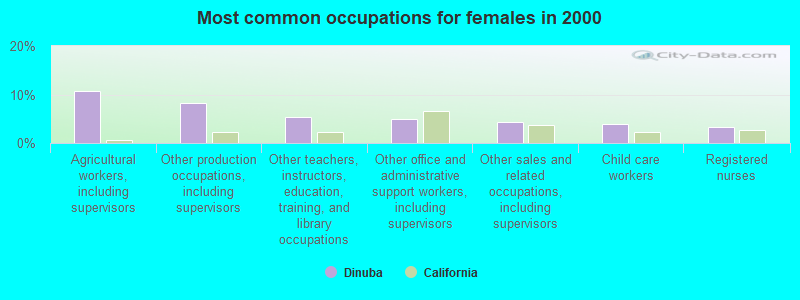
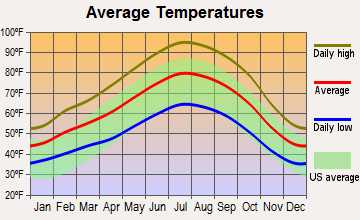
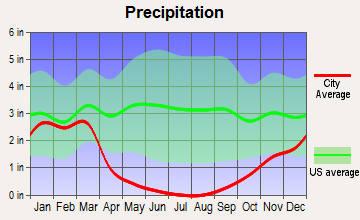
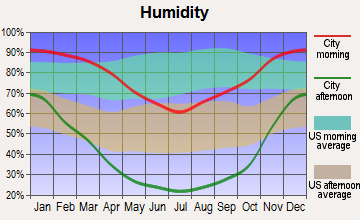
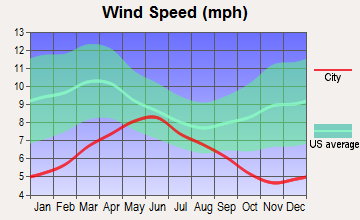
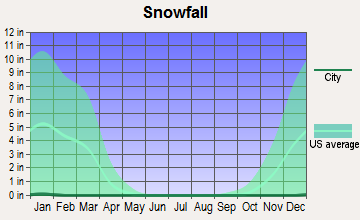
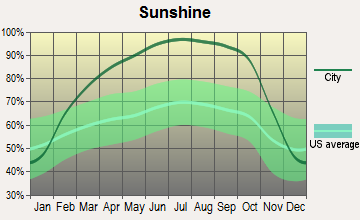
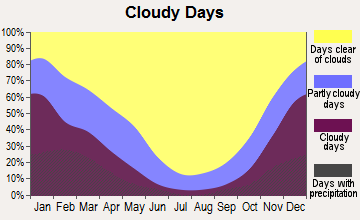
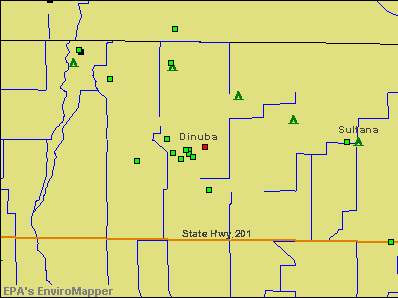

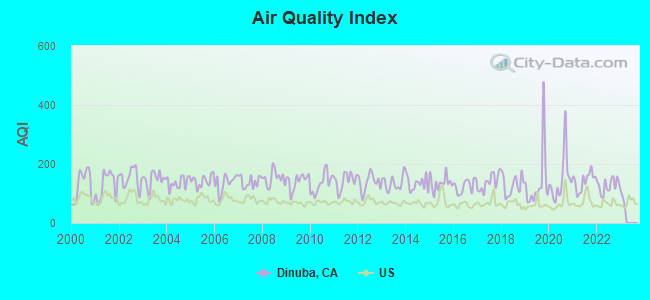
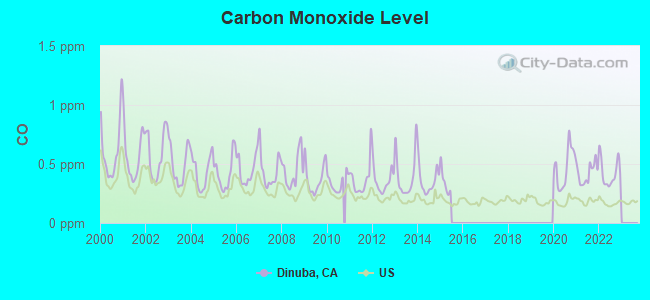
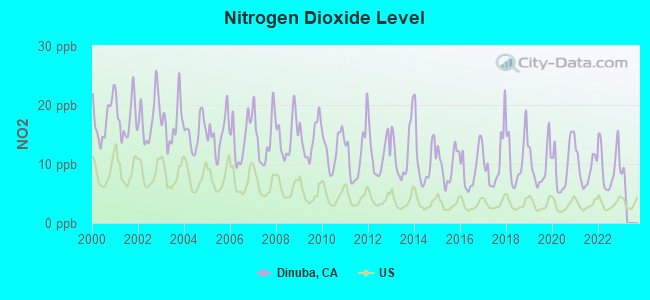
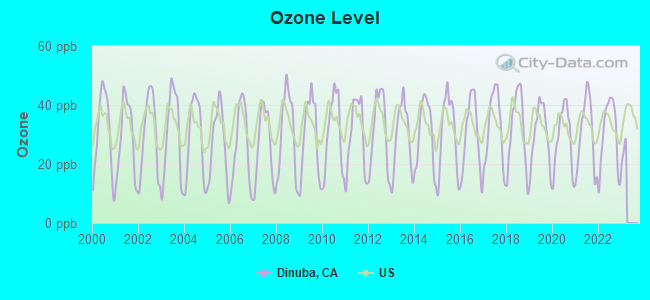
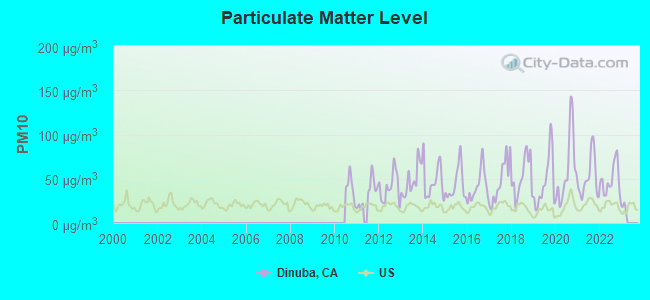
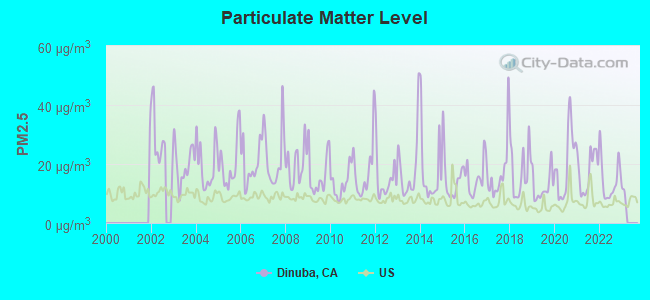
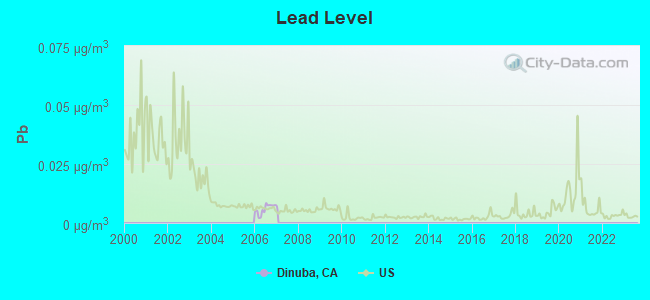

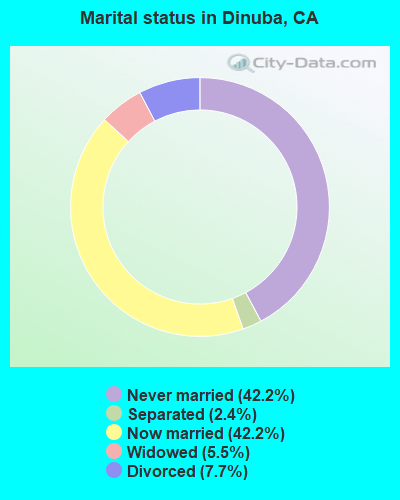
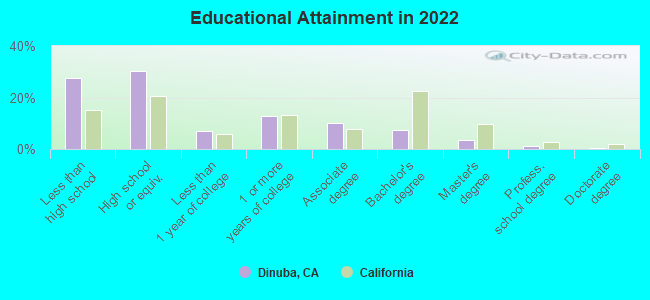

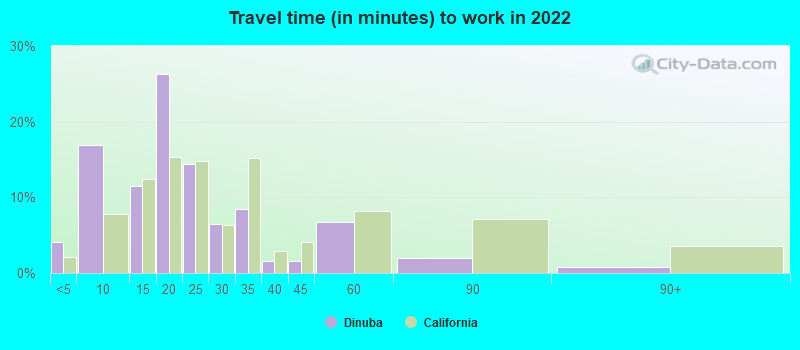
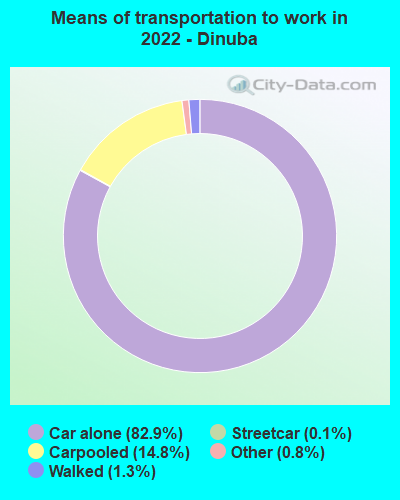
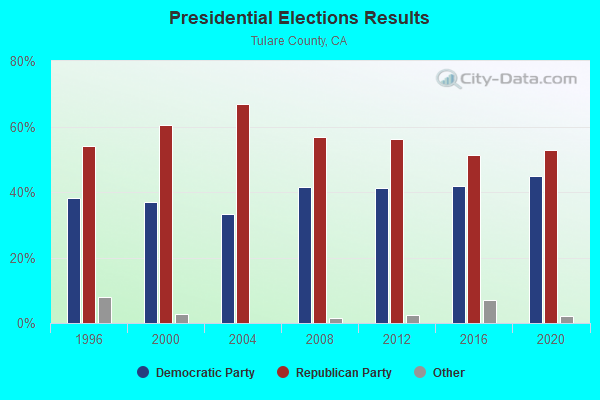
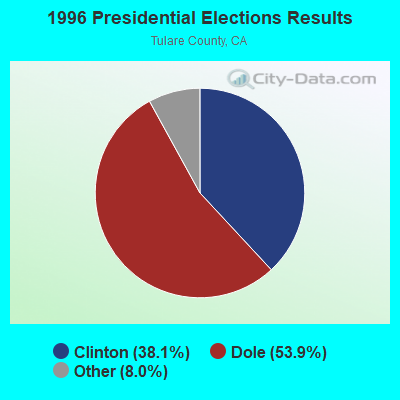
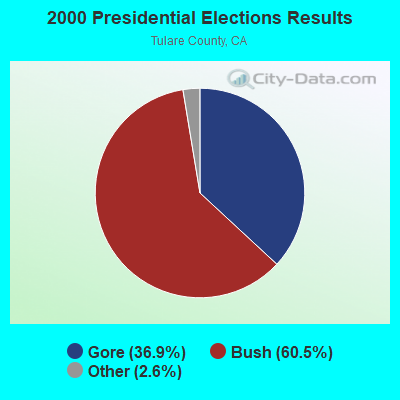
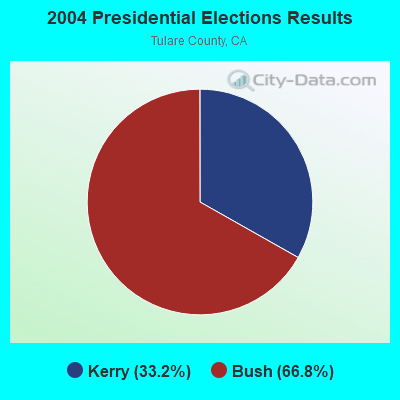
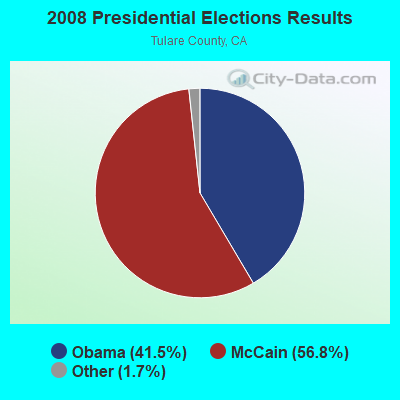
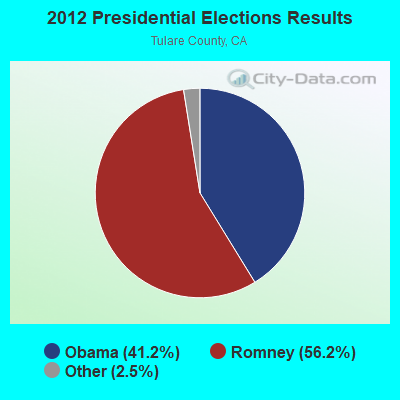
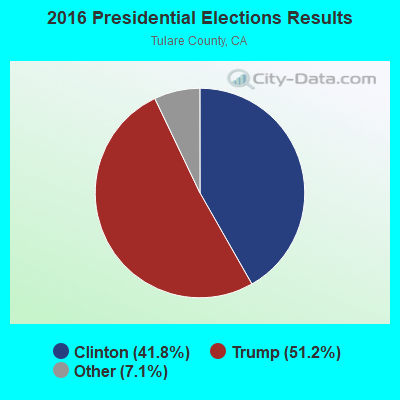
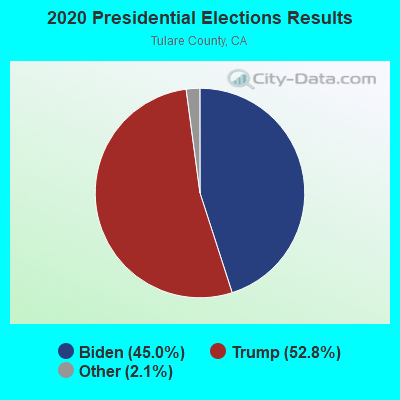
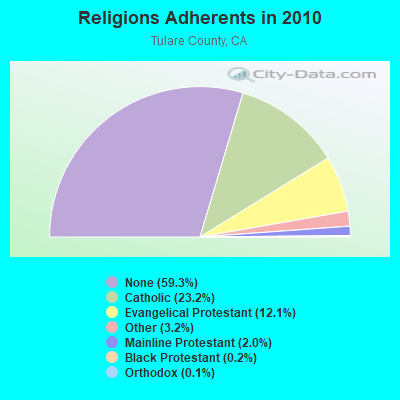
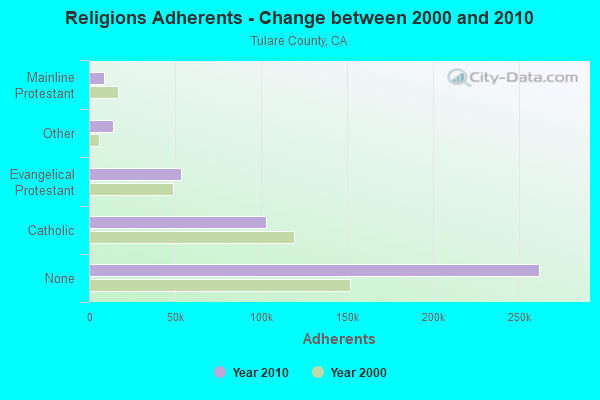
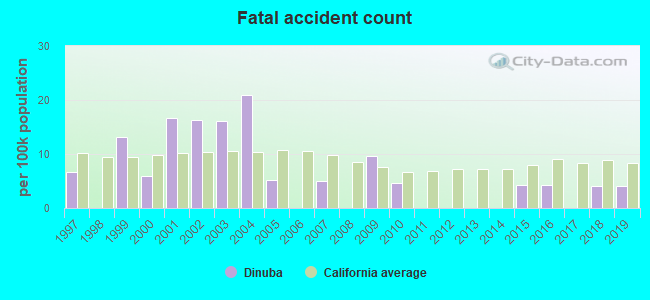
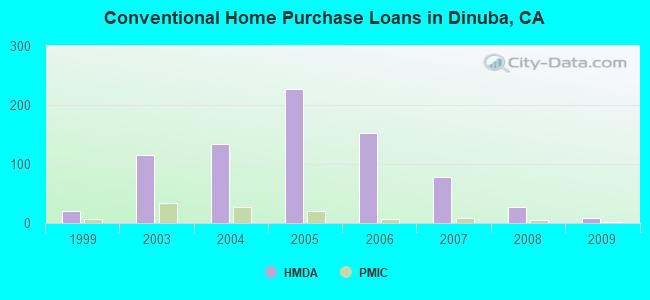
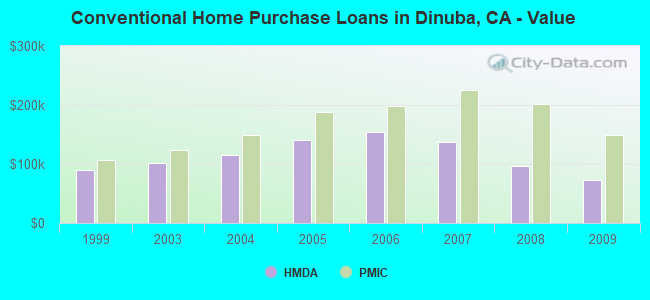
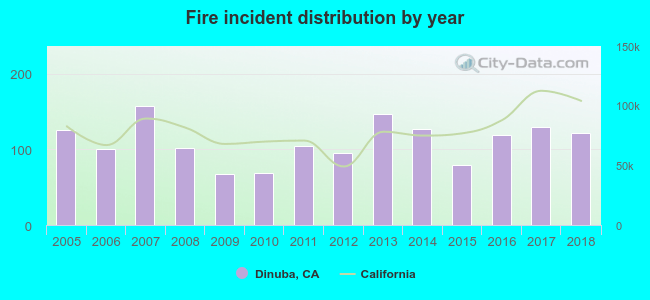 According to the data from the years 2005 - 2018 the average number of fires per year is 111. The highest number of fire incidents - 158 took place in 2007, and the least - 68 in 2009. The data has a declining trend.
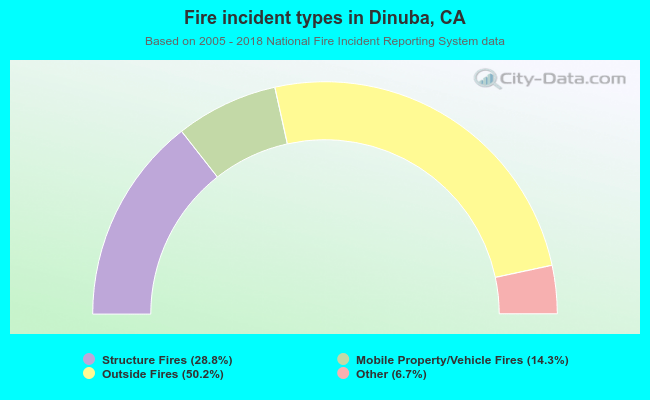 When looking into fire subcategories, the most reports belonged to: Outside Fires (50.2%), and Structure Fires (28.8%).