Dublin, OH (Ohio) Houses and Residents
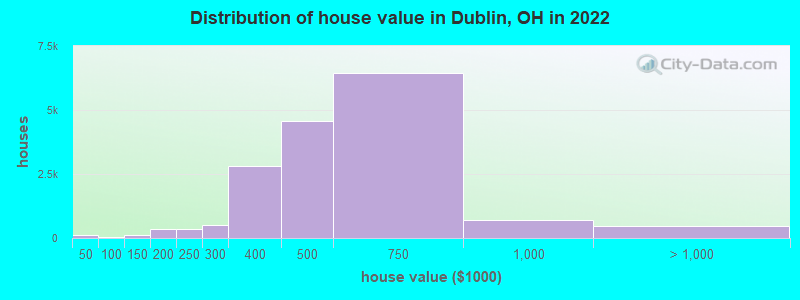
Estimated median house or condo value in 2022: $550,229 (it was $241,900 in 2000 )
Dublin:
$550,229Ohio:
$204,100
Lower value quartile - upper value quartile: $446,892 - $681,012Mean price in 2022: Detached houses: $614,082 Here:
$614,082State:
$254,366
Townhouses or other attached units: $310,605 Here:
$310,605State:
$225,733
In 3-to-4-unit structures: $368,217 Here:
$368,217State:
$203,002
In 5-or-more-unit structures: $230,030 Here:
$230,030State:
$211,593
Mobile homes: $106,028 Here:
$106,028State:
$62,719
Total population: 44,214 (Urban population: 31,091, Rural population: 387 (10 farm, 377 nonfarm ))
Houses: 18,951 (18,064 occupied: 13,793 owner occupied, 4,157 renter occupied )
% of renters here:
23%State:
33%
Housing density: 897 houses/condos per square mile
Median price asked for vacant for-sale houses and condos in 2022: $314,938.
Median contract rent in 2022: $1,440 (lower quartile is $1,132, upper quartile is $1,953)
Median rent asked for vacant for-rent units in 2022: $1,805
Median gross rent in Dublin, OH in 2022: $1,597
Housing units in Dublin with a mortgage: 9,076 (1,752 second mortgage, 67 home equity loan, 1,520 both second mortgage and home equity loan )Houses without a mortgage: 307
Median household income for houses/condos with a mortgage: $194,516
Median household income for apartments without a mortgage: $136,277
Median monthly housing costs: $2,157
Data:
Median house or condo value ($)
Median house or condo value ($ change since 2000)
Median house or condo value ($) - White
Median house or condo value ($) - Black or African American
Median house or condo value ($) - Asian
Median house or condo value ($) - Hispanic or Latino
Median house or condo value ($) - American Indian and Alaska Native
Median house or condo value ($) - Multirace
Median house or condo value ($) - Other Race
Median price asked for mobile homes ($)
Household density (households per square mile)
Mean house or condo value by units in structure - 1, detached ($)
Mean house or condo value by units in structure - 1, attached ($)
Mean house or condo value by units in structure - 2 ($)
Mean house or condo value by units in structure by units in structure - 3 or 4 ($)
Mean house or condo value by units in structure - 5 or more ($)
Mean house or condo value by units in structure - Boat, RV, van, etc. ($)
Mean house or condo value by units in structure - Mobile home ($)
Median contract rent ($)
Median contract rent - Lower quartile ($)
Median contract rent - Upper quartile ($)
Median gross rent ($)
Urban houses (%)
Rural houses (%)
Houses occupied (%)
Houses occupied (% change since 2000)
Houses owner occupied (%)
Houses owner occupied (% change since 2000)
Houses renter occupied (%)
Houses renter occupied (% change since 2000)
Vacant housing units - For rent (%)
Vacant housing units - For rent (% change since 2000)
Vacant housing units - For sale only (%)
Vacant housing units - For sale only (% change since 2000)
Vacant housing units - Rented or sold, not occupied (%)
Vacant housing units - Rented or sold, not occupied (% change since 2000)
Vacant housing units - For seasonal, recreational, or occasional use (%)
Vacant housing units - For seasonal, recreational, or occasional use (% change since 2000)
Vacant housing units - For migrant workers (%)
Vacant housing units - For migrant workers (% change since 2000)
Vacant housing units - Other vacant (%)
Vacant housing units - Other vacant (% change since 2000)
Median monthly housing costs ($)
Median household income for houses/condos with a mortgage ($)
Median household income for houses/condos without a mortgage ($)
Median household income ($)
Median household income ($) - White
Median household income ($) - Black or African American
Median household income ($) - Asian
Median household income ($) - Hispanic or Latino
Median household income ($) - American Indian and Alaska Native
Median household income ($) - Multirace
Median household income ($) - Other Race
Mortgage status - with mortgage (%)
Mortgage status - with second mortgage (%)
Mortgage status - with home equity loan (%)
Mortgage status - with both second mortgage and home equity loan (%)
Mortgage status - without a mortgage (%)
Median year house/condo built
Median year apartment built
Household type by relationship - Male householder living alone (%)
Household type by relationship - Male householder not living alone (%)
Household type by relationship - Female householder living alone (%)
Household type by relationship - Female householder not living alone (%)
Household type by relationship - Opposite-Sex spouse (%)
Household type by relationship - Same-Sex spouse (%)
Household type by relationship - Opposite-Sex unmarried partner (%)
Household type by relationship - Same-Sex unmarried partner (%)
Household type by relationship - In group quarters (%)
Size of family households - 2-person household (%)
Size of family households - 3-person household (%)
Size of family households - 4-person household (%)
Size of family households - 5-person household (%)
Size of family households - 6-person household (%)
Size of family households - 7-or-more-person household (%)
Size of nonfamily households - 1-person household (%)
Size of nonfamily households - 2-person household (%)
Size of nonfamily households - 3-person household (%)
Size of nonfamily households - 4-person household (%)
Size of nonfamily households - 5-person household (%)
Size of nonfamily households - 6-person household (%)
Size of nonfamily households - 7-or-moreperson household (%)
Year house built - Built 2010 or later (%)
Year house built - Built 2000 to 2009 (%)
Year house built - Built 1990 to 1999 (%)
Year house built - Built 1980 to 1989 (%)
Year house built - Built 1970 to 1979 (%)
Year house built - Built 1960 to 1969 (%)
Year house built - Built 1950 to 1959 (%)
Year house built - Built 1940 to 1949 (%)
Year house built - Built 1939 or earlier (%)
Median number of rooms in houses and condos
Median number of rooms in apartments
Median number of bedrooms in owner occupied houses
Mean number of bedrooms in owner occupied houses
Median number of bedrooms in renter occupied houses
Mean number of bedrooms in renter occupied houses
Median number of vehichles in owner occupied houses
Mean number of vehichles in owner occupied houses
Median number of vehichles in renter occupied houses
Mean number of vehichles in renter occupied houses
Rooms in owner-occupied houses - 1 room (%)
Rooms in owner-occupied houses - 2 rooms (%)
Rooms in owner-occupied houses - 3 rooms (%)
Rooms in owner-occupied houses - 4 rooms (%)
Rooms in owner-occupied houses - 5 rooms (%)
Rooms in owner-occupied houses - 6 rooms (%)
Rooms in owner-occupied houses - 7 rooms (%)
Rooms in owner-occupied houses - 8 rooms (%)
Rooms in owner-occupied houses - 9+ rooms (%)
Rooms in renter-occupied houses - 1 room (%)
Rooms in renter-occupied houses - 2 rooms (%)
Rooms in renter-occupied houses - 3 rooms (%)
Rooms in renter-occupied houses - 4 rooms (%)
Rooms in renter-occupied houses - 5 rooms (%)
Rooms in renter-occupied houses - 6 rooms (%)
Rooms in renter-occupied houses - 7 rooms (%)
Rooms in renter-occupied houses - 8 rooms (%)
Rooms in renter-occupied houses - 9+ rooms (%)
Bedrooms in owner-occupied houses - no bedrooms (%)
Bedrooms in owner-occupied houses - 1 bedroom (%)
Bedrooms in owner-occupied houses - 2 bedrooms (%)
Bedrooms in owner-occupied houses - 3 bedrooms (%)
Bedrooms in owner-occupied houses - 4 bedrooms (%)
Bedrooms in owner-occupied houses - 5+ bedrooms (%)
Bedrooms in renter-occupied houses - no bedrooms (%)
Bedrooms in renter-occupied houses - 1 bedroom (%)
Bedrooms in renter-occupied houses - 2 bedrooms (%)
Bedrooms in renter-occupied houses - 3 bedrooms (%)
Bedrooms in renter-occupied houses - 4 bedrooms (%)
Bedrooms in renter-occupied houses - 5+ bedrooms (%)
Vehicles available in owner-occupied houses - no vehicle available (%)
Vehicles available in owner-occupied houses - 1 vehicle available(%)
Vehicles available in owner-occupied houses - 2 Vehicles available (%)
Vehicles available in owner-occupied houses - 3 Vehicles available (%)
Vehicles available in owner-occupied houses - 4 Vehicles available (%)
Vehicles available in owner-occupied houses - 5+ Vehicles available (%)
Vehicles available in renter-occupied houses - no vehicle available (%)
Vehicles available in renter-occupied houses - 1 vehicle available (%)
Vehicles available in renter-occupied houses - 2 Vehicles available (%)
Vehicles available in renter-occupied houses - 3 Vehicles available (%)
Vehicles available in renter-occupied houses - 4 Vehicles available (%)
Vehicles available in renter-occupied houses - 5+ Vehicles available (%)
Housing units in structures - 1, detached (%)
Housing units in structures - 1, attached (%)
Housing units in structures - 2 (%)
Housing units in structures - 3 or 4 (%)
Housing units in structures - 5 to 9 (%)
Housing units in structures - 10 to 19 (%)
Housing units in structures - 20 to 49 (%)
Housing units in structures - 50 or more (%)
Housing units in structures - Mobile home (%)
Housing units in structures - Boat, RV, van, etc. (%)
Housing units in structures - Owners - 1, detached (%)
Housing units in structures - Owners - 1, attached (%)
Housing units in structures - Owners - 2 (%)
Housing units in structures - Owners - 3 or 4 (%)
Housing units in structures - Owners - 5 to 9 (%)
Housing units in structures - Owners - 10 to 19 (%)
Housing units in structures - Owners - 20 to 49 (%)
Housing units in structures - Owners - 50 or more (%)
Housing units in structures - Owners - Mobile home (%)
Housing units in structures - Owners - Boat, RV, van, etc. (%)
Housing units in structures - Renters - 1, detached (%)
Housing units in structures - Renters - 1, attached (%)
Housing units in structures - Renters - 2 (%)
Housing units in structures - Renters - 3 or 4 (%)
Housing units in structures - Renters - 5 to 9 (%)
Housing units in structures - Renters - 10 to 19 (%)
Housing units in structures - Renters - 20 to 49 (%)
Housing units in structures - Renters - 50 or more (%)
Housing units in structures - Renters - Mobile home (%)
Housing units in structures - Renters - Boat, RV, van, etc. (%)
House/condo owner moved in on average (years ago)
Renter moved in on average (years ago)
Year householder moved into unit - Moved in 1999 to March 2000 (%)
Year householder moved into unit - Moved in 1999 to March 2000 (%) - White
Year householder moved into unit - Moved in 1999 to March 2000 (%) - Black or African American
Year householder moved into unit - Moved in 1999 to March 2000 (%) - Asian
Year householder moved into unit - Moved in 1999 to March 2000 (%) - Hispanic or Latino
Year householder moved into unit - Moved in 1999 to March 2000 (%) - American Indian and Alaska Native
Year householder moved into unit - Moved in 1999 to March 2000 (%) - Multirace
Year householder moved into unit - Moved in 1999 to March 2000 (%) - Other Race
Year householder moved into unit - Moved in 1995 to 1998 (%)
Year householder moved into unit - Moved in 1995 to 1998 (%) - White
Year householder moved into unit - Moved in 1995 to 1998 (%) - Black or African American
Year householder moved into unit - Moved in 1995 to 1998 (%) - Asian
Year householder moved into unit - Moved in 1995 to 1998 (%) - Hispanic or Latino
Year householder moved into unit - Moved in 1995 to 1998 (%) - American Indian and Alaska Native
Year householder moved into unit - Moved in 1995 to 1998 (%) - Multirace
Year householder moved into unit - Moved in 1995 to 1998 (%) - Other Race
Year householder moved into unit - Moved in 1990 to 1994 (%)
Year householder moved into unit - Moved in 1990 to 1994 (%) - White
Year householder moved into unit - Moved in 1990 to 1994 (%) - Black or African American
Year householder moved into unit - Moved in 1990 to 1994 (%) - Asian
Year householder moved into unit - Moved in 1990 to 1994 (%) - Hispanic or Latino
Year householder moved into unit - Moved in 1990 to 1994 (%) - American Indian and Alaska Native
Year householder moved into unit - Moved in 1990 to 1994 (%) - Multirace
Year householder moved into unit - Moved in 1990 to 1994 (%) - Other Race
Year householder moved into unit - Moved in 1980 to 1989 (%)
Year householder moved into unit - Moved in 1980 to 1989 (%) - White
Year householder moved into unit - Moved in 1980 to 1989 (%) - Black or African American
Year householder moved into unit - Moved in 1980 to 1989 (%) - Asian
Year householder moved into unit - Moved in 1980 to 1989 (%) - Hispanic or Latino
Year householder moved into unit - Moved in 1980 to 1989 (%) - American Indian and Alaska Native
Year householder moved into unit - Moved in 1980 to 1989 (%) - Multirace
Year householder moved into unit - Moved in 1980 to 1989 (%) - Other Race
Year householder moved into unit - Moved in 1970 to 1979 (%)
Year householder moved into unit - Moved in 1970 to 1979 (%) - White
Year householder moved into unit - Moved in 1970 to 1979 (%) - Black or African American
Year householder moved into unit - Moved in 1970 to 1979 (%) - Asian
Year householder moved into unit - Moved in 1970 to 1979 (%) - Hispanic or Latino
Year householder moved into unit - Moved in 1970 to 1979 (%) - American Indian and Alaska Native
Year householder moved into unit - Moved in 1970 to 1979 (%) - Multirace
Year householder moved into unit - Moved in 1970 to 1979 (%) - Other Race
Year householder moved into unit - Moved in 1969 or earlier (%)
Year householder moved into unit - Moved in 1969 or earlier (%) - White
Year householder moved into unit - Moved in 1969 or earlier (%) - Black or African American
Year householder moved into unit - Moved in 1969 or earlier (%) - Asian
Year householder moved into unit - Moved in 1969 or earlier (%) - Hispanic or Latino
Year householder moved into unit - Moved in 1969 or earlier (%) - American Indian and Alaska Native
Year householder moved into unit - Moved in 1969 or earlier (%) - Multirace
Year householder moved into unit - Moved in 1969 or earlier (%) - Other Race
Housing units lacking complete plumbing facilities (%)
Housing units lacking complete kitchen facilities (%)
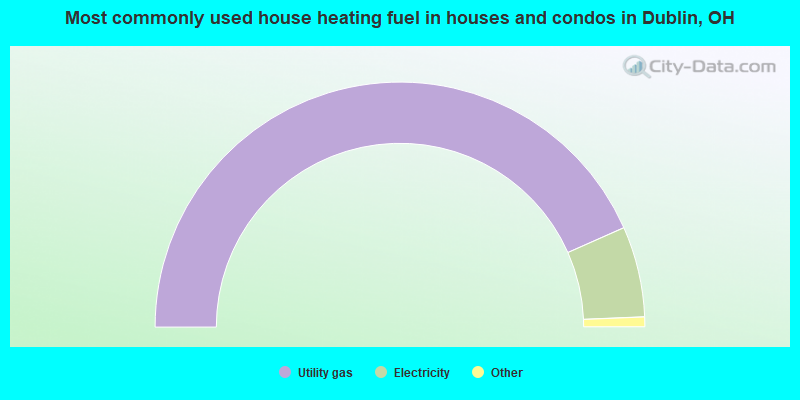
House heating fuel used in houses and condos - Utility gas (%)
House heating fuel used in houses and condos - Bottled, tank, or LP gas (%)
House heating fuel used in houses and condos - Electricity (%)
House heating fuel used in houses and condos - Fuel oil, kerosene, etc. (%)
House heating fuel used in houses and condos - Coal or coke (%)
House heating fuel used in houses and condos - Wood (%)
House heating fuel used in houses and condos - Solar energy (%)
House heating fuel used in houses and condos - Other fuel (%)
House heating fuel used in houses and condos - No fuel used (%)
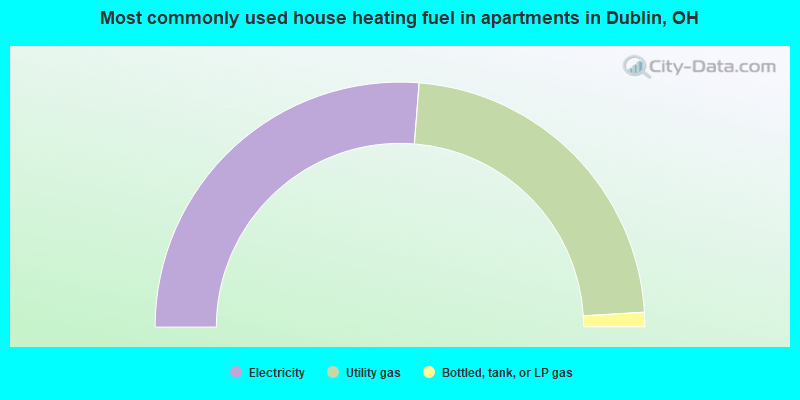
House heating fuel used in apartments - Utility gas (%)
House heating fuel used in apartments - Bottled, tank, or LP gas (%)
House heating fuel used in apartments - Electricity (%)
House heating fuel used in apartments - Fuel oil, kerosene, etc. (%)
House heating fuel used in apartments - Coal or coke (%)
House heating fuel used in apartments - Wood (%)
House heating fuel used in apartments - Solar energy (%)
House heating fuel used in apartments - Other fuel (%)
House heating fuel used in apartments - No fuel used (%)
Latest news about housing in Dublin, OH collected exclusively by city-data.com from local newspapers, TV, and radio stations
Median year house/condo built: 1995Median year apartment built: 1997Household type by relationship:
Households: 49,029
Male householders: 10,784 (1,707 living alone ), Female householders: 6,961 (1,702 living alone )12,592 spouses (12,534 opposite-sex spouses ), 333 unmarried partners , (333 opposite-sex unmarried partners ), 16,648 children (16,178 natural , 351 adopted , 117 stepchildren ), 200 grandchildren , 33 brothers or sisters , 731 parents , 0 foster children , 220 other relatives , 228 non-relatives In group quarters: 293
Size of family households: 5,312 2-persons , 3,501 3-persons , 3,219 4-persons , 1,287 5-persons , 361 6-persons , 35 7-or-more-persons .
Size of nonfamily households: 3,559 1-person , 312 2-persons , 14 4-persons .
11,811 married couples with children. single-parent households (788 men , 714 women ).
76.6% of residents of Dublin speak English at home. of residents speak Spanish at home (72% speak English very well , 18% speak English well , 11% speak English not well ).of residents speak other Indo-European language at home (77% speak English very well , 20% speak English well , 3% speak English not well ).of residents speak Asian or Pacific Island language at home (64% speak English very well , 16% speak English well , 12% speak English not well , 7% don't speak English at all ).of residents speak other language at home (74% speak English very well , 19% speak English well , 7% speak English not well ).
Foreign born population: 10,266 (20.9%)of them are naturalized citizens )
Median number of rooms in houses and condos:
Median number of rooms in apartments
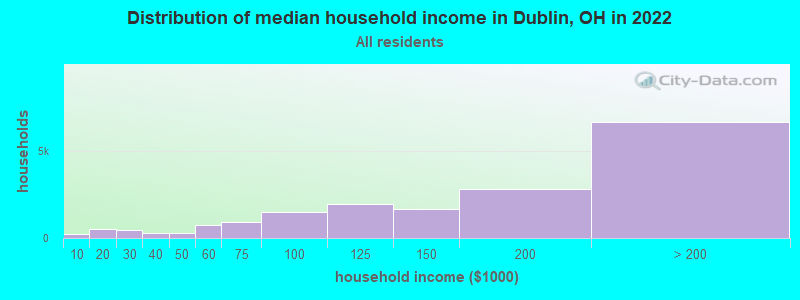
Dublin, OH household income distribution 251 Less than $10,000510 $10,000 to $19,999438 $20,000 to $29,999273 $30,000 to $39,999298 $40,000 to $49,999725 $50,000 to $59,999892 $60,000 to $74,9991,476 $75,000 to $99,9991,955 $100,000 to $124,9991,678 $125,000 to $149,9992,793 $150,000 to $199,9996,630 $200,000 or more
Home value of owner - occupied houses in 2022 in Dublin, OH 28 Less than $10,00039 $10,000 to $14,99937 $25,000 to $29,9996 $30,000 to $34,9993 $40,000 to $49,9997 $50,000 to $59,99927 $60,000 to $69,99964 $100,000 to $124,99951 $125,000 to $149,999161 $150,000 to $174,999180 $175,000 to $199,999364 $200,000 to $249,999518 $250,000 to $299,9992,819 $300,000 to $399,9994,576 $400,000 to $499,9996,451 $500,000 to $749,999711 $750,000 to $999,999385 $1,000,000 to $1,499,99937 $1,500,000 to $1,999,99927 $2,000,000 or moreRent paid by renters in 2022 in Dublin, OH 156 $200 to $24930 $250 to $29921 $300 to $34920 $350 to $39912 $500 to $54913 $550 to $59939 $600 to $64920 $650 to $69923 $750 to $79971 $800 to $899199 $900 to $9991,019 $1,000 to $1,249771 $1,250 to $1,4991,168 $1,500 to $1,999298 $2,000 to $2,499300 $2,500 to $2,999105 $3,000 to $3,499242 No cash rent
Percentage of workers working in this county: 77.0%Number of people working at home: 7,835 (31.4% of all workers )
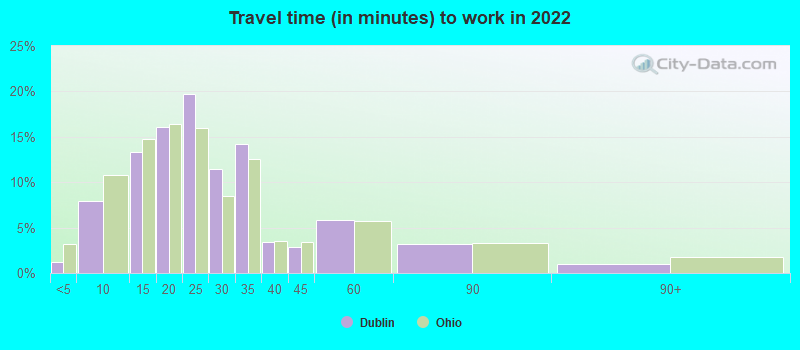
Travel time to work (commute)
Less than 5 minutes: 3575 to 9 minutes: 1,73110 to 14 minutes: 2,44915 to 19 minutes: 1,96120 to 24 minutes: 3,01825 to 29 minutes: 2,50830 to 34 minutes: 2,94235 to 39 minutes: 72340 to 44 minutes: 65545 to 59 minutes: 91260 to 89 minutes: 29890 or more minutes: 182
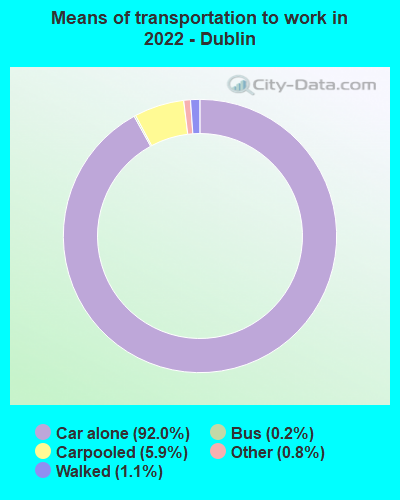
Means of transportation to work:
Drove a car alone: 31,838 (74.2%)Carpooled: 2,395 (5.6%)Bus : 81 (0.2%)Taxi: 342 (0.8%)Bicycle: 32 (0.1%)Walked: 327 (0.8%)Worked at home: 7,835 (18.3%)
Unemployment by race in 2022
Unemployment rate for White non-Hispanic residents 1.9% Males2.6% FemalesUnemployment rate for American Indian and Alaska Native residents 42.0% MalesUnemployment rate for Asian residents 2.0% Males0.2% FemalesUnemployment rate for two or more race residents 22.0% MalesUnemployment rate for Hispanic or Latino residents 7.2% Males
Year of entry for the foreign-born population in Dublin, Ohio
5,419 2010 or later 1,781 2000 to 2009 1,437 1990 to 1999 593 1980 to 1989 337 1970 to 1979 370 Before 1970
First ancestries reported:
German: 3,396 (13.5%)
English: 1,832 (7.3%)
Irish: 1,728 (6.9%)
American: 1,331 (5.3%)
Italian: 1,044 (4.2%)
European: 881 (3.5%)
Egyptian: 798 (3.2%)
Polish: 406 (1.6%)
Russian: 313 (1.2%)
Scottish: 303 (1.2%)
Swiss: 223 (0.9%)
Lebanese: 208 (0.8%)
Syrian: 191 (0.8%)
Jordanian: 187 (0.7%)
Hungarian: 176 (0.7%)
Nigerian: 173 (0.7%)
French: 140 (0.6%)
Turkish: 132 (0.5%)
Scotch-Irish: 130 (0.5%)
Greek: 121 (0.5%)
Welsh: 111 (0.4%)
French Canadian: 99 (0.4%)
British: 94 (0.4%)
Dutch: 87 (0.3%)
Scandinavian: 81 (0.3%)
Norwegian: 79 (0.3%)
Iranian: 69 (0.3%)
Northern European: 64 (0.3%)
Slovak: 61 (0.2%)
Sierra Leonean: 61 (0.2%)
Swedish: 57 (0.2%)
Ghanaian: 46 (0.2%)
Brazilian: 43 (0.2%)
Palestinian: 34 (0.1%)
Slovene: 33 (0.1%)
Ukrainian: 33 (0.1%)
Belgian: 29 (0.1%)
Croatian: 28 (0.1%)
Trinidadian and Tobagonian: 27 (0.1%)
Latvian: 26 (0.1%)
Eastern European: 23 (0.09%)
Slavic: 23 (0.09%)
Portuguese: 22 (0.09%)
Czechoslovakian: 21 (0.08%)
Romanian: 21 (0.08%)
Macedonian: 19 (0.08%)
Canadian: 18 (0.07%)
Danish: 16 (0.06%)
Finnish: 16 (0.06%)
Arab: 14 (0.06%)
Serbian: 10 (0.04%)
Czech: 10 (0.04%)
Jamaican: 9 (0.04%)
Most common places of birth for foreign-born residents (%): India Dublin:
34.3% (3,435)Ohio:
11.6% (66,525)
China, excluding Hong Kong and Taiwan Dublin:
10.0% (1,001)Ohio:
6.2% (35,703)
Egypt Dublin:
6.5% (648)Ohio:
0.8% (4,651)
Korea Dublin:
5.6% (559)Ohio:
2.0% (11,398)
Japan Dublin:
4.6% (459)Ohio:
1.4% (8,101)
Pakistan Dublin:
4.3% (436)Ohio:
1.0% (5,444)
Canada Dublin:
3.4% (345)Ohio:
2.6% (14,988)
Mexico Dublin:
3.4% (340)Ohio:
7.8% (44,796)
Russia Dublin:
2.3% (233)Ohio:
1.5% (8,452)
Nepal Dublin:
2.0% (196)Ohio:
1.9% (10,777)
Taiwan Dublin:
1.8% (177)Ohio:
0.7% (3,722)
Place of birth for U.S.-born residents:
This state: 26,412Other state: 12,059Northeast: 3,593Midwest: 4,320South: 3,002West: 1,275 91.1% of Dublin residents lived in the same house 1 years ago.
Out of people who lived in different houses, 32.4% lived in this county.
Out of people who lived in different counties, 53.5% lived in Ohio.
Dublin:
91.1%State average:
87.8%
Education attainment for males 25 years and older:
No schooling: 37Nursery to 4th grade: 105th and 6th grade: 1157th and 8th grade: 09th grade: 710th grade: 1011th grade: 3312th grade, no diploma: 116High school graduate (or equivalency): 924Less than 1 year of college: 432Some college more than 1 year, no degree: 1,134Associate degree: 502Bachelor's degree: 6,443Master's degree: 3,886Professional school degree: 1,658Doctorate degree: 1,047
Education attainment for females 25 years and older:
No schooling: 78Nursery to 4th grade: 05th and 6th grade: 147th and 8th grade: 889th grade: 3810th grade: 2711th grade: 15712th grade, no diploma: 175High school graduate (or equivalency): 1,729Less than 1 year of college: 936Some college more than 1 year, no degree: 1,088Associate degree: 567Bachelor's degree: 6,523Master's degree: 3,854Professional school degree: 902Doctorate degree: 619
Housing units in structures:
One, detached: 12,766One, attached: 2,626Two: 3793 or 4: 6145 to 9: 73410 to 19: 54620 to 49: 55850 or more: 677Mobile homes: 46Housing units lacking complete plumbing facilities in 2022: 0.3%Housing units lacking complete kitchen facilities in 2022: 0.5%House/condo owner moved in on average 10 years ago
Renter moved in on average 3 years ago
Private vs. public school enrollment:
Students in private schools in grades 1 to 8 (elementary and middle school): 781 Students in private schools in grades 9 to 12 (high school): 168 Students in private undergraduate colleges: 260