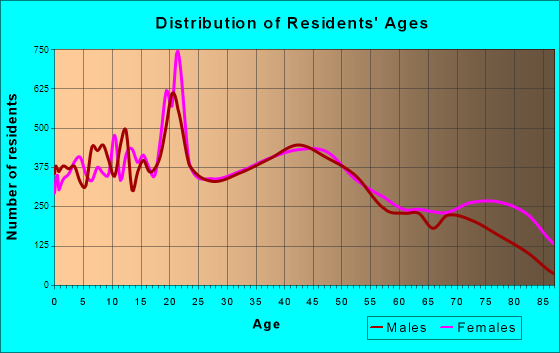
Dubuque, IA (Iowa) Houses and Residents
| Dubuque: | $190,273 |
| Iowa: | $194,600 |
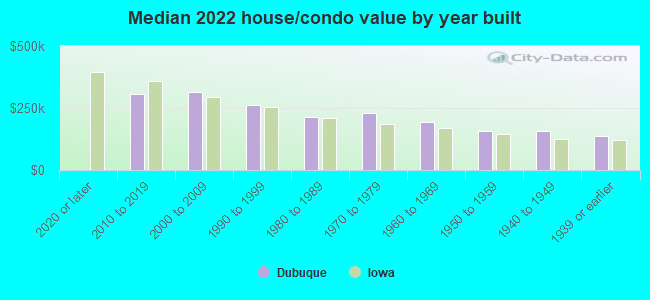
Mean price in 2022:
Detached houses: $251,221
Here: $251,221 State: $245,224 Townhouses or other attached units: $226,489
Here: $226,489 State: $238,767 In 2-unit structures: $276,334
Here: $276,334 State: $243,070 In 3-to-4-unit structures: $195,796
Here: $195,796 State: $162,139 In 5-or-more-unit structures: $204,973
Here: $204,973 State: $190,519 Mobile homes: $22,797
Here: $22,797 State: $51,271
Total population: 58,436 (Urban population: 57,156, Rural population: 312 (all nonfarm))
Houses: 27,758 (25,648 occupied: 16,589 owner occupied, 9,023 renter occupied)
| % of renters here: | 35% |
| State: | 28% |
Housing density: 1,048 houses/condos per square mile
Median price asked for vacant for-sale houses and condos in 2022: $594,872.
Median contract rent in 2022: $765 (lower quartile is $638, upper quartile is $925)
Median rent asked for vacant for-rent units in 2022: $792
Median gross rent in Dubuque, IA in 2022: $917
Housing units in Dubuque with a mortgage: 9,321 (1,325 second mortgage, 9 home equity loan, 1,122 both second mortgage and home equity loan)
Houses without a mortgage: 251
Median household income for houses/condos with a mortgage: $92,793
Median household income for apartments without a mortgage: $71,725
Median monthly housing costs: $935
Compare current foreclosures in Dubuque, IA:
| Photo | Address | Area | Beds / Baths | Price | Details |
|---|---|---|---|---|---|

|
#1
N Main St
Dubuque, IA 52001
|
1,488 sq. feet
|
1 baths 3 beds |
$154,900
|
show details |

|
#2
Kaufmann Ave
Dubuque, IA 52001
|
2,362 sq. feet
|
2 baths 4 beds |
$179,900
|
show details |

|
#3
Adair St
Dubuque, IA 52001
|
1,026 sq. feet
|
1 baths 2 beds |
$149,500
|
show details |

|
#4
Central Ave
Dubuque, IA 52001
|
1,088 sq. feet
|
1 baths 3 beds |
$6,500
|
show details |

|
#5
Lawndale St
Dubuque, IA 52001
|
1,348 sq. feet
|
1 baths 3 beds |
show details | |

|
#6
Grove Ter
Dubuque, IA 52001
|
5,568 sq. feet
|
6 baths 6 beds |
show details | |

|
#7
Bellevue Hts
Dubuque, IA 52003
|
1,285 sq. feet
|
1 baths 4 beds |
show details | |

|
#8
Jackson St
Dubuque, IA 52001
|
1,503 sq. feet
|
1 baths 3 beds |
show details | |

|
#9
Queen St
Dubuque, IA 52001
|
1,792 sq. feet
|
1 baths 4 beds |
show details | |

|
#10
Julien Dubuque Dr
Dubuque, IA 52003
|
1,396 sq. feet
|
2 baths 3 beds |
show details |
| Photo | Address | Area | Beds / Baths | Price | Details |
|---|---|---|---|---|---|

|
#11
Loras Blvd
Dubuque, IA 52001
|
980 sq. feet
|
1 baths 3 beds |
show details | |

|
#12
Devon Dr
Dubuque, IA 52001
|
1,230 sq. feet
|
2 baths 2 beds |
show details | |

|
#13
English Mill Rd
Dubuque, IA 52003
|
1,352 sq. feet
|
1 baths 3 beds |
show details | |

|
#14
Kings Row
Dubuque, IA 52001
|
1,256 sq. feet
|
2 baths 2 beds |
show details | |

|
#15
Carter Rd
Dubuque, IA 52001
|
912 sq. feet
|
1 baths 5 beds |
show details | |

|
#16
Garfield Ave
Dubuque, IA 52001
|
2,340 sq. feet
|
2 baths 3 beds |
show details | |

|
#17
Van Buren Ave
Dubuque, IA 52001
|
960 sq. feet
|
2 baths 3 beds |
show details | |

|
#18
Springreen Dr
Dubuque, IA 52002
|
1,807 sq. feet
|
3 baths 3 beds |
show details | |

|
#19
Barrington Dr
Dubuque, IA 52003
|
2,756 sq. feet
|
3 baths 4 beds |
show details | |

|
#20
Catherine St
Dubuque, IA 52001
|
840 sq. feet
|
1 baths 3 beds |
show details |
| Photo | Address | Area | Beds / Baths | Price | Details |
|---|---|---|---|---|---|

|
#21
Shiras Ave
Dubuque, IA 52001
|
1,582 sq. feet
|
2 baths 3 beds |
show details | |

|
#22
Cascade Dr
Dubuque, IA 52003
|
1,340 sq. feet
|
1 baths 2 beds |
show details | |

|
#23
University Ave
Dubuque, IA 52001
|
2,206 sq. feet
|
2 baths 4 beds |
show details | |

|
#24
N Grandview Ave
Dubuque, IA 52001
|
1,940 sq. feet
|
2 baths 3 beds |
show details | |

|
#25
Jackson St
Dubuque, IA 52001
|
628 sq. feet
|
1 baths 2 beds |
show details | |

|
#26
Scenic View Dr
Dubuque, IA 52001
|
1,014 sq. feet
|
1 baths 3 beds |
show details | |

|
#27
Alpine St
Dubuque, IA 52001
|
1,976 sq. feet
|
1 baths 4 beds |
show details | |

|
#28
Lore Mound Rd
Dubuque, IA 52002
|
2,913 sq. feet
|
2 baths 4 beds |
show details | |

|
#29
Cortez Dr
Dubuque, IA 52001
|
1,888 sq. feet
|
2 baths 4 beds |
show details | |

|
#30
Summer Dr
Dubuque, IA 52002
|
1,932 sq. feet
|
1 baths 3 beds |
show details |
| Photo | Address | Area | Beds / Baths | Price | Details |
|---|---|---|---|---|---|

|
#31
Madera St
Dubuque, IA 52001
|
1,642 sq. feet
|
2 baths 3 beds |
show details | |

|
#32
Maquoketa Dr
Dubuque, IA 52003
|
1,676 sq. feet
|
2 baths 3 beds |
show details | |

|
#33
Greenwood Ct
Dubuque, IA 52001
|
1,360 sq. feet
|
1 baths 3 beds |
show details | |

|
#34
Robin Hood Dr
Dubuque, IA 52001
|
2,171 sq. feet
|
2 baths 3 beds |
show details | |

|
#35
Fremont Ave
Dubuque, IA 52003
|
1,109 sq. feet
|
1 baths 2 beds |
show details | |

|
#36
Southern Ave
Dubuque, IA 52003
|
1,408 sq. feet
|
2 baths 3 beds |
show details | |

|
#37
Burden Ave
Dubuque, IA 52001
|
925 sq. feet
|
1 baths 2 beds |
show details | |

|
#38
N Grandview Ave
Dubuque, IA 52001
|
1,169 sq. feet
|
1 baths 3 beds |
show details | |

|
#39
E 32nd St
Dubuque, IA 52001
|
768 sq. feet
|
1 baths 3 beds |
show details | |

|
#40
Rhomberg Ave
Dubuque, IA 52001
|
1,536 sq. feet
|
1 baths 3 beds |
show details |
| Photo | Address | Area | Beds / Baths | Price | Details |
|---|---|---|---|---|---|

|
#41
Long Grove Ct
Dubuque, IA 52002
|
- sq. feet
|
- baths - beds |
show details | |

|
#42
Noonan St Lot 224
Dubuque, IA 52003
|
- sq. feet
|
- baths - beds |
show details | |

|
#43
Pearl St
Dubuque, IA 52001
|
- sq. feet
|
- baths - beds |
show details | |

|
#44
Springreen Dr
Dubuque, IA 52002
|
- sq. feet
|
- baths - beds |
show details | |

|
#45
Flamingo Dr
Dubuque, IA 52001
|
- sq. feet
|
- baths - beds |
show details | |

|
#46
Millstone Dr
Dubuque, IA 52002
|
- sq. feet
|
- baths - beds |
show details | |

|
#47
Carter Rd Apt 6
Dubuque, IA 52001
|
- sq. feet
|
- baths - beds |
show details | |

|
#48
Pleasant View Dr Apt 301
Dubuque, IA 52001
|
- sq. feet
|
- baths - beds |
show details | |

|
#49
W 7th St
Dubuque, IA 52001
|
- sq. feet
|
- baths - beds |
show details | |

|
Check over 1 million property listings on Foreclosure.com!
|
browse all offers | |||

Latest news about housing in Dubuque, IA collected exclusively by city-data.com from local newspapers, TV, and radio stations

 | Rental Housing in Dubuque for Ohio Couple (19 replies) |
| Looking for apartments in Dubuque (2 replies) |
| Looking for apartments in Dubuque (3 replies) |
| Looking for Rental Homes in Dubuque Iowa (9 replies) |
| Am moving from California to Dubuque Iowa (11 replies) |
| Moving to Dubuque Iowa - Where are the rentals? (2 replies) |
Median year apartment built: 1965
Household type by relationship:
Households: 59,233- Male householders: 12,417 (3,987 living alone), Female householders: 12,746 (4,790 living alone)
10,538 spouses (10,417 opposite-sex spouses), 1,852 unmarried partners, (1,709 opposite-sex unmarried partners), 13,671 children (12,962 natural, 348 adopted, 360 stepchildren), 687 grandchildren, 517 brothers or sisters, 455 parents, 8 foster children, 572 other relatives, 1,929 non-relatives
- In group quarters: 3,837
Size of family households: 7,781 2-persons, 3,100 3-persons, 1,720 4-persons, 1,011 5-persons, 306 6-persons, 248 7-or-more-persons.
Size of nonfamily households: 8,834 1-person, 2,427 2-persons, 210 3-persons, 156 4-persons, 43 5-persons, 19 6-persons.
7,301 married couples with children.
2,527 single-parent households (1,074 men, 1,453 women).
94.5% of residents of Dubuque speak English at home.
2.5% of residents speak Spanish at home (73% speak English very well, 14% speak English well, 5% speak English not well, 9% don't speak English at all).
1.0% of residents speak other Indo-European language at home (54% speak English very well, 17% speak English well, 29% speak English not well).
1.6% of residents speak Asian or Pacific Island language at home (47% speak English very well, 27% speak English well, 22% speak English not well, 5% don't speak English at all).
0.4% of residents speak other language at home (64% speak English very well, 13% speak English well, 20% speak English not well, 3% don't speak English at all).
Foreign born population: 3,266 (5.5%)
(42.1% of them are naturalized citizens)
| Here: | 6.6 |
| State: | 6.8 |
| Here: | 4.1 |
| State: | 4.2 |
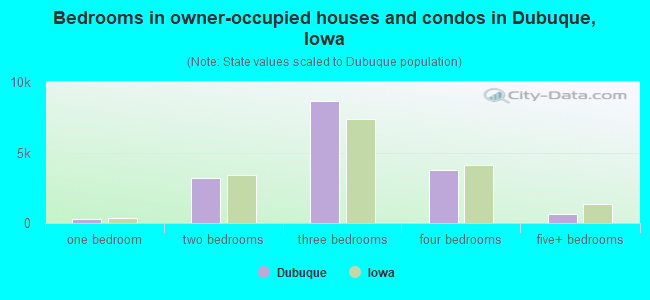
- Bedrooms in owner-occupied houses and condos in Dubuque, Iowa
- 24no bedroom
- 2911 bedroom
- 3,2252 bedrooms
- 8,6593 bedrooms
- 3,7284 bedrooms
- 6625+ bedrooms
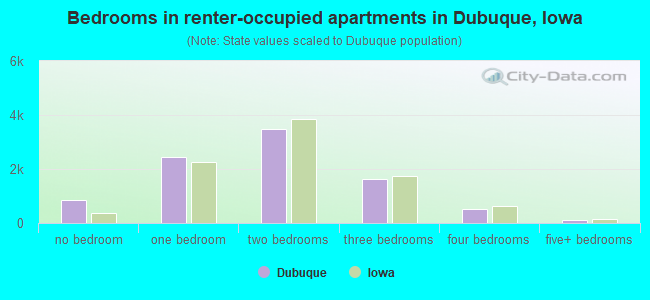
- Bedrooms in renter-occupied apartments in Dubuque, Iowa
- 857no bedroom
- 2,4501 bedroom
- 3,4642 bedrooms
- 1,6213 bedrooms
- 5254 bedrooms
- 1075+ bedrooms
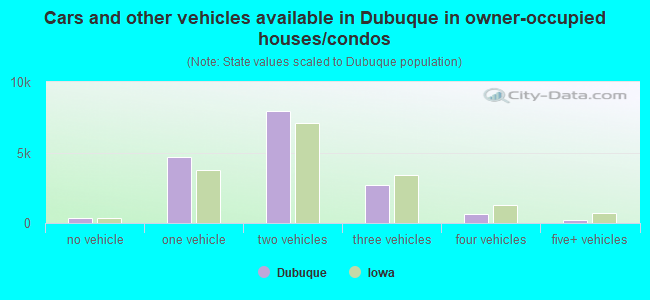
- Cars and other vehicles available in Dubuque in owner-occupied houses/condos
- 335no vehicle
- 4,6911 vehicle
- 7,9732 vehicles
- 2,7133 vehicles
- 6404 vehicles
- 2375+ vehicles
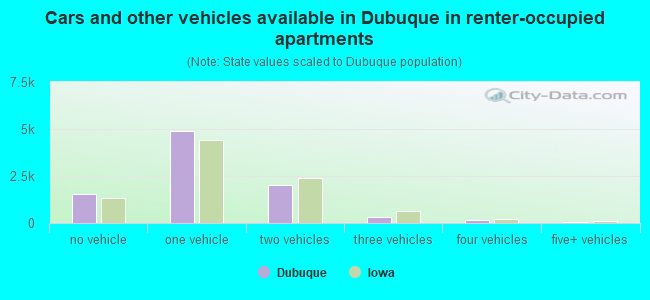
- Cars and other vehicles available in Dubuque in renter-occupied apartments
- 1,557no vehicle
- 4,8741 vehicle
- 2,0192 vehicles
- 3453 vehicles
- 1574 vehicles
- 725+ vehicles
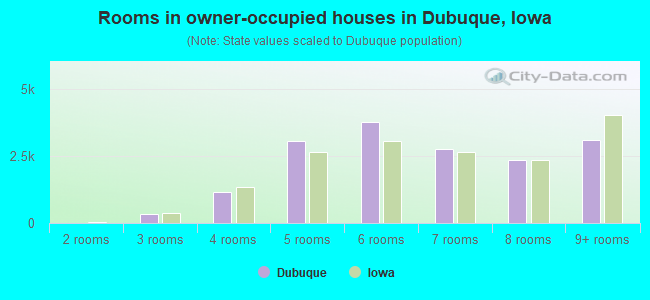
- Rooms in owner-occupied houses in Dubuque, Iowa
- 241 room
- 62 rooms
- 3233 rooms
- 1,1714 rooms
- 3,0715 rooms
- 3,7926 rooms
- 2,7527 rooms
- 2,3628 rooms
- 3,0889+ rooms
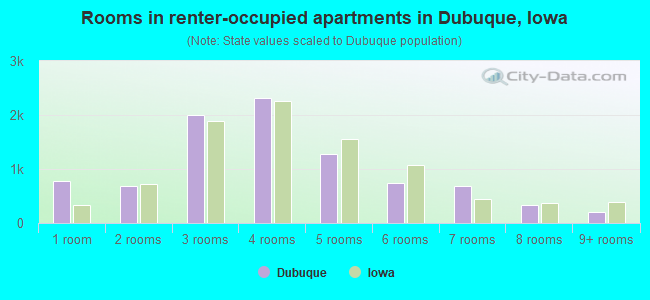
- Rooms in renter-occupied apartments in Dubuque, Iowa
- 7811 room
- 6772 rooms
- 1,9963 rooms
- 2,3244 rooms
- 1,2845 rooms
- 7476 rooms
- 6787 rooms
- 3388 rooms
- 1989+ rooms
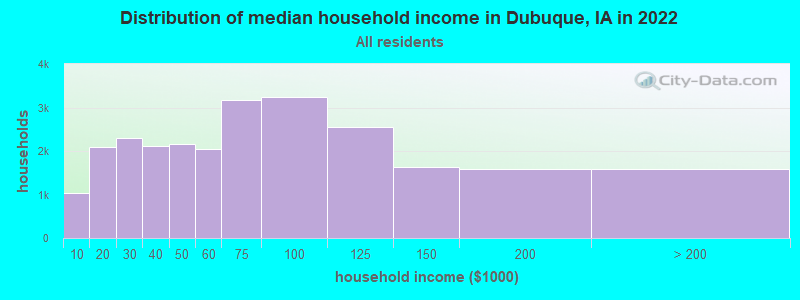
Dubuque, IA household income distribution

- 1,040Less than $10,000
- 2,088$10,000 to $19,999
- 2,301$20,000 to $29,999
- 2,124$30,000 to $39,999
- 2,152$40,000 to $49,999
- 2,039$50,000 to $59,999
- 3,177$60,000 to $74,999
- 3,232$75,000 to $99,999
- 2,548$100,000 to $124,999
- 1,625$125,000 to $149,999
- 1,590$150,000 to $199,999
- 1,580$200,000 or more
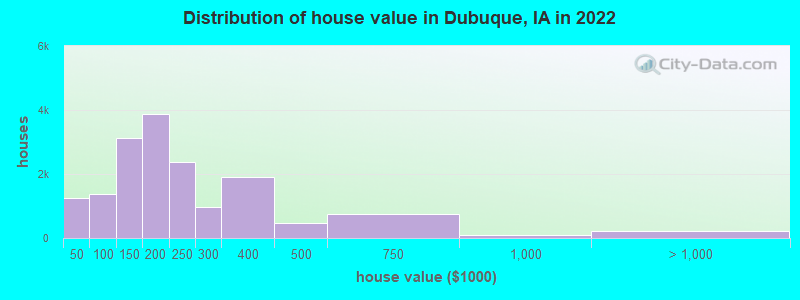
Home value of owner - occupied houses in 2022 in Dubuque, IA
-
- 224Less than $10,000
- 90$10,000 to $14,999
- 85$15,000 to $19,999
- 137$20,000 to $24,999
- 93$25,000 to $29,999
- 196$30,000 to $34,999
- 209$35,000 to $39,999
- 206$40,000 to $49,999
- 216$50,000 to $59,999
- 171$60,000 to $69,999
- 85$70,000 to $79,999
- 292$80,000 to $89,999
- 407$90,000 to $99,999
- 1,806$100,000 to $124,999
- 1,321$125,000 to $149,999
- 2,218$150,000 to $174,999
- 1,650$175,000 to $199,999
- 2,383$200,000 to $249,999
- 974$250,000 to $299,999
- 1,911$300,000 to $399,999
- 474$400,000 to $499,999
- 758$500,000 to $749,999
- 108$750,000 to $999,999
- 119$1,000,000 to $1,499,999
- 61$1,500,000 to $1,999,999
- 40$2,000,000 or more
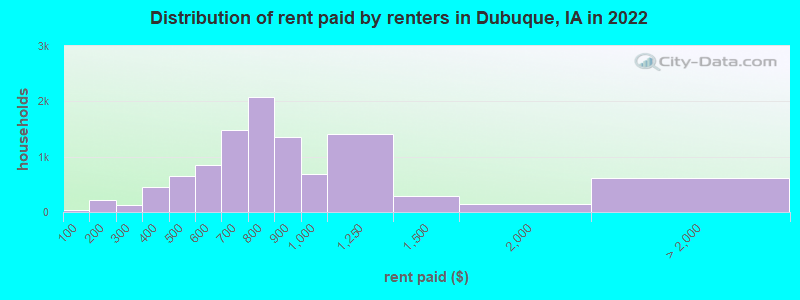
Rent paid by renters in 2022 in Dubuque, IA
-
- 37Less than $100
- 120$100 to $149
- 87$150 to $199
- 50$200 to $249
- 79$250 to $299
- 409$300 to $349
- 41$350 to $399
- 340$400 to $449
- 308$450 to $499
- 532$500 to $549
- 321$550 to $599
- 963$600 to $649
- 519$650 to $699
- 1,055$700 to $749
- 1,017$750 to $799
- 1,357$800 to $899
- 692$900 to $999
- 1,414$1,000 to $1,249
- 282$1,250 to $1,499
- 150$1,500 to $1,999
- 190$2,000 to $2,499
- 19$2,500 to $2,999
- 129$3,000 to $3,499
- 8$3,500 or more
- 266No cash rent
Percentage of workers working in this county: 93.3%
Number of people working at home: 3,387 (11.1% of all workers)
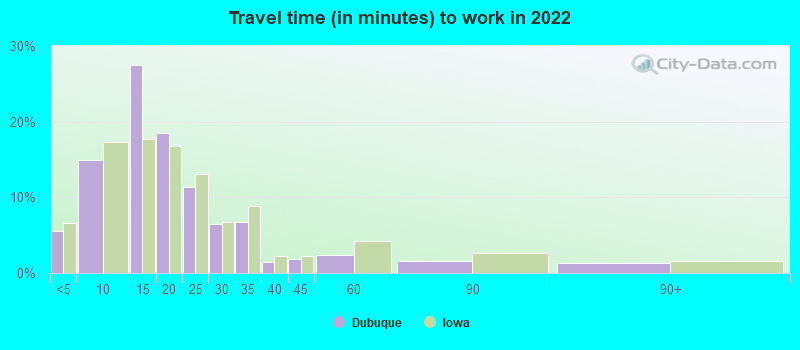
Travel time to work (commute)
- Less than 5 minutes: 1,748
- 5 to 9 minutes: 5,244
- 10 to 14 minutes: 8,440
- 15 to 19 minutes: 5,300
- 20 to 24 minutes: 2,220
- 25 to 29 minutes: 965
- 30 to 34 minutes: 1,024
- 35 to 39 minutes: 86
- 40 to 44 minutes: 152
- 45 to 59 minutes: 151
- 60 to 89 minutes: 319
- 90 or more minutes: 256
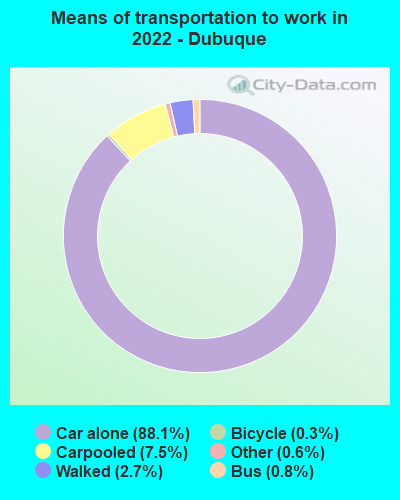
Means of transportation to work:
- Drove a car alone: 32,844 (80.0%)
- Carpooled: 2,941 (7.2%)
- Bus: 295 (0.7%)
- Taxi: 219 (0.5%)
- Bicycle: 121 (0.3%)
- Walked: 1,024 (2.5%)
- Worked at home: 3,387 (8.2%)
- Unemployment by race in 2022
- Unemployment rate for White non-Hispanic residents
- 2.7%Males
- 3.1%Females
- Unemployment rate for Black residents
- 34.6%Males
- 20.6%Females
- Unemployment rate for American Indian and Alaska Native residents
- 35.0%Females
- Unemployment rate for Asian residents
- 2.0%Females
- Unemployment rate for two or more race residents
- 11.7%Males
- 1.2%Females
- Unemployment rate for Hispanic or Latino residents
- 0.9%Females
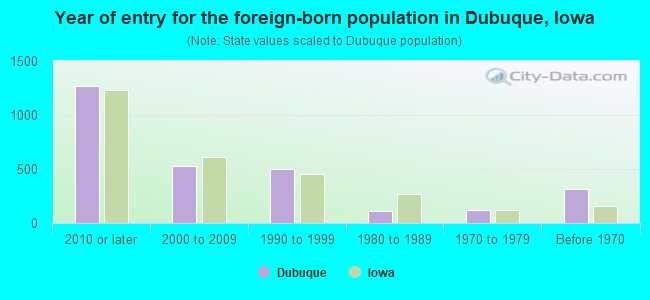
- Year of entry for the foreign-born population in Dubuque, Iowa
- 1,2682010 or later
- 5252000 to 2009
- 5031990 to 1999
- 1081980 to 1989
- 1201970 to 1979
- 315Before 1970
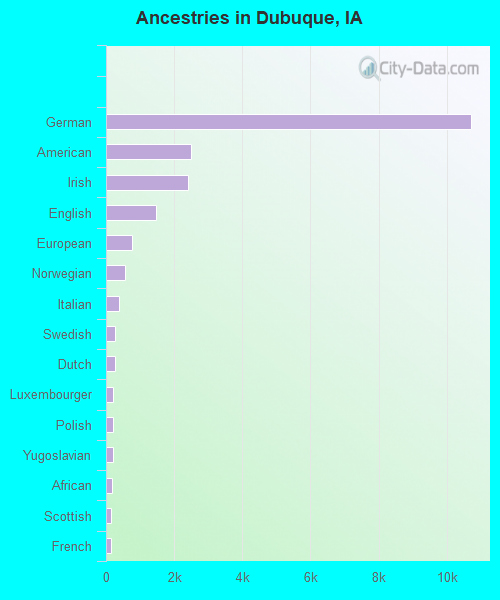
First ancestries reported:
- German: 10,704 (40.1%)
- American: 2,505 (9.4%)
- Irish: 2,403 (9.0%)
- English: 1,468 (5.5%)
- European: 770 (2.9%)
- Norwegian: 564 (2.1%)
- Italian: 368 (1.4%)
- Swedish: 277 (1.0%)
- Dutch: 264 (1.0%)
- Luxembourger: 219 (0.8%)
- Polish: 207 (0.8%)
- Yugoslavian: 197 (0.7%)
- African: 186 (0.7%)
- Scottish: 153 (0.6%)
- French: 142 (0.5%)
- Greek: 84 (0.3%)
- Czech: 74 (0.3%)
- French Canadian: 67 (0.3%)
- Iranian: 60 (0.2%)
- Swiss: 60 (0.2%)
- Danish: 59 (0.2%)
- Arab: 53 (0.2%)
- Scandinavian: 49 (0.2%)
- Scotch-Irish: 45 (0.2%)
- Northern European: 43 (0.2%)
- Welsh: 36 (0.1%)
- Slovak: 25 (0.09%)
- British: 23 (0.09%)
- Belgian: 22 (0.08%)
- Czechoslovakian: 21 (0.08%)
- Russian: 18 (0.07%)
- Haitian: 18 (0.07%)
- Eastern European: 16 (0.06%)
- Brazilian: 11 (0.04%)
- Lithuanian: 11 (0.04%)
- Lebanese: 10 (0.04%)
- Ghanaian: 9 (0.03%)
- Ukrainian: 9 (0.03%)
- Romanian: 8 (0.03%)
- Croatian: 8 (0.03%)
- Iraqi: 7 (0.03%)
- Austrian: 6 (0.02%)
- Hungarian: 5 (0.02%)
- Somali: 5 (0.02%)
- German Russian: 4 (0.01%)
- Egyptian: 4 (0.01%)
- Slovene: 2 (0.01%)
- Syrian: 2 (0.01%)
- Nigerian: 2 (0.01%)
Most common places of birth for foreign-born residents (%):
| Dubuque: | 17.6% (425) |
| Iowa: | 0.4% (676) |
| Dubuque: | 12.5% (302) |
| Iowa: | 2.6% (4,675) |
| Dubuque: | 12.2% (296) |
| Iowa: | 23.3% (41,625) |
| Dubuque: | 10.0% (241) |
| Iowa: | 3.2% (5,751) |
| Dubuque: | 7.7% (185) |
| Iowa: | 4.6% (8,194) |
| Dubuque: | 5.3% (128) |
| Iowa: | 3.2% (5,672) |
| Dubuque: | 4.8% (116) |
| Iowa: | 0.2% (370) |
| Dubuque: | 2.4% (58) |
| Iowa: | 0.3% (603) |
| Dubuque: | 2.0% (49) |
| Iowa: | 0.0% (88) |
| Dubuque: | 1.8% (44) |
| Iowa: | 4.2% (7,428) |
Place of birth for U.S.-born residents:
- This state: 39,680
- Other state: 16,333
- Northeast: 833
- Midwest: 11,356
- South: 1,720
- West: 2,439
86.2% of Dubuque residents lived in the same house 1 years ago.
Out of people who lived in different houses, 34.7% lived in this county.
Out of people who lived in different counties, 33.1% lived in Iowa.
| Dubuque: | 86.2% |
| State average: | 87.2% |
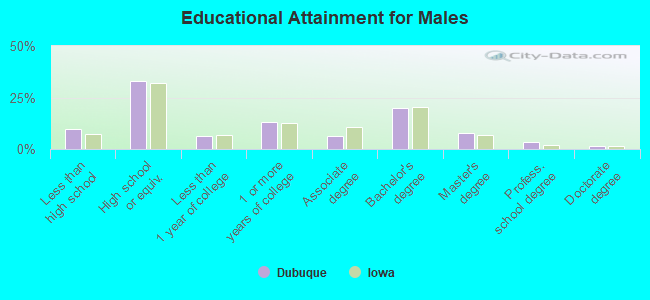
Education attainment for males 25 years and older:
- No schooling: 452
- Nursery to 4th grade: 57
- 5th and 6th grade: 6
- 7th and 8th grade: 332
- 9th grade: 72
- 10th grade: 362
- 11th grade: 389
- 12th grade, no diploma: 232
- High school graduate (or equivalency): 6,603
- Less than 1 year of college: 1,243
- Some college more than 1 year, no degree: 2,599
- Associate degree: 1,242
- Bachelor's degree: 4,006
- Master's degree: 1,511
- Professional school degree: 675
- Doctorate degree: 278
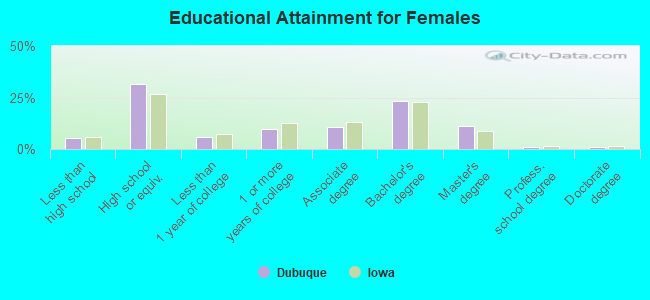
Education attainment for females 25 years and older:
- No schooling: 104
- Nursery to 4th grade: 0
- 5th and 6th grade: 44
- 7th and 8th grade: 120
- 9th grade: 95
- 10th grade: 291
- 11th grade: 337
- 12th grade, no diploma: 151
- High school graduate (or equivalency): 6,571
- Less than 1 year of college: 1,216
- Some college more than 1 year, no degree: 2,033
- Associate degree: 2,217
- Bachelor's degree: 4,813
- Master's degree: 2,357
- Professional school degree: 180
- Doctorate degree: 227
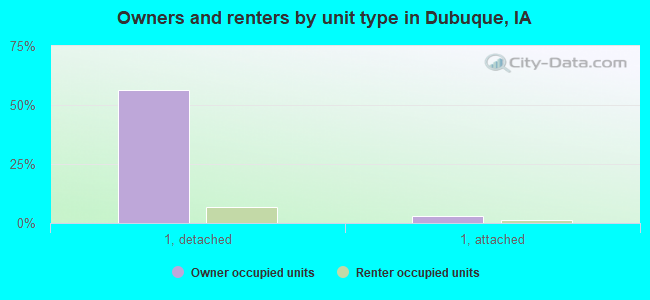
Housing units in structures:
- One, detached: 17,187
- One, attached: 1,129
- Two: 1,405
- 3 or 4: 1,853
- 5 to 9: 1,403
- 10 to 19: 1,207
- 20 to 49: 1,324
- 50 or more: 1,282
- Mobile homes: 963
Median worth of mobile homes: $27,403
Housing units lacking complete kitchen facilities in 2022: 3.4%
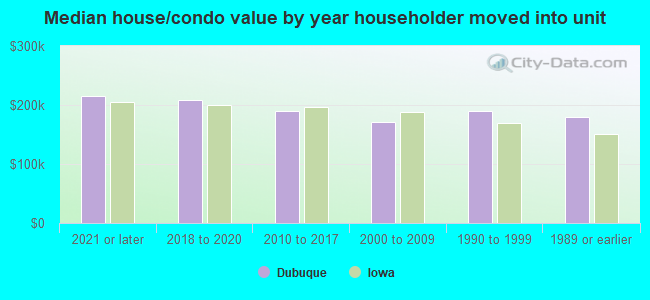
House/condo owner moved in on average 12 years ago
Renter moved in on average 1 years ago
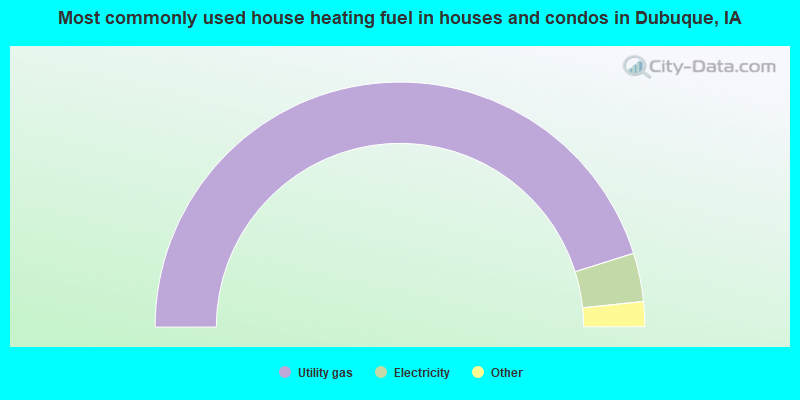
- 90.3%Utility gas
- 6.4%Electricity
- 2.0%Bottled, tank, or LP gas
- 0.7%Fuel oil, kerosene, etc.
- 0.3%Wood
- 0.1%Other fuel
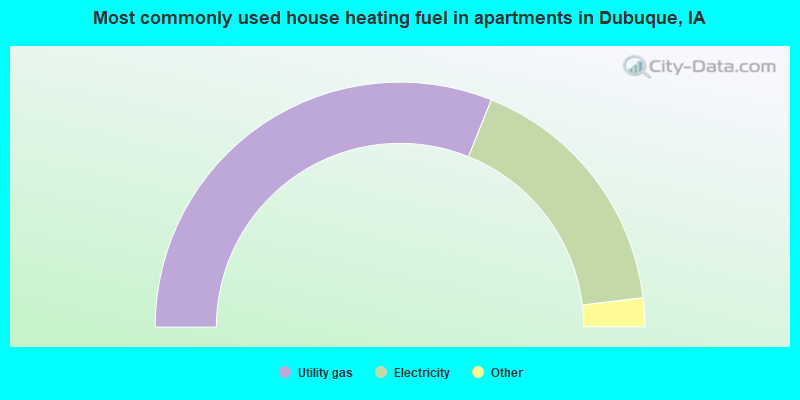
- 62.2%Utility gas
- 34.0%Electricity
- 1.3%Bottled, tank, or LP gas
- 1.2%Other fuel
- 0.9%No fuel used
- 0.3%Wood
- 0.1%Solar energy
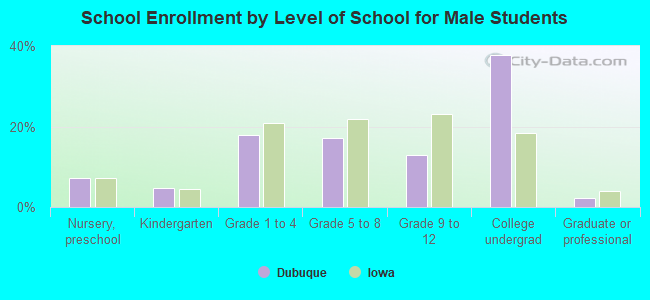
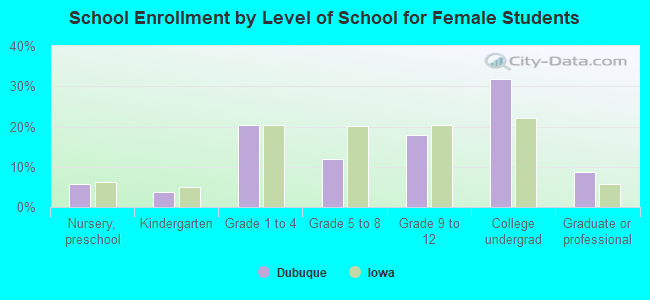
Private vs. public school enrollment:
| Here: | 18.2% |
| Iowa: | 10.6% |
| Here: | 9.7% |
| Iowa: | 7.9% |
| Here: | 72.2% |
| Iowa: | 23.9% |