Duncanville, TX (Texas) Houses and Residents
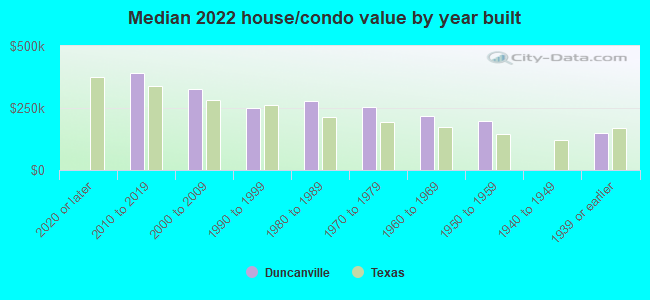
| Duncanville: | $253,395 |
| Texas: | $275,400 |
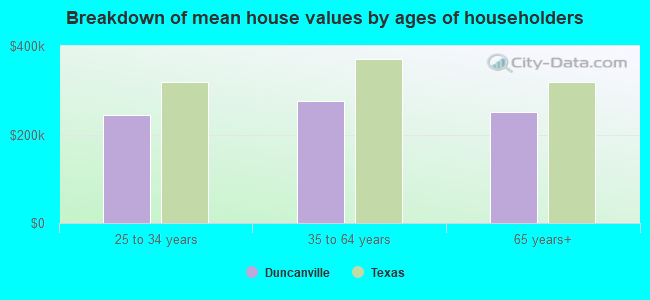
Mean price in 2022:
Detached houses: $253,585
Here: $253,585 State: $369,058 Townhouses or other attached units: $188,109
Here: $188,109 State: $327,631 In 3-to-4-unit structures: $114,473
Here: $114,473 State: $209,652
Total population: 39,707 (Urban population: 35,989, Rural population: 0)
Houses: 14,956 (14,003 occupied: 9,147 owner occupied, 5,035 renter occupied)
| % of renters here: | 36% |
| State: | 38% |
Housing density: 1,325 houses/condos per square mile
Median price asked for vacant for-sale houses and condos in 2022: $212,329.
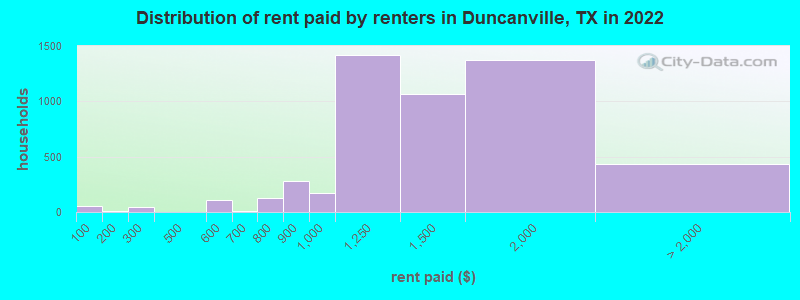
Median contract rent in 2022: $1,306 (lower quartile is $1,077, upper quartile is $1,646)
Median rent asked for vacant for-rent units in 2022: $1,285
Median gross rent in Duncanville, TX in 2022: $1,519
Housing units in Duncanville with a mortgage: 4,948 (291 second mortgage, 30 home equity loan, 167 both second mortgage and home equity loan)
Houses without a mortgage: 15
Median household income for houses/condos with a mortgage: $91,344
Median household income for apartments without a mortgage: $66,573
Median monthly housing costs: $1,365
Compare current foreclosures in Duncanville, TX:
| Photo | Address | Area | Beds / Baths | Price | Details |
|---|---|---|---|---|---|

|
#1
Hayworth Ave
Duncanville, TX 75137
|
1,511 sq. feet
|
2 baths 3 beds |
show details | |

|
#2
Nature Dr
Duncanville, TX 75116
|
1,856 sq. feet
|
2 baths 3 beds |
show details | |

|
#3
Beaver Creek Dr
Duncanville, TX 75137
|
2,240 sq. feet
|
3 baths 4 beds |
show details | |

|
#4
Azalea Ln
Duncanville, TX 75137
|
1,224 sq. feet
|
1 baths 3 beds |
show details | |

|
#5
Trail Ridge Dr
Duncanville, TX 75116
|
1,332 sq. feet
|
1 baths 3 beds |
show details | |

|
#6
Seabrook Dr
Duncanville, TX 75137
|
2,101 sq. feet
|
2 baths 3 beds |
show details | |

|
#7
Flamingo Way
Duncanville, TX 75116
|
1,628 sq. feet
|
2 baths 3 beds |
show details | |

|
#8
W Davis St
Duncanville, TX 75116
|
1,353 sq. feet
|
1 baths 3 beds |
show details | |

|
#9
Gaynor Ave
Duncanville, TX 75137
|
1,451 sq. feet
|
2 baths 4 beds |
show details | |

|
#10
N Horne St
Duncanville, TX 75116
|
1,105 sq. feet
|
2 baths 3 beds |
show details |
| Photo | Address | Area | Beds / Baths | Price | Details |
|---|---|---|---|---|---|

|
#11
Fairwood Pl
Duncanville, TX 75116
|
888 sq. feet
|
1 baths 3 beds |
show details | |

|
#12
Oak Run Dr
Duncanville, TX 75137
|
1,450 sq. feet
|
1 baths 3 beds |
show details | |

|
#13
Green Hills Rd
Duncanville, TX 75137
|
2,636 sq. feet
|
3 baths 4 beds |
show details | |

|
#14
Johnson Dr
Duncanville, TX 75116
|
2,136 sq. feet
|
2 baths 4 beds |
show details | |

|
#15
Blueridge Dr
Duncanville, TX 75137
|
1,304 sq. feet
|
2 baths 4 beds |
show details | |

|
#16
Bow Creek Dr
Duncanville, TX 75116
|
1,928 sq. feet
|
2 baths 3 beds |
show details | |

|
#17
Silver Creek Pl
Duncanville, TX 75137
|
1,543 sq. feet
|
2 baths 3 beds |
show details | |

|
#18
N Venice Dr
Duncanville, TX 75116
|
2,167 sq. feet
|
2 baths 3 beds |
show details | |

|
#19
Cardinal Creek Dr
Duncanville, TX 75137
|
2,101 sq. feet
|
2 baths 4 beds |
show details | |

|
#20
Spring Lake Dr
Duncanville, TX 75137
|
3,565 sq. feet
|
4 baths 4 beds |
show details |
| Photo | Address | Area | Beds / Baths | Price | Details |
|---|---|---|---|---|---|

|
#21
Plateau Dr
Duncanville, TX 75116
|
1,432 sq. feet
|
1 baths 3 beds |
show details | |

|
#22
Naples Dr
Duncanville, TX 75116
|
1,862 sq. feet
|
2 baths 4 beds |
show details | |

|
#23
Green Ridge Dr
Duncanville, TX 75137
|
3,145 sq. feet
|
2 baths 4 beds |
show details | |

|
#24
Eisenhower Dr
Duncanville, TX 75137
|
1,862 sq. feet
|
2 baths 3 beds |
show details | |

|
#25
Deer Ridge Dr
Duncanville, TX 75137
|
2,185 sq. feet
|
2 baths 3 beds |
show details | |

|
#26
S Greenstone Ln
Duncanville, TX 75137
|
2,879 sq. feet
|
3 baths 4 beds |
show details | |

|
#27
Ten Mile Ln
Duncanville, TX 75137
|
1,314 sq. feet
|
2 baths 3 beds |
show details | |

|
#28
Briar Hill Cir
Duncanville, TX 75137
|
2,284 sq. feet
|
2 baths 4 beds |
show details | |

|
#29
Linda Ln
Duncanville, TX 75137
|
1,571 sq. feet
|
2 baths 3 beds |
show details | |

|
#30
Sunrise Ln
Duncanville, TX 75137
|
1,318 sq. feet
|
1 baths 3 beds |
show details |
| Photo | Address | Area | Beds / Baths | Price | Details |
|---|---|---|---|---|---|

|
#31
E Cherry Cir
Duncanville, TX 75116
|
1,490 sq. feet
|
2 baths 3 beds |
show details | |

|
#32
Florence Dr
Duncanville, TX 75116
|
2,174 sq. feet
|
2 baths 3 beds |
show details | |

|
#33
Greenbriar Ln
Duncanville, TX 75137
|
3,741 sq. feet
|
4 baths 3 beds |
show details | |

|
#34
Wren Ave
Duncanville, TX 75116
|
1,031 sq. feet
|
1 baths - beds |
show details | |

|
#35
Cripple Creek Dr
Duncanville, TX 75116
|
1,029 sq. feet
|
1 baths - beds |
show details | |

|
#36
Trail Ridge Dr
Duncanville, TX 75116
|
1,047 sq. feet
|
1 baths - beds |
show details | |

|
#37
Cedar Hill Rd
Duncanville, TX 75137
|
3,242 sq. feet
|
4 baths - beds |
show details | |

|
#38
Brookside Dr
Duncanville, TX 75137
|
- sq. feet
|
- baths - beds |
show details | |

|
#39
Johnson Dr
Duncanville, TX 75116
|
- sq. feet
|
- baths - beds |
show details | |

|
#40
W Wheatland Rd
Duncanville, TX 75116
|
- sq. feet
|
- baths - beds |
show details |
| Photo | Address | Area | Beds / Baths | Price | Details |
|---|---|---|---|---|---|

|
#41
Main Park Ln
Duncanville, TX 75137
|
- sq. feet
|
- baths - beds |
show details | |

|
#42
Hustead St Apt 34
Duncanville, TX 75116
|
- sq. feet
|
- baths - beds |
show details | |

|
#43
E Highway 67
Duncanville, TX 75137
|
- sq. feet
|
- baths - beds |
show details | |

|
#44
N Main St
Duncanville, TX 75116
|
- sq. feet
|
- baths - beds |
show details | |

|
Check over 1 million property listings on Foreclosure.com!
|
browse all offers | |||

Latest news about housing in Duncanville, TX collected exclusively by city-data.com from local newspapers, TV, and radio stations

 | 2nd chance housing/apartment (1 reply) |
| Where in Dallas can I find reasonable Houses under $100 k (20 replies) |
| Are Northern burbs households stretched way thin? (25 replies) |
| Commute between Melissa and Las Colinas (58 replies) |
| Crime in Cedar Hill , Duncanville , Southwest Arlington? (21 replies) |
| Looking for a safe apartment/rental on a tight budget (9 replies) |

Median year apartment built: 1980
Household type by relationship:
Households: 40,238- Male householders: 6,586 (1,379 living alone), Female householders: 7,096 (2,033 living alone)
6,453 spouses (6,403 opposite-sex spouses), 619 unmarried partners, (497 opposite-sex unmarried partners), 13,972 children (13,291 natural, 413 adopted, 267 stepchildren), 1,720 grandchildren, 810 brothers or sisters, 574 parents, 0 foster children, 1,344 other relatives, 808 non-relatives
- In group quarters: 251
Size of family households: 3,638 2-persons, 3,040 3-persons, 1,687 4-persons, 793 5-persons, 378 6-persons, 442 7-or-more-persons.
Size of nonfamily households: 3,647 1-person, 397 2-persons, 22 3-persons, 33 4-persons.
5,174 married couples with children.
3,324 single-parent households (608 men, 2,716 women).
67.4% of residents of Duncanville speak English at home.
30.8% of residents speak Spanish at home (60% speak English very well, 19% speak English well, 16% speak English not well, 5% don't speak English at all).
0.6% of residents speak other Indo-European language at home (85% speak English very well, 15% speak English well).
0.5% of residents speak Asian or Pacific Island language at home (95% speak English very well, 5% speak English well).
0.8% of residents speak other language at home (83% speak English very well, 17% speak English well).
Foreign born population: 6,313 (15.7%)
(40.6% of them are naturalized citizens)
| Here: | 6.3 |
| State: | 6.3 |
| Here: | 4.6 |
| State: | 4.0 |
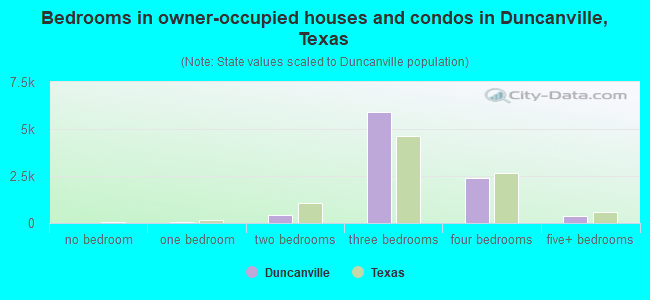
- Bedrooms in owner-occupied houses and condos in Duncanville, Texas
- 11no bedroom
- 641 bedroom
- 4182 bedrooms
- 5,8863 bedrooms
- 2,4054 bedrooms
- 3625+ bedrooms
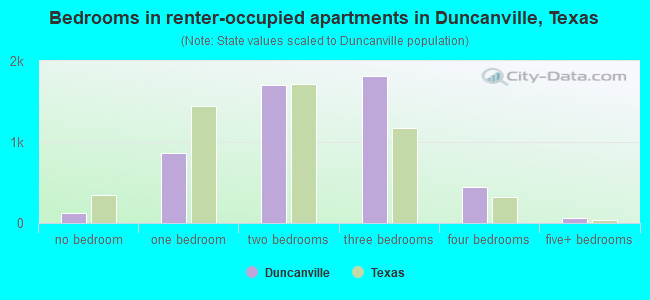
- Bedrooms in renter-occupied apartments in Duncanville, Texas
- 128no bedroom
- 8681 bedroom
- 1,7062 bedrooms
- 1,8203 bedrooms
- 4464 bedrooms
- 675+ bedrooms
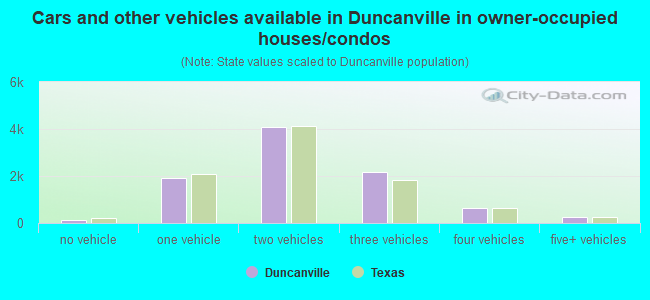
- Cars and other vehicles available in Duncanville in owner-occupied houses/condos
- 108no vehicle
- 1,9141 vehicle
- 4,0822 vehicles
- 2,1553 vehicles
- 6344 vehicles
- 2555+ vehicles
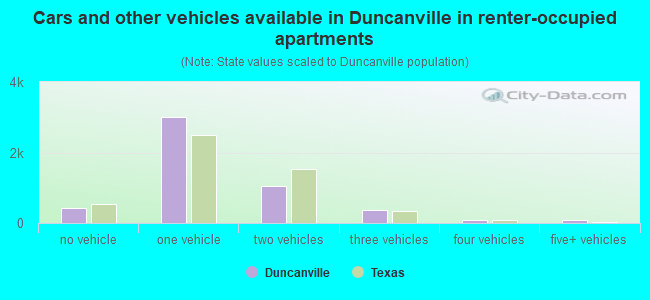
- Cars and other vehicles available in Duncanville in renter-occupied apartments
- 429no vehicle
- 3,0081 vehicle
- 1,0562 vehicles
- 3693 vehicles
- 934 vehicles
- 815+ vehicles
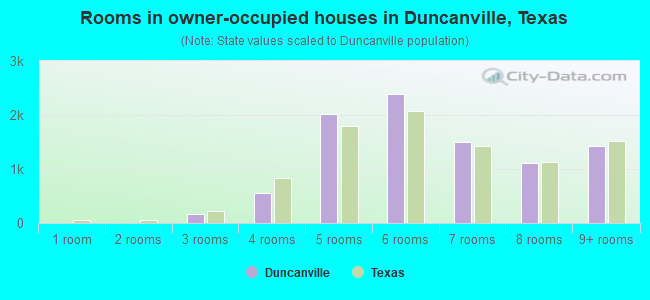
- Rooms in owner-occupied houses in Duncanville, Texas
- 01 room
- 02 rooms
- 1713 rooms
- 5474 rooms
- 2,0235 rooms
- 2,3896 rooms
- 1,4977 rooms
- 1,1038 rooms
- 1,4189+ rooms
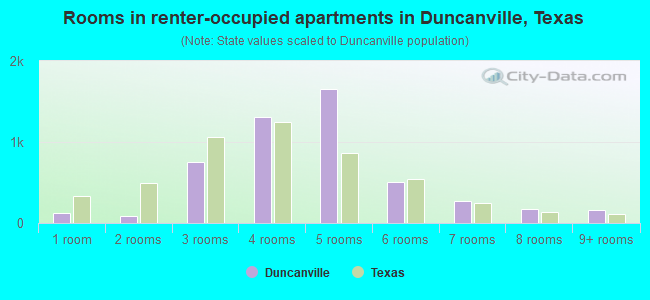
- Rooms in renter-occupied apartments in Duncanville, Texas
- 1281 room
- 852 rooms
- 7483 rooms
- 1,3104 rooms
- 1,6575 rooms
- 5036 rooms
- 2747 rooms
- 1708 rooms
- 1599+ rooms
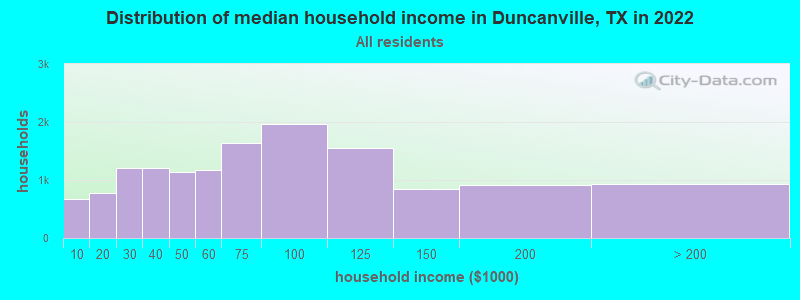
Duncanville, TX household income distribution

- 677Less than $10,000
- 780$10,000 to $19,999
- 1,211$20,000 to $29,999
- 1,214$30,000 to $39,999
- 1,130$40,000 to $49,999
- 1,181$50,000 to $59,999
- 1,630$60,000 to $74,999
- 1,964$75,000 to $99,999
- 1,552$100,000 to $124,999
- 847$125,000 to $149,999
- 919$150,000 to $199,999
- 929$200,000 or more
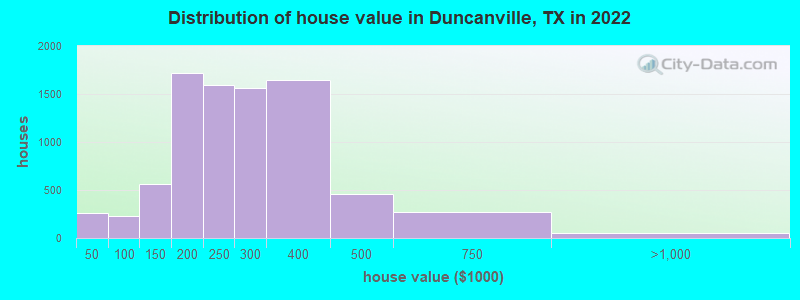
Home value of owner - occupied houses in 2022 in Duncanville, TX
-
- 43Less than $10,000
- 36$10,000 to $14,999
- 16$15,000 to $19,999
- 27$20,000 to $24,999
- 18$25,000 to $29,999
- 35$30,000 to $34,999
- 9$35,000 to $39,999
- 75$40,000 to $49,999
- 9$50,000 to $59,999
- 40$60,000 to $69,999
- 66$80,000 to $89,999
- 38$90,000 to $99,999
- 292$100,000 to $124,999
- 274$125,000 to $149,999
- 847$150,000 to $174,999
- 873$175,000 to $199,999
- 1,590$200,000 to $249,999
- 1,560$250,000 to $299,999
- 1,642$300,000 to $399,999
- 457$400,000 to $499,999
- 268$500,000 to $749,999
- 50$750,000 to $999,999
- 4$1,000,000 to $1,499,999
Rent paid by renters in 2022 in Duncanville, TX
-
- 56Less than $100
- 11$150 to $199
- 40$250 to $299
- 55$500 to $549
- 48$550 to $599
- 12$600 to $649
- 30$700 to $749
- 97$750 to $799
- 283$800 to $899
- 176$900 to $999
- 1,423$1,000 to $1,249
- 1,068$1,250 to $1,499
- 1,375$1,500 to $1,999
- 184$2,000 to $2,499
- 248No cash rent
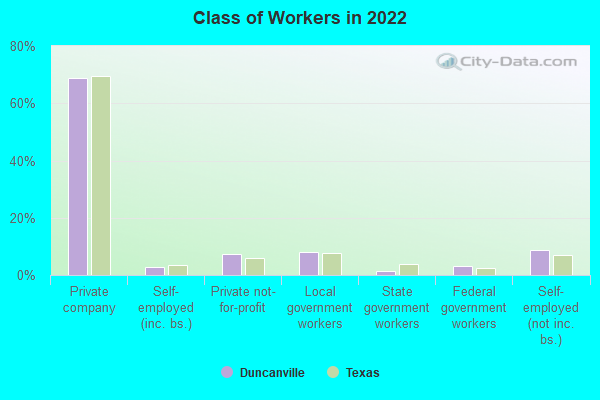
Percentage of workers working in this county: 83.4%
Number of people working at home: 2,491 (14.1% of all workers)
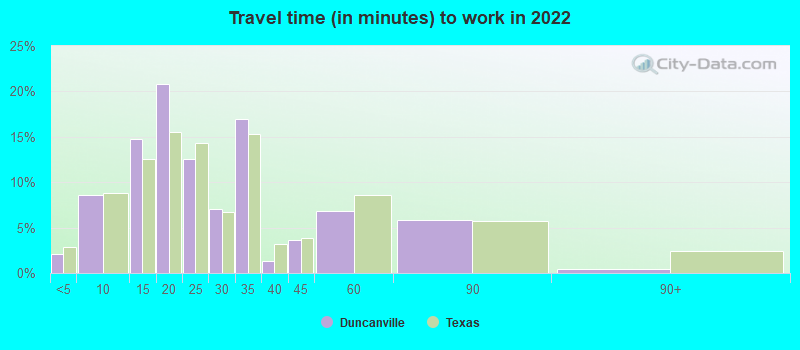
Travel time to work (commute)
- Less than 5 minutes: 230
- 5 to 9 minutes: 973
- 10 to 14 minutes: 1,985
- 15 to 19 minutes: 2,805
- 20 to 24 minutes: 2,194
- 25 to 29 minutes: 1,403
- 30 to 34 minutes: 2,806
- 35 to 39 minutes: 466
- 40 to 44 minutes: 423
- 45 to 59 minutes: 1,141
- 60 to 89 minutes: 578
- 90 or more minutes: 197
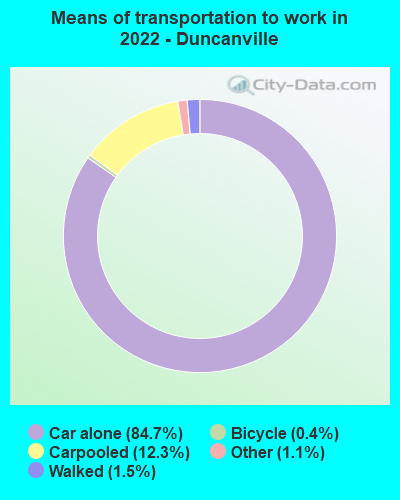
Means of transportation to work:
- Drove a car alone: 9,114 (70.0%)
- Carpooled: 1,358 (10.4%)
- Taxi: 153 (1.2%)
- Bicycle: 54 (0.4%)
- Walked: 172 (1.3%)
- Worked at home: 2,491 (19.1%)
- Unemployment by race in 2022
- Unemployment rate for White non-Hispanic residents
- 11.7%Males
- 0.3%Females
- Unemployment rate for Black residents
- 15.2%Males
- 4.9%Females
- Unemployment rate for American Indian and Alaska Native residents
- 16.2%Females
- Unemployment rate for Asian residents
- 20.0%Females
- Unemployment rate for other race residents
- 1.9%Males
- 9.5%Females
- Unemployment rate for two or more race residents
- 0.8%Males
- 3.0%Females
- Unemployment rate for Hispanic or Latino residents
- 2.3%Males
- 5.6%Females
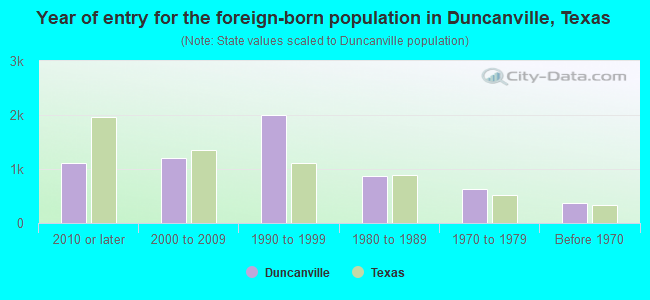
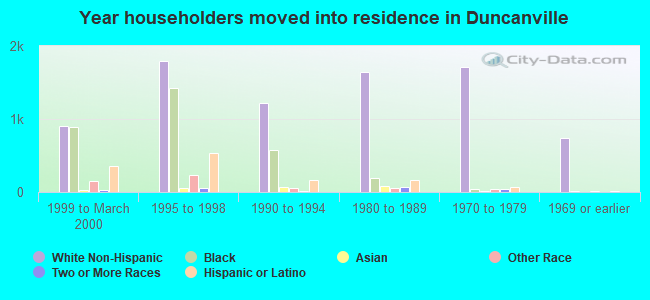
- Year of entry for the foreign-born population in Duncanville, Texas
- 1,1062010 or later
- 1,2082000 to 2009
- 1,9911990 to 1999
- 8651980 to 1989
- 6331970 to 1979
- 369Before 1970
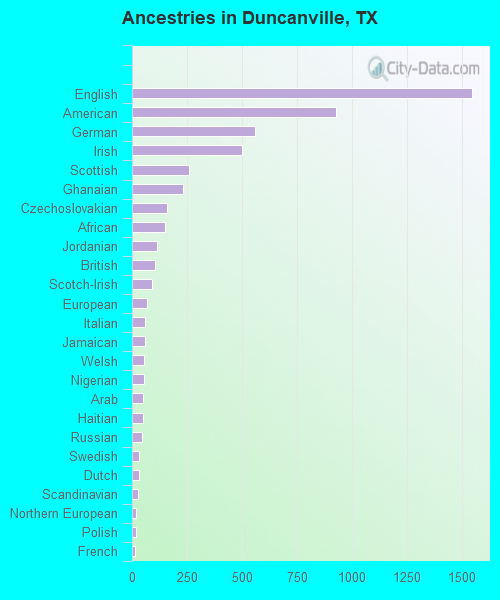
First ancestries reported:
- English: 1,547 (5.5%)
- American: 927 (3.3%)
- German: 558 (2.0%)
- Irish: 499 (1.8%)
- Scottish: 258 (0.9%)
- Ghanaian: 230 (0.8%)
- Czechoslovakian: 157 (0.6%)
- African: 151 (0.5%)
- Jordanian: 113 (0.4%)
- British: 104 (0.4%)
- Scotch-Irish: 92 (0.3%)
- European: 69 (0.2%)
- Italian: 60 (0.2%)
- Jamaican: 58 (0.2%)
- Welsh: 55 (0.2%)
- Nigerian: 53 (0.2%)
- Arab: 51 (0.2%)
- Haitian: 49 (0.2%)
- Russian: 45 (0.2%)
- Swedish: 32 (0.1%)
- Dutch: 30 (0.1%)
- Scandinavian: 29 (0.1%)
- Northern European: 19 (0.07%)
- Polish: 18 (0.06%)
- French: 15 (0.05%)
- Romanian: 8 (0.03%)
- Dutch West Indian: 8 (0.03%)
- Finnish: 4 (0.01%)
- Eastern European: 3 (0.01%)
Most common places of birth for foreign-born residents (%):
| Duncanville: | 58.6% (3,891) |
| Texas: | 48.4% (2,411,723) |
| Duncanville: | 8.8% (587) |
| Texas: | 4.5% (224,455) |
| Duncanville: | 7.2% (477) |
| Texas: | 3.0% (147,182) |
| Duncanville: | 6.4% (423) |
| Texas: | 1.3% (62,978) |
| Duncanville: | 2.3% (152) |
| Texas: | 2.1% (103,148) |
| Duncanville: | 2.2% (146) |
| Texas: | 6.1% (306,347) |
| Duncanville: | 2.0% (131) |
| Texas: | 0.2% (8,922) |
| Duncanville: | 1.8% (119) |
| Texas: | 0.2% (11,402) |
Place of birth for U.S.-born residents:
- This state: 26,208
- Other state: 7,289
- Northeast: 898
- Midwest: 1,884
- South: 2,966
- West: 1,533
92.9% of Duncanville residents lived in the same house 1 years ago.
Out of people who lived in different houses, 41.0% lived in this county.
Out of people who lived in different counties, 72.1% lived in Texas.
| Duncanville: | 92.9% |
| State average: | 85.7% |
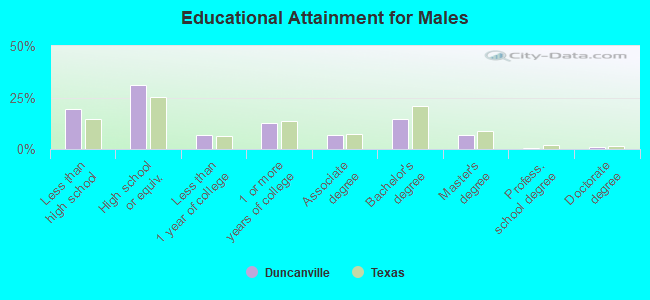
Education attainment for males 25 years and older:
- No schooling: 555
- Nursery to 4th grade: 51
- 5th and 6th grade: 208
- 7th and 8th grade: 146
- 9th grade: 558
- 10th grade: 215
- 11th grade: 236
- 12th grade, no diploma: 418
- High school graduate (or equivalency): 3,795
- Less than 1 year of college: 849
- Some college more than 1 year, no degree: 1,533
- Associate degree: 818
- Bachelor's degree: 1,757
- Master's degree: 805
- Professional school degree: 68
- Doctorate degree: 132
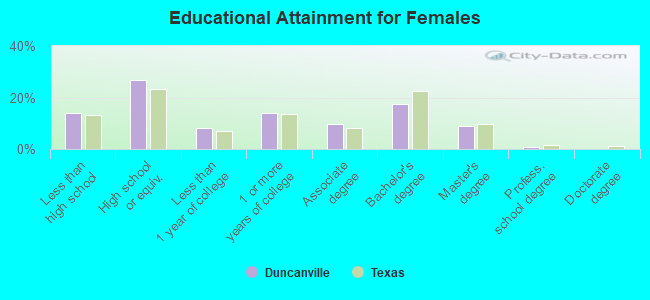
Education attainment for females 25 years and older:
- No schooling: 569
- Nursery to 4th grade: 87
- 5th and 6th grade: 327
- 7th and 8th grade: 112
- 9th grade: 194
- 10th grade: 132
- 11th grade: 320
- 12th grade, no diploma: 204
- High school graduate (or equivalency): 3,726
- Less than 1 year of college: 1,151
- Some college more than 1 year, no degree: 1,928
- Associate degree: 1,365
- Bachelor's degree: 2,433
- Master's degree: 1,251
- Professional school degree: 105
- Doctorate degree: 17


Housing units in structures:
- One, detached: 11,021
- One, attached: 539
- Two: 89
- 3 or 4: 417
- 5 to 9: 916
- 10 to 19: 1,565
- 20 to 49: 58
- 50 or more: 319
- Mobile homes: 26
Housing units lacking complete kitchen facilities in 2022: 0.6%
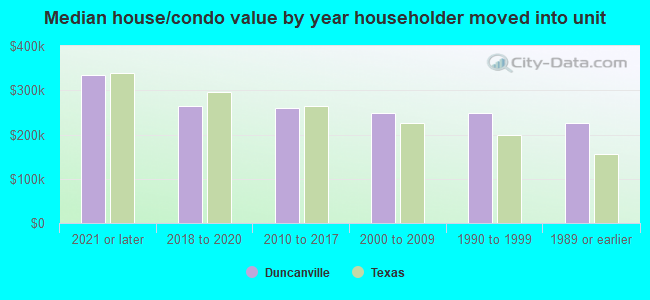
House/condo owner moved in on average 16 years ago
Renter moved in on average 4 years ago
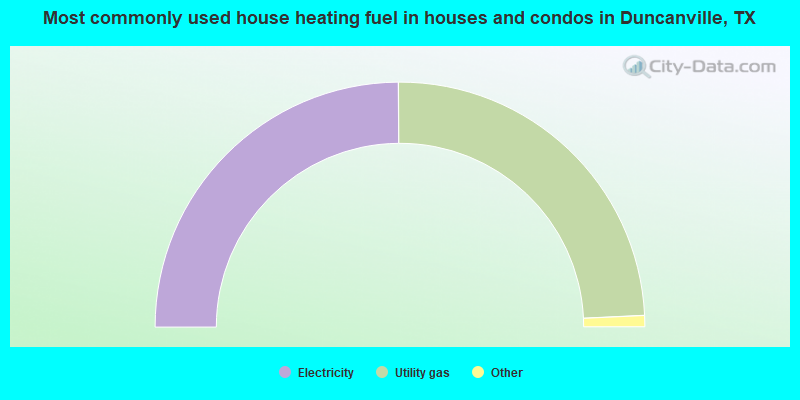
- 49.8%Electricity
- 48.7%Utility gas
- 0.8%Bottled, tank, or LP gas
- 0.5%Solar energy
- 0.2%No fuel used
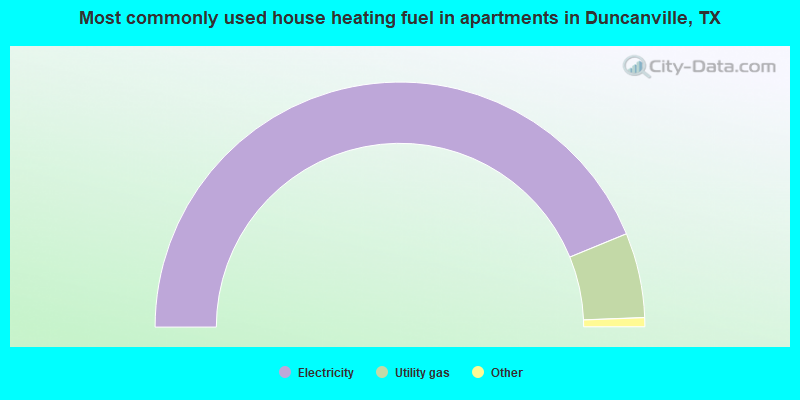
- 87.6%Electricity
- 11.2%Utility gas
- 0.8%Bottled, tank, or LP gas
- 0.4%No fuel used
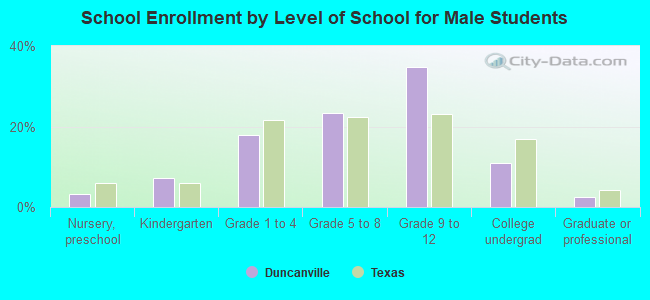
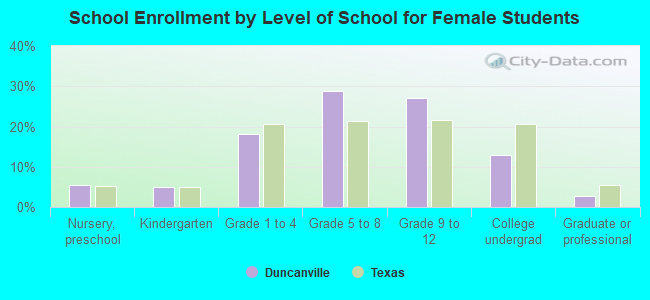
Private vs. public school enrollment:
| Here: | 6.6% |
| Texas: | 8.8% |
| Here: | 6.5% |
| Texas: | 8.0% |
| Here: | 11.8% |
| Texas: | 16.2% |