Dundalk, MD (Maryland) Houses and Residents
| Dundalk: | $198,200 |
| Maryland: | $398,100 |
Total population: 63,597 (Urban population: 62,303, Rural population: 0)
Houses: 27,064 (25,831 occupied: 17,222 owner occupied, 8,609 renter occupied)
| % of renters here: | 33% |
| State: | 32% |
Housing density: 2,037 houses/condos per square mile
Median price asked for vacant for-sale houses and condos in 2022: $107,126.
Median contract rent in 2022: $1,191 (lower quartile is $898, upper quartile is $1,587)
Median rent asked for vacant for-rent units in 2022: $2,297
Median gross rent in Dundalk, MD in 2022: $1,381
Housing units in Dundalk with a mortgage: 9,775 (777 second mortgage, 0 home equity loan, 562 both second mortgage and home equity loan)
Houses without a mortgage: 669
Median household income for houses/condos with a mortgage: $80,170
Median household income for apartments without a mortgage: $44,811
Median monthly housing costs: $1,068
Compare current foreclosures in Dundalk, MD:
| Photo | Address | Area | Beds / Baths | Price | Details |
|---|---|---|---|---|---|

|
#1
Kinship Rd
Dundalk, MD 21222
|
1,044 sq. feet
|
1 baths 3 beds |
show details | |

|
#2
Broadship Rd
Dundalk, MD 21222
|
966 sq. feet
|
1 baths 2 beds |
show details | |

|
#3
School Ln
Dundalk, MD 21222
|
1,448 sq. feet
|
1 baths 3 beds |
show details | |

|
#4
Kinship Rd
Dundalk, MD 21222
|
1,044 sq. feet
|
1 baths 4 beds |
show details | |

|
#5
New Battle Grove Rd
Dundalk, MD 21222
|
1,024 sq. feet
|
1 baths 3 beds |
show details | |

|
#6
Melbourne Rd
Dundalk, MD 21222
|
1,216 sq. feet
|
1 baths - beds |
show details | |

|
#7
Sollers Point Rd
Dundalk, MD 21222
|
1,254 sq. feet
|
2 baths - beds |
show details | |

|
#8
W Woodwell Rd
Dundalk, MD 21222
|
990 sq. feet
|
1 baths - beds |
show details | |

|
#9
Saint Helena Ave
Dundalk, MD 21222
|
1,084 sq. feet
|
1 baths - beds |
show details | |

|
#10
Vulcan Rd
Dundalk, MD 21222
|
1,128 sq. feet
|
1 baths - beds |
show details |
| Photo | Address | Area | Beds / Baths | Price | Details |
|---|---|---|---|---|---|

|
#11
Keyway
Dundalk, MD 21222
|
1,338 sq. feet
|
1 baths - beds |
show details | |

|
#12
Aldworth Rd
Dundalk, MD 21222
|
1,024 sq. feet
|
1 baths - beds |
show details | |

|
#13
Manchester Rd
Dundalk, MD 21222
|
816 sq. feet
|
2 baths - beds |
show details | |

|
#14
Kirkleigh Rd
Dundalk, MD 21222
|
1,258 sq. feet
|
1 baths - beds |
show details | |

|
#15
Ormand Rd
Dundalk, MD 21222
|
1,308 sq. feet
|
1 baths - beds |
show details | |

|
#16
Harold Rd
Dundalk, MD 21222
|
1,200 sq. feet
|
1 baths - beds |
show details | |

|
#17
Southbrook Rd
Dundalk, MD 21222
|
1,429 sq. feet
|
1 baths - beds |
show details | |

|
#18
Saint Bridget Ln
Dundalk, MD 21222
|
1,024 sq. feet
|
1 baths - beds |
show details | |

|
#19
Gray Haven Rd
Dundalk, MD 21222
|
1,048 sq. feet
|
1 baths - beds |
show details | |

|
#20
S Woodwell Rd
Dundalk, MD 21222
|
1,262 sq. feet
|
1 baths - beds |
show details |
| Photo | Address | Area | Beds / Baths | Price | Details |
|---|---|---|---|---|---|

|
#21
Jasmine Rd
Dundalk, MD 21222
|
1,234 sq. feet
|
1 baths - beds |
show details | |

|
#22
Midland Rd
Dundalk, MD 21222
|
1,300 sq. feet
|
1 baths - beds |
show details | |

|
#23
Mid Haven Rd
Dundalk, MD 21222
|
1,024 sq. feet
|
1 baths - beds |
show details | |

|
#24
Kavanagh Rd
Dundalk, MD 21222
|
1,272 sq. feet
|
1 baths - beds |
show details | |

|
#25
Sollers Point Rd
Dundalk, MD 21222
|
2,192 sq. feet
|
2 baths - beds |
show details | |

|
#26
Kavanagh Rd
Dundalk, MD 21222
|
1,024 sq. feet
|
1 baths - beds |
show details | |

|
#27
Broening Rd
Dundalk, MD 21222
|
996 sq. feet
|
1 baths - beds |
show details | |

|
#28
Kavanagh Rd
Dundalk, MD 21222
|
896 sq. feet
|
1 baths - beds |
show details | |

|
#29
Highshire Ct
Dundalk, MD 21222
|
1,280 sq. feet
|
2 baths - beds |
show details | |

|
#30
Gray Haven Rd
Dundalk, MD 21222
|
1,048 sq. feet
|
1 baths - beds |
show details |
| Photo | Address | Area | Beds / Baths | Price | Details |
|---|---|---|---|---|---|

|
#31
Gray Haven Ct
Dundalk, MD 21222
|
1,272 sq. feet
|
1 baths - beds |
show details | |

|
#32
Court Way
Dundalk, MD 21222
|
1,125 sq. feet
|
2 baths - beds |
show details | |

|
#33
Guy Way
Dundalk, MD 21222
|
1,272 sq. feet
|
1 baths - beds |
show details | |

|
#34
Evergreen Dr
Dundalk, MD 21222
|
1,108 sq. feet
|
1 baths - beds |
show details | |

|
#35
Melbourne Rd
Dundalk, MD 21222
|
1,216 sq. feet
|
1 baths - beds |
show details | |

|
#36
Creston Rd
Dundalk, MD 21222
|
1,121 sq. feet
|
1 baths - beds |
show details | |

|
#37
Ashwood Rd
Dundalk, MD 21222
|
789 sq. feet
|
1 baths - beds |
show details | |

|
#38
Cornwall Rd # 2
Dundalk, MD 21222
|
1,704 sq. feet
|
3 baths - beds |
show details | |

|
#39
Lynch Rd
Dundalk, MD 21222
|
1,440 sq. feet
|
1 baths - beds |
show details | |

|
#40
Wise Ave
Dundalk, MD 21222
|
1,808 sq. feet
|
2 baths - beds |
show details |
| Photo | Address | Area | Beds / Baths | Price | Details |
|---|---|---|---|---|---|

|
#41
Yorkway
Dundalk, MD 21222
|
1,144 sq. feet
|
1 baths - beds |
show details | |

|
#42
Watersedge Rd
Dundalk, MD 21222
|
1,125 sq. feet
|
1 baths - beds |
show details | |

|
#43
Old Battle Grove Rd
Dundalk, MD 21222
|
800 sq. feet
|
1 baths - beds |
show details | |

|
#44
Liberty Pkwy
Dundalk, MD 21222
|
1,125 sq. feet
|
1 baths - beds |
show details | |

|
#45
Liberty Pkwy
Dundalk, MD 21222
|
1,564 sq. feet
|
2 baths - beds |
show details | |

|
#46
Pinewood Dr # C
Dundalk, MD 21222
|
1,346 sq. feet
|
3 baths - beds |
show details | |

|
#47
Leeway
Dundalk, MD 21222
|
1,388 sq. feet
|
2 baths - beds |
show details | |

|
#48
New Battle Grove Rd
Dundalk, MD 21222
|
1,024 sq. feet
|
1 baths - beds |
show details | |

|
#49
Belclare Rd
Dundalk, MD 21222
|
1,280 sq. feet
|
1 baths - beds |
show details | |

|
Check over 1 million property listings on Foreclosure.com!
|
browse all offers | |||

Latest news about housing in Dundalk, MD collected exclusively by city-data.com from local newspapers, TV, and radio stations


Median year apartment built: 1959
Household type by relationship:
Households: 66,537- Male householders: 11,572 (3,522 living alone), Female householders: 14,259 (4,344 living alone)
9,126 spouses (9,026 opposite-sex spouses), 3,095 unmarried partners, (2,985 opposite-sex unmarried partners), 19,806 children (17,714 natural, 543 adopted, 1,549 stepchildren), 2,933 grandchildren, 578 brothers or sisters, 1,859 parents, 0 foster children, 1,193 other relatives, 1,853 non-relatives
- In group quarters: 263
Size of family households: 6,104 2-persons, 4,072 3-persons, 3,789 4-persons, 1,762 5-persons, 157 6-persons, 794 7-or-more-persons.
Size of nonfamily households: 7,866 1-person, 1,151 2-persons, 136 3-persons.
5,692 married couples with children.
8,363 single-parent households (1,251 men, 7,112 women).
87.0% of residents of Dundalk speak English at home.
8.9% of residents speak Spanish at home (51% speak English very well, 18% speak English well, 28% speak English not well, 3% don't speak English at all).
1.7% of residents speak other Indo-European language at home (40% speak English very well, 42% speak English well, 12% speak English not well, 5% don't speak English at all).
0.7% of residents speak Asian or Pacific Island language at home (69% speak English very well, 23% speak English well, 8% speak English not well).
1.0% of residents speak other language at home (68% speak English very well, 15% speak English well, 17% speak English not well).
Foreign born population: 6,282 (9.4%)
(39.2% of them are naturalized citizens)
| Here: | 6.4 |
| State: | 7.3 |
| Here: | 5.0 |
| State: | 4.2 |
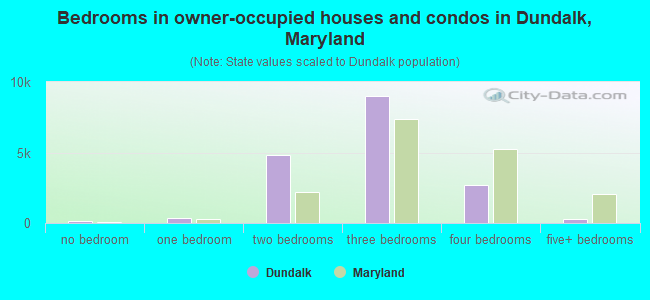
- Bedrooms in owner-occupied houses and condos in Dundalk, Maryland
- 113no bedroom
- 3691 bedroom
- 4,8142 bedrooms
- 8,9783 bedrooms
- 2,6934 bedrooms
- 2555+ bedrooms
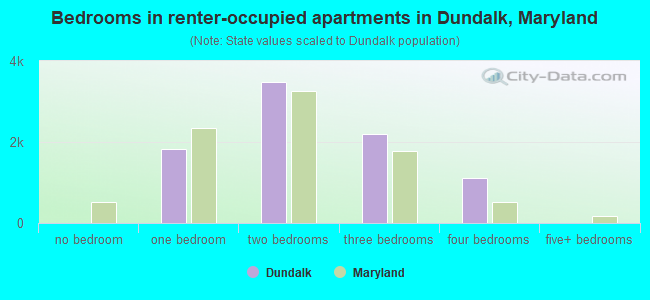
- Bedrooms in renter-occupied apartments in Dundalk, Maryland
- 0no bedroom
- 1,8231 bedroom
- 3,4802 bedrooms
- 2,1983 bedrooms
- 1,1084 bedrooms
- 05+ bedrooms
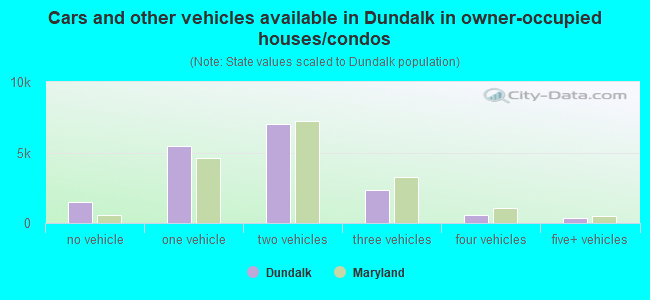
- Cars and other vehicles available in Dundalk in owner-occupied houses/condos
- 1,502no vehicle
- 5,4481 vehicle
- 7,0102 vehicles
- 2,3403 vehicles
- 5644 vehicles
- 3585+ vehicles
- Cars and other vehicles available in Dundalk in renter-occupied apartments
- 1,724no vehicle
- 4,3241 vehicle
- 1,8662 vehicles
- 6953 vehicles
- 04 vehicles
- 05+ vehicles
- Rooms in owner-occupied houses in Dundalk, Maryland
- 1131 room
- 2122 rooms
- 3183 rooms
- 1,1534 rooms
- 2,6475 rooms
- 4,8576 rooms
- 3,0337 rooms
- 2,0618 rooms
- 2,8289+ rooms
- Rooms in renter-occupied apartments in Dundalk, Maryland
- 01 room
- 3002 rooms
- 1,0783 rooms
- 2,1754 rooms
- 1,4495 rooms
- 8706 rooms
- 1,8147 rooms
- 7428 rooms
- 1819+ rooms
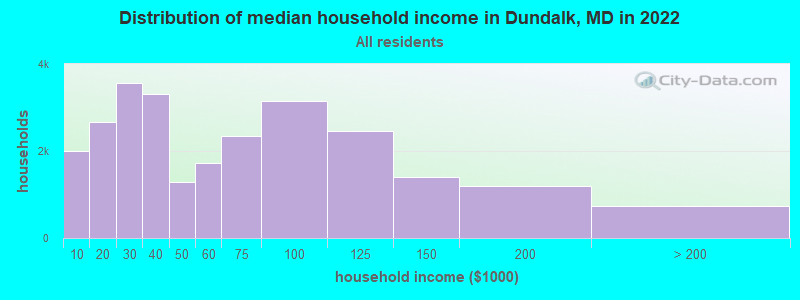
Dundalk, MD household income distribution

- 1,995Less than $10,000
- 2,668$10,000 to $19,999
- 3,569$20,000 to $29,999
- 3,311$30,000 to $39,999
- 1,281$40,000 to $49,999
- 1,729$50,000 to $59,999
- 2,345$60,000 to $74,999
- 3,149$75,000 to $99,999
- 2,452$100,000 to $124,999
- 1,402$125,000 to $149,999
- 1,197$150,000 to $199,999
- 733$200,000 or more
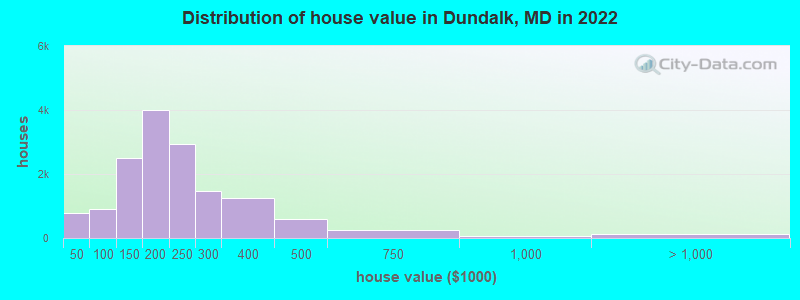
Home value of owner - occupied houses in 2022 in Dundalk, MD
-
- 280Less than $10,000
- 65$10,000 to $14,999
- 144$15,000 to $19,999
- 129$20,000 to $24,999
- 85$25,000 to $29,999
- 21$30,000 to $34,999
- 51$35,000 to $39,999
- 15$40,000 to $49,999
- 99$50,000 to $59,999
- 11$60,000 to $69,999
- 198$70,000 to $79,999
- 307$80,000 to $89,999
- 279$90,000 to $99,999
- 1,246$100,000 to $124,999
- 1,253$125,000 to $149,999
- 2,443$150,000 to $174,999
- 1,566$175,000 to $199,999
- 2,941$200,000 to $249,999
- 1,460$250,000 to $299,999
- 1,235$300,000 to $399,999
- 596$400,000 to $499,999
- 242$500,000 to $749,999
- 51$750,000 to $999,999
- 41$1,000,000 to $1,499,999
- 32$1,500,000 to $1,999,999
- 60$2,000,000 or more
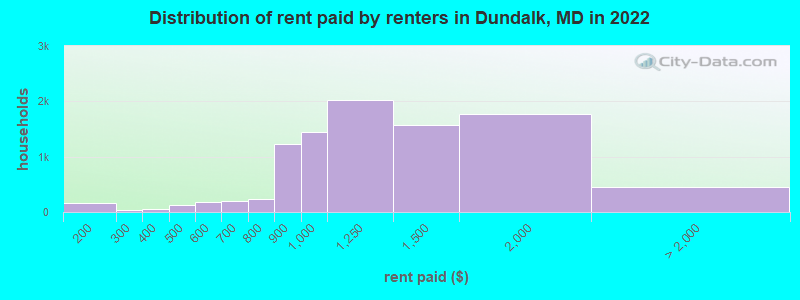
Rent paid by renters in 2022 in Dundalk, MD
-
- 18Less than $100
- 71$100 to $149
- 93$150 to $199
- 9$200 to $249
- 34$250 to $299
- 42$300 to $349
- 12$350 to $399
- 22$400 to $449
- 105$450 to $499
- 108$500 to $549
- 78$550 to $599
- 79$600 to $649
- 117$650 to $699
- 47$700 to $749
- 188$750 to $799
- 1,227$800 to $899
- 1,451$900 to $999
- 2,026$1,000 to $1,249
- 1,579$1,250 to $1,499
- 1,771$1,500 to $1,999
- 111$2,000 to $2,499
- 331No cash rent
Percentage of workers working in this county: 49.3%
Number of people working at home: 2,280 (7.8% of all workers)
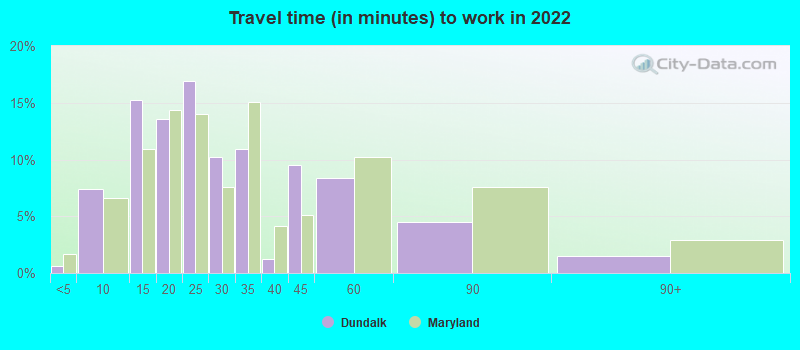
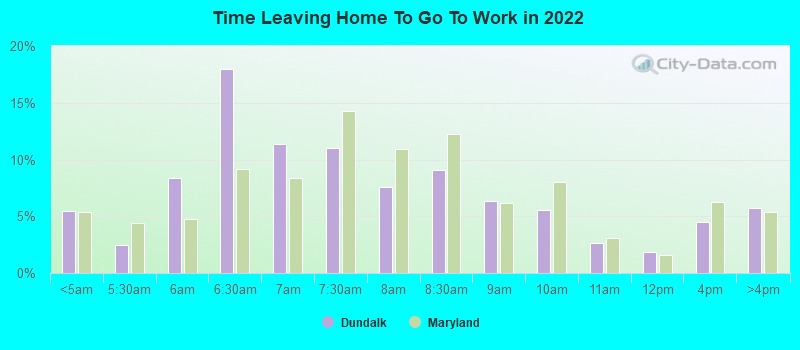
Travel time to work (commute)
- Less than 5 minutes: 266
- 5 to 9 minutes: 1,848
- 10 to 14 minutes: 4,030
- 15 to 19 minutes: 4,384
- 20 to 24 minutes: 3,291
- 25 to 29 minutes: 2,053
- 30 to 34 minutes: 5,082
- 35 to 39 minutes: 603
- 40 to 44 minutes: 1,020
- 45 to 59 minutes: 1,100
- 60 to 89 minutes: 317
- 90 or more minutes: 488
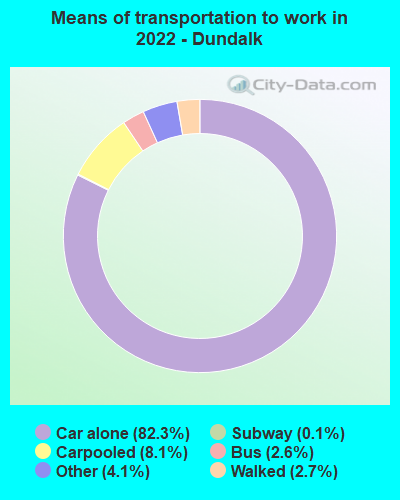
Means of transportation to work:
- Drove a car alone: 10,369 (68.4%)
- Carpooled: 1,168 (7.7%)
- Bus: 200 (1.3%)
- Long-distance train or commuter rail: 40 (0.3%)
- Ferryboat: 9 (0.1%)
- Taxi: 625 (4.1%)
- Bicycle: 4 (0.0%)
- Walked: 378 (2.5%)
- Worked at home: 2,280 (15.0%)
- Unemployment by race in 2022
- Unemployment rate for White non-Hispanic residents
- 10.3%Males
- 11.3%Females
- Unemployment rate for Black residents
- 5.0%Males
- 6.2%Females
- Unemployment rate for Asian residents
- 7.8%Females
- Unemployment rate for other race residents
- 0.2%Males
- 7.6%Females
- Unemployment rate for two or more race residents
- 2.6%Males
- 3.4%Females
- Unemployment rate for Hispanic or Latino residents
- 1.2%Males
- 3.4%Females
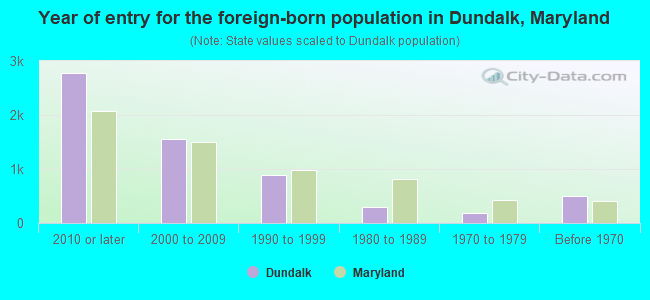
- Year of entry for the foreign-born population in Dundalk, Maryland
- 2,7742010 or later
- 1,5512000 to 2009
- 8851990 to 1999
- 3021980 to 1989
- 1841970 to 1979
- 493Before 1970
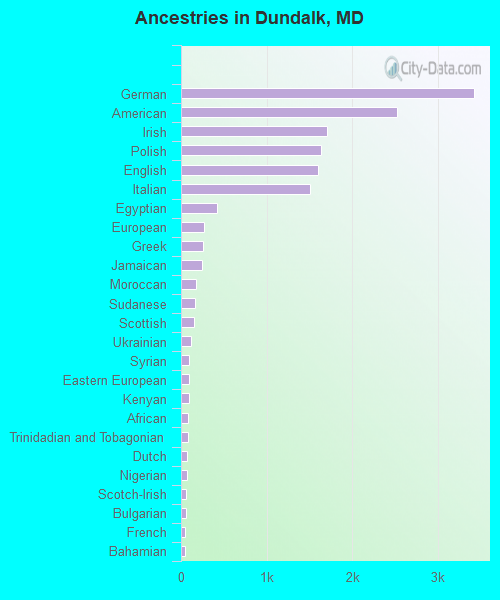
First ancestries reported:
- German: 3,425 (11.2%)
- American: 2,524 (8.2%)
- Irish: 1,707 (5.6%)
- Polish: 1,639 (5.4%)
- English: 1,595 (5.2%)
- Italian: 1,502 (4.9%)
- Egyptian: 423 (1.4%)
- European: 272 (0.9%)
- Greek: 252 (0.8%)
- Jamaican: 243 (0.8%)
- Moroccan: 170 (0.6%)
- Sudanese: 168 (0.5%)
- Scottish: 148 (0.5%)
- Ukrainian: 112 (0.4%)
- Syrian: 99 (0.3%)
- Eastern European: 97 (0.3%)
- Kenyan: 90 (0.3%)
- African: 83 (0.3%)
- Trinidadian and Tobagonian: 78 (0.3%)
- Dutch: 69 (0.2%)
- Nigerian: 68 (0.2%)
- Scotch-Irish: 61 (0.2%)
- Bulgarian: 59 (0.2%)
- French: 52 (0.2%)
- Bahamian: 50 (0.2%)
- Czechoslovakian: 44 (0.1%)
- Russian: 40 (0.1%)
- Portuguese: 38 (0.1%)
- Slovak: 27 (0.09%)
- Iranian: 26 (0.08%)
- Welsh: 25 (0.08%)
- Czech: 24 (0.08%)
- Norwegian: 22 (0.07%)
- Lithuanian: 20 (0.07%)
- Hungarian: 18 (0.06%)
- Northern European: 17 (0.06%)
- French Canadian: 14 (0.05%)
- Slovene: 14 (0.05%)
- Croatian: 14 (0.05%)
- British: 13 (0.04%)
- Romanian: 12 (0.04%)
- Belgian: 12 (0.04%)
- Scandinavian: 10 (0.03%)
- Swedish: 10 (0.03%)
- Finnish: 7 (0.02%)
- Turkish: 6 (0.02%)
- Pennsylvania German: 5 (0.02%)
- Austrian: 4 (0.01%)
- Estonian: 3 (0.01%)
Most common places of birth for foreign-born residents (%):
| Dundalk: | 28.2% (1,768) |
| Maryland: | 2.5% (24,026) |
| Dundalk: | 18.9% (1,185) |
| Maryland: | 12.0% (115,412) |
| Dundalk: | 9.1% (573) |
| Maryland: | 3.5% (34,065) |
| Dundalk: | 8.3% (521) |
| Maryland: | 6.4% (61,725) |
| Dundalk: | 4.1% (258) |
| Maryland: | 4.4% (42,350) |
| Dundalk: | 3.7% (230) |
| Maryland: | 1.2% (11,265) |
| Dundalk: | 3.5% (219) |
| Maryland: | 3.8% (36,698) |
| Dundalk: | 3.2% (198) |
| Maryland: | 0.5% (4,414) |
| Dundalk: | 2.0% (125) |
| Maryland: | 1.4% (13,947) |
| Dundalk: | 1.8% (111) |
| Maryland: | 1.8% (17,037) |
| Dundalk: | 1.6% (102) |
| Maryland: | 0.7% (7,124) |
| Dundalk: | 1.6% (98) |
| Maryland: | 4.6% (44,742) |
| Dundalk: | 1.6% (98) |
| Maryland: | 0.2% (2,063) |
Place of birth for U.S.-born residents:
- This state: 52,911
- Other state: 6,510
- Northeast: 2,987
- Midwest: 762
- South: 2,429
- West: 332
89.6% of Dundalk residents lived in the same house 1 years ago.
Out of people who lived in different houses, 37.0% lived in this county.
Out of people who lived in different counties, 67.7% lived in Maryland.
| Dundalk: | 89.6% |
| State average: | 88.5% |
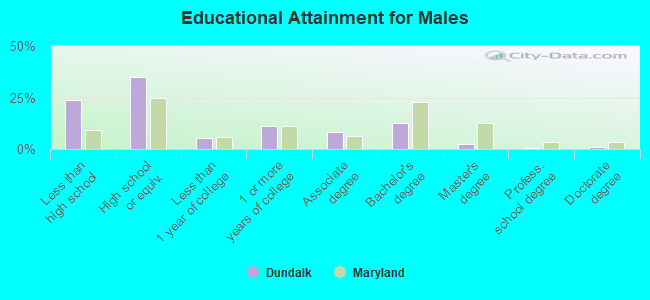
Education attainment for males 25 years and older:
- No schooling: 1,383
- Nursery to 4th grade: 0
- 5th and 6th grade: 0
- 7th and 8th grade: 599
- 9th grade: 1,057
- 10th grade: 418
- 11th grade: 570
- 12th grade, no diploma: 899
- High school graduate (or equivalency): 7,332
- Less than 1 year of college: 1,120
- Some college more than 1 year, no degree: 2,373
- Associate degree: 1,753
- Bachelor's degree: 2,625
- Master's degree: 462
- Professional school degree: 64
- Doctorate degree: 201
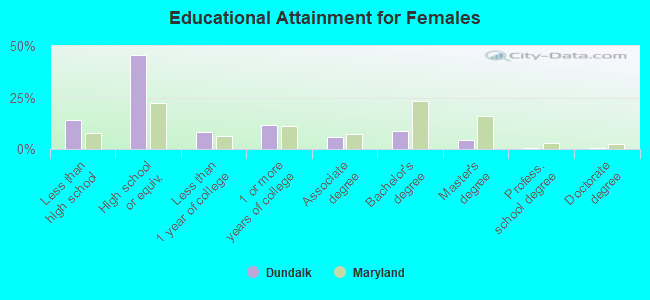
Education attainment for females 25 years and older:
- No schooling: 572
- Nursery to 4th grade: 0
- 5th and 6th grade: 251
- 7th and 8th grade: 237
- 9th grade: 722
- 10th grade: 538
- 11th grade: 494
- 12th grade, no diploma: 463
- High school graduate (or equivalency): 10,776
- Less than 1 year of college: 1,910
- Some college more than 1 year, no degree: 2,702
- Associate degree: 1,424
- Bachelor's degree: 2,076
- Master's degree: 1,045
- Professional school degree: 164
- Doctorate degree: 128
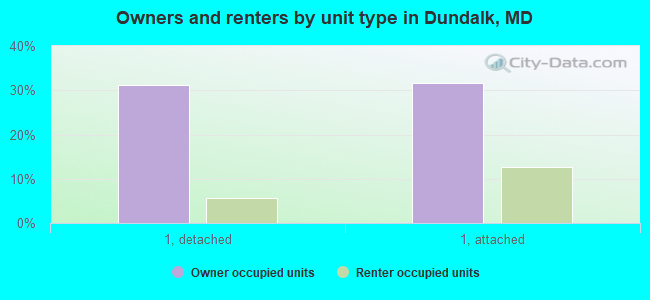
Housing units in structures:
- One, detached: 9,855
- One, attached: 13,064
- 3 or 4: 838
- 5 to 9: 866
- 10 to 19: 768
- 20 to 49: 158
- 50 or more: 806
- Mobile homes: 709
Median worth of mobile homes: $23,533
Housing units lacking complete kitchen facilities in 2022: 1.2%
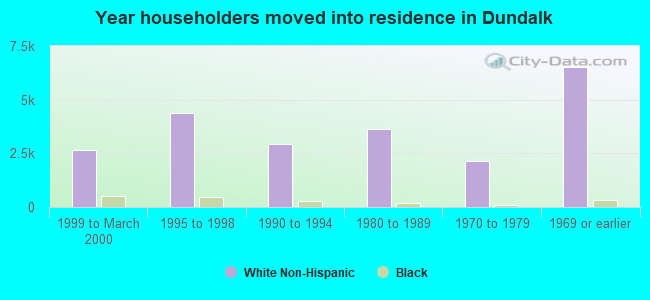
House/condo owner moved in on average 16 years ago
Renter moved in on average 3 years ago
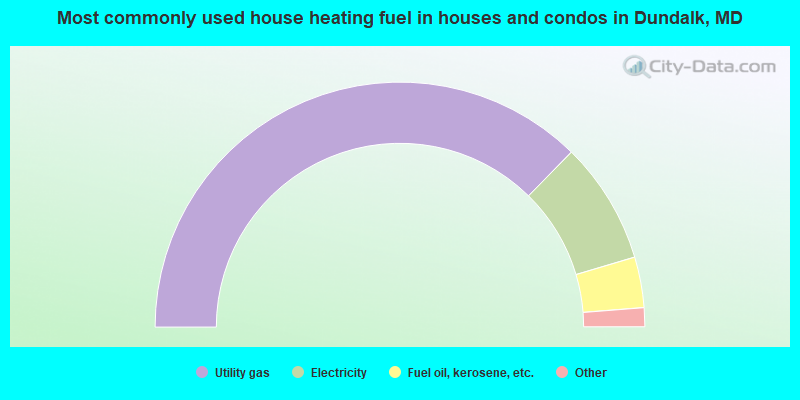
- 74.7%Utility gas
- 16.1%Electricity
- 6.7%Fuel oil, kerosene, etc.
- 1.5%Bottled, tank, or LP gas
- 0.6%Other fuel
- 0.3%No fuel used
- 0.2%Wood
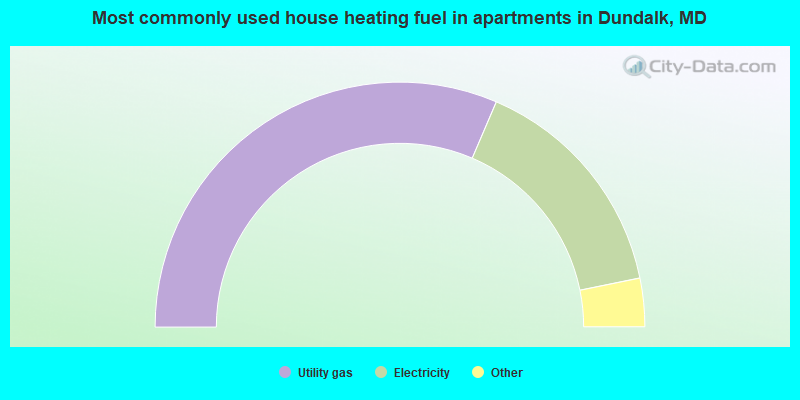
- 62.9%Utility gas
- 30.7%Electricity
- 2.5%Fuel oil, kerosene, etc.
- 1.7%Bottled, tank, or LP gas
- 1.6%No fuel used
- 0.4%Other fuel
- 0.2%Wood
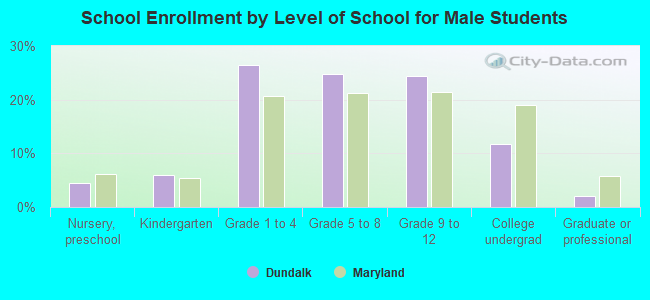
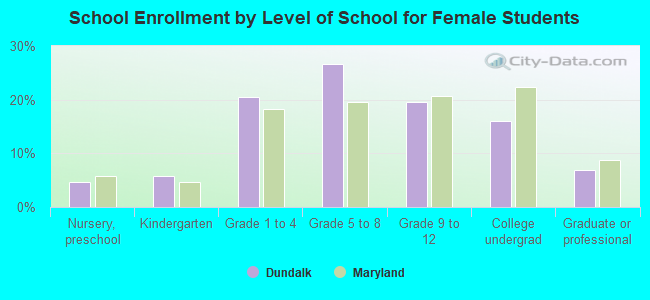
Private vs. public school enrollment:
| Here: | 6.9% |
| Maryland: | 15.2% |
| Here: | 7.6% |
| Maryland: | 14.4% |
| Here: | 14.0% |
| Maryland: | 20.2% |