East Greenwich, RI (Rhode Island) Houses and Residents
| East Greenwich: | $690,653 |
| Rhode Island: | $383,900 |
Total population: 13,146 (Urban population: 11,083, Rural population: 1,865 (27 farm, 1,838 nonfarm))
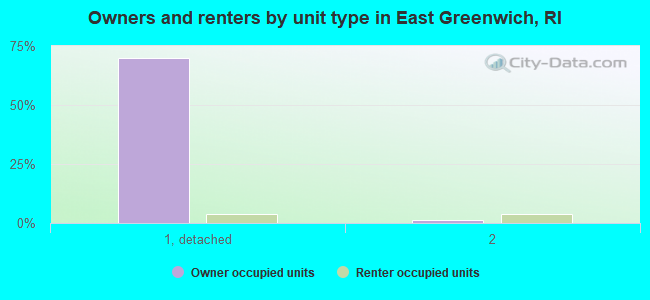
Houses: 5,226 (4,960 occupied: 3,771 owner occupied, 1,189 renter occupied)
| % of renters here: | 24% |
| State: | 37% |
Housing density: 315 houses/condos per square mile
Median price asked for vacant for-sale houses and condos in 2022 in this county: $227,012.
Median contract rent in 2022: $1,082 (lower quartile is $726, upper quartile is $1,433)
Median rent asked for vacant for-rent units in 2022: $1,062
Median gross rent in East Greenwich, RI in 2022: $1,171
Housing units in East Greenwich with a mortgage: 2,529 (272 second mortgage, 518 home equity loan, 14 both second mortgage and home equity loan)
Houses without a mortgage: 857
Compare current foreclosures near East Greenwich, RI:
| Photo | Address | Area | Beds / Baths | Price | Details |
|---|---|---|---|---|---|

|
#1
Howland Rd
East Greenwich, RI 02818
|
2,642 sq. feet
|
2 baths 2 beds |
show details | |

|
#2
S County Trl
East Greenwich, RI 02818
|
1,748 sq. feet
|
2 baths 2 beds |
show details | |

|
#3
Clemente Dr
East Greenwich, RI 02818
|
1,170 sq. feet
|
1 baths 3 beds |
show details | |

|
#4
Quaker Ln Apt 516
East Greenwich, RI 02818
|
- sq. feet
|
- baths - beds |
show details | |

|
#5
Whittier Ave
Providence, RI 02909
|
3 sq. feet
|
3 baths 6 beds |
$109,900
|
show details |

|
#6
Pequot Ave
Warwick, RI 02889
|
1,858 sq. feet
|
2 baths 3 beds |
$290,000
|
show details |

|
#7
Hallville Rd
Exeter, RI 02822
|
943 sq. feet
|
1 baths 2 beds |
$69,900
|
show details |

|
#8
Atwood Ave
Johnston, RI 02919
|
1,792 sq. feet
|
1 baths 4 beds |
show details | |

|
#9
Atwood Ave
Johnston, RI 02919
|
1,792 sq. feet
|
2 baths 4 beds |
show details | |

|
#10
Follett St
East Providence, RI 02914
|
1,584 sq. feet
|
2 baths 4 beds |
show details |
| Photo | Address | Area | Beds / Baths | Price | Details |
|---|---|---|---|---|---|

|
#11
Guertin St
West Warwick, RI 02893
|
1,338 sq. feet
|
2 baths 4 beds |
show details | |

|
#12
Detroit Ave
Warren, RI 02885
|
1,518 sq. feet
|
1 baths 3 beds |
show details | |

|
#13
Spooner Ave
Warwick, RI 02886
|
1,777 sq. feet
|
2 baths 4 beds |
show details | |

|
#14
Valley Green Court
Providence, RI 02904
|
1,440 sq. feet
|
3 baths 2 beds |
show details | |

|
#15
Boyds Ln
Portsmouth, RI 02871
|
1,144 sq. feet
|
1 baths 3 beds |
show details | |

|
#16
Chace Ave
Warren, RI 02885
|
1,224 sq. feet
|
1 baths 2 beds |
show details | |

|
#17
Knotty Oak Rd
Coventry, RI 02816
|
1,080 sq. feet
|
1 baths 2 beds |
show details | |

|
#18
Bracken St
Cranston, RI 02920
|
1,248 sq. feet
|
1 baths 4 beds |
show details | |

|
#19
Bishop Hill Rd
Johnston, RI 02919
|
1,248 sq. feet
|
1 baths 3 beds |
show details | |

|
#20
Blanding Ave
East Providence, RI 02914
|
1,165 sq. feet
|
1 baths 3 beds |
show details |
| Photo | Address | Area | Beds / Baths | Price | Details |
|---|---|---|---|---|---|

|
#21
Foster Center Rd
Foster, RI 02825
|
2,033 sq. feet
|
2 baths 3 beds |
show details | |

|
#22
Scranton Ave
Warwick, RI 02888
|
1,524 sq. feet
|
2 baths 3 beds |
show details | |

|
#23
Woburn St
Cranston, RI 02910
|
1,212 sq. feet
|
1 baths 4 beds |
show details | |

|
#24
Mayo Dr
Warren, RI 02885
|
1,739 sq. feet
|
1 baths 3 beds |
show details | |

|
#25
Pinnery Ave
Warwick, RI 02886
|
1,299 sq. feet
|
1 baths 3 beds |
show details | |

|
#26
Claremont Avenue A/k/a 5 Claremont Avenue
Bristol, RI 02809
|
1,852 sq. feet
|
2 baths 2 beds |
show details | |

|
#27
Hillwood St
Cranston, RI 02920
|
1,800 sq. feet
|
2 baths 4 beds |
show details | |

|
#28
What Cheer Ave
Providence, RI 02909
|
2,280 sq. feet
|
2 baths 3 beds |
show details | |

|
#29
Crestwood Dr
Hope Valley, RI 02832
|
1,320 sq. feet
|
2 baths 3 beds |
show details | |

|
#30
Wood St
Providence, RI 02909
|
2,839 sq. feet
|
3 baths 8 beds |
show details |
| Photo | Address | Area | Beds / Baths | Price | Details |
|---|---|---|---|---|---|

|
#31
Ridge St
Fall River, MA 02724
|
3,966 sq. feet
|
3 baths 9 beds |
show details | |

|
#32
Hicks Way
Foster, RI 02825
|
2,240 sq. feet
|
3 baths 4 beds |
show details | |

|
#33
Raymond Rd
North Providence, RI 02911
|
1,102 sq. feet
|
1 baths 2 beds |
show details | |

|
#34
Newcomb St
Providence, RI 02908
|
1,976 sq. feet
|
3 baths 4 beds |
show details | |

|
#35
Burnside Dr
Swansea, MA 02777
|
1,508 sq. feet
|
1 baths 3 beds |
show details | |

|
#36
Mount Fair Cir
Swansea, MA 02777
|
1,980 sq. feet
|
2 baths 3 beds |
show details | |

|
#37
Olney St
Seekonk, MA 02771
|
1,668 sq. feet
|
1 baths 4 beds |
show details | |

|
#38
Camden Ave
Providence, RI 02908
|
1,040 sq. feet
|
1 baths 3 beds |
show details | |

|
#39
Mulberry Dr
Wakefield, RI 02879
|
2,930 sq. feet
|
2 baths 3 beds |
show details | |

|
#40
Elmdale Ave
Johnston, RI 02919
|
1,897 sq. feet
|
2 baths 3 beds |
show details |
| Photo | Address | Area | Beds / Baths | Price | Details |
|---|---|---|---|---|---|

|
#41
Fairoaks Ave
Providence, RI 02908
|
1,986 sq. feet
|
2 baths 4 beds |
show details | |

|
#42
Woonasquatucket Ave
North Providence, RI 02911
|
1,479 sq. feet
|
2 baths 4 beds |
show details | |

|
#43
Frank Ave
West Kingston, RI 02892
|
3,029 sq. feet
|
2 baths 5 beds |
show details | |

|
#44
Douglas Ave
Providence, RI 02908
|
2,745 sq. feet
|
3 baths 6 beds |
show details | |

|
#45
Kispert Ct
Swansea, MA 02777
|
1,344 sq. feet
|
1 baths 3 beds |
show details | |

|
#46
Kispert Ct
Swansea, MA 02777
|
1,344 sq. feet
|
1 baths 3 beds |
show details | |

|
#47
Irons Ave
Johnston, RI 02919
|
1,552 sq. feet
|
2 baths 3 beds |
show details | |

|
#48
High St
Wakefield, RI 02879
|
2,400 sq. feet
|
3 baths 5 beds |
show details | |

|
#49
Olney Ave
North Providence, RI 02911
|
1,326 sq. feet
|
1 baths 2 beds |
show details | |

|
Check over 1 million property listings on Foreclosure.com!
|
browse all offers | |||

 | Crazy Rhode Island real estate market (525 replies) |
| Middleberry Condo Complex East Greenwich (7 replies) |
| Relocate to East Greenwich? (86 replies) |
| New Home Construction in East Greenwich/North Kingstown (9 replies) |
| Earning $50K not enough to affordably buy a home in RI! (41 replies) |
| Top Democrats Flock to One of Whitest and Most Affluent RI Communities (138 replies) |

Household type by relationship:
Households: 164,622- In family households: 134,056 (29,767 male householders, 13,980 female householders)
33,027 spouses, 45,492 children (42,195 natural, 1,247 adopted, 2,050 stepchildren), 2,725 grandchildren, 1,292 brothers or sisters, 1,670 parents, foster children, 1,312 other relatives, 3,703 non-relatives
- In nonfamily households: 30,566 (10,946 male householders (8,254 living alone)), 13,952 female householders (11,819 living alone)), 5,668 nonrelatives
- In group quarters: 1,536 (1,255 institutionalized population)
28,199 married couples with children.
7,812 single-parent households (1,777 men, 6,035 women).
93.5% of residents of East Greenwich speak English at home.
1.1% of residents speak Spanish at home (88% speak English very well, 4% speak English well, 3% speak English not well, 4% don't speak English at all).
3.6% of residents speak other Indo-European language at home (80% speak English very well, 16% speak English well, 3% speak English not well, 1% don't speak English at all).
1.3% of residents speak Asian or Pacific Island language at home (58% speak English very well, 34% speak English well, 7% speak English not well).
0.4% of residents speak other language at home (70% speak English very well, 30% speak English not well).
Foreign born population: 785 (5.9%)
(61.8% of them are naturalized citizens)
| Here: | 7.2 |
| State: | 6.2 |
| Here: | 3.5 |
| State: | 4.1 |
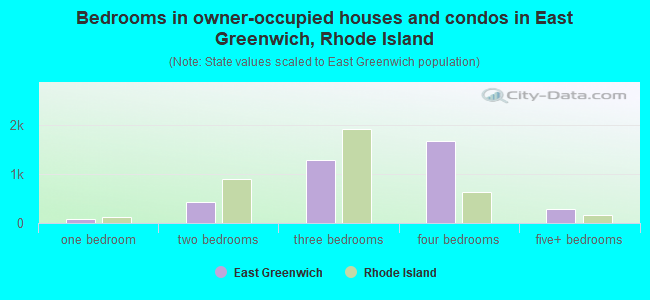
- Bedrooms in owner-occupied houses and condos in East Greenwich, Rhode Island
- 0no bedroom
- 771 bedroom
- 4322 bedrooms
- 1,2853 bedrooms
- 1,6844 bedrooms
- 2935+ bedrooms
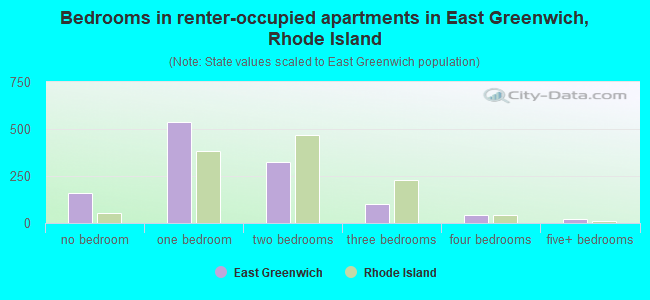
- Bedrooms in renter-occupied apartments in East Greenwich, Rhode Island
- 161no bedroom
- 5391 bedroom
- 3232 bedrooms
- 1003 bedrooms
- 454 bedrooms
- 215+ bedrooms
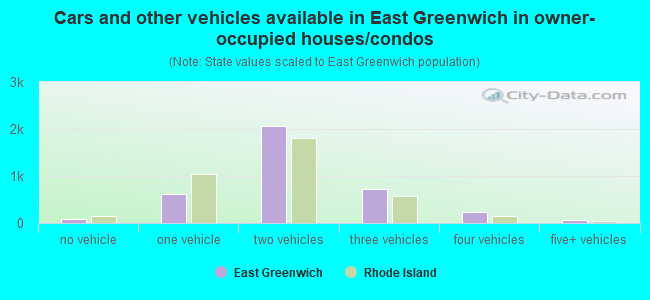
- Cars and other vehicles available in East Greenwich in owner-occupied houses/condos
- 76no vehicle
- 6221 vehicle
- 2,0672 vehicles
- 7203 vehicles
- 2294 vehicles
- 575+ vehicles
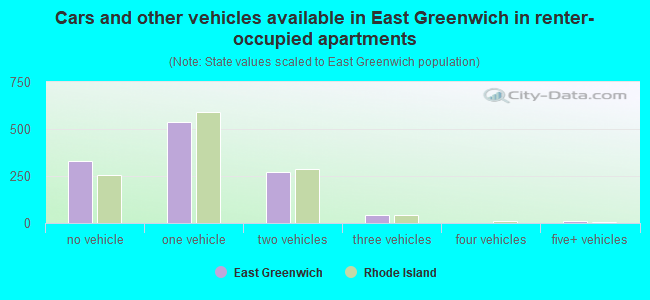
- Cars and other vehicles available in East Greenwich in renter-occupied apartments
- 331no vehicle
- 5361 vehicle
- 2722 vehicles
- 403 vehicles
- 04 vehicles
- 105+ vehicles
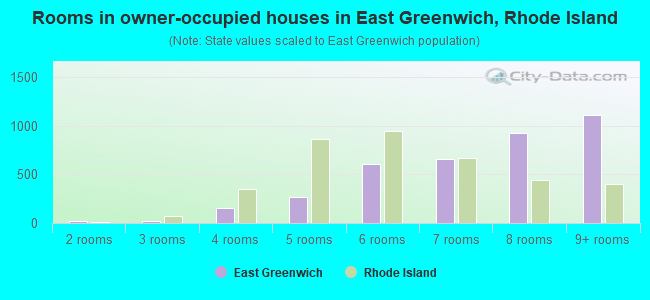
- Rooms in owner-occupied houses in East Greenwich, Rhode Island
- 01 room
- 182 rooms
- 243 rooms
- 1544 rooms
- 2695 rooms
- 6066 rooms
- 6647 rooms
- 9238 rooms
- 1,1139+ rooms
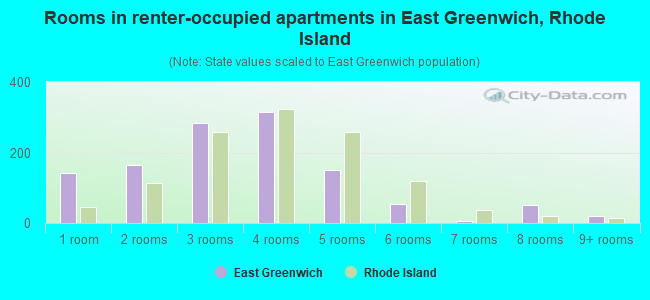
- Rooms in renter-occupied apartments in East Greenwich, Rhode Island
- 1431 room
- 1652 rooms
- 2853 rooms
- 3154 rooms
- 1495 rooms
- 536 rooms
- 77 rooms
- 518 rooms
- 219+ rooms
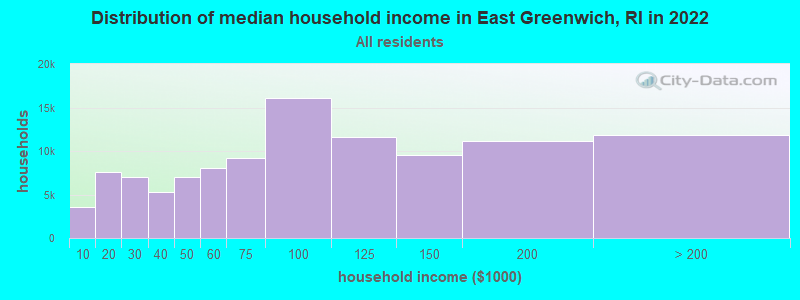
East Greenwich, RI household income distribution

- 3,511Less than $10,000
- 7,545$10,000 to $19,999
- 6,971$20,000 to $29,999
- 5,247$30,000 to $39,999
- 6,986$40,000 to $49,999
- 8,096$50,000 to $59,999
- 9,226$60,000 to $74,999
- 16,082$75,000 to $99,999
- 11,618$100,000 to $124,999
- 9,593$125,000 to $149,999
- 11,130$150,000 to $199,999
- 11,806$200,000 or more
Percentage of workers working in this county: 42.1%
Number of people working at home: 904 (13.4% of all workers)
Travel time to work (commute)
- Less than 5 minutes: 187
- 5 to 9 minutes: 541
- 10 to 14 minutes: 882
- 15 to 19 minutes: 941
- 20 to 24 minutes: 1,042
- 25 to 29 minutes: 607
- 30 to 34 minutes: 798
- 35 to 39 minutes: 127
- 40 to 44 minutes: 69
- 45 to 59 minutes: 214
- 60 to 89 minutes: 215
- 90 or more minutes: 122
Means of transportation to work:
- Drove a car alone: 5,214 (86.7%)
- Carpooled: 318 (5.3%)
- Bus or trolley bus: 63 (1.0%)
- Subway or elevated: 12 (0.2%)
- Railroad: 21 (0.3%)
- Motorcycle: 6 (0.1%)
- Bicycle: 7 (0.1%)
- Walked: 99 (1.6%)
- Other means: 5 (0.1%)
- Worked at home: 266 (4.4%)
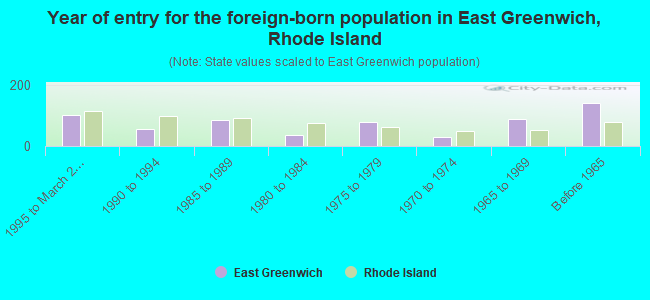
- Year of entry for the foreign-born population in East Greenwich, Rhode Island
- 1031995 to March 2000
- 571990 to 1994
- 851985 to 1989
- 351980 to 1984
- 801975 to 1979
- 311970 to 1974
- 881965 to 1969
- 140Before 1965
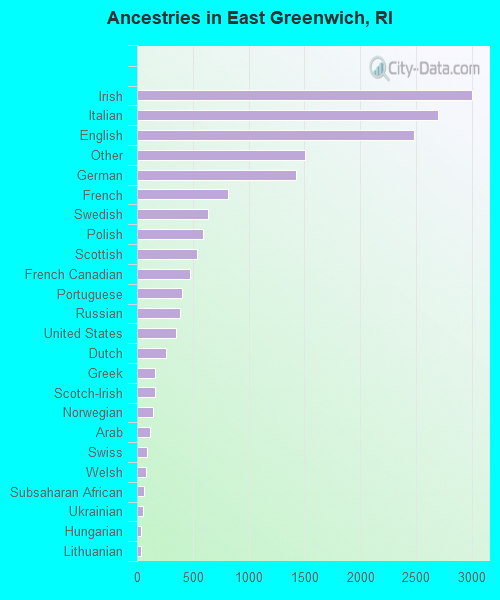
First ancestries reported:
- Irish: 3,004 (18.1%)
- Italian: 2,696 (16.3%)
- English: 2,484 (15.0%)
- Other: 1,509 (9.1%)
- German: 1,424 (8.6%)
- French: 812 (4.9%)
- Swedish: 635 (3.8%)
- Polish: 590 (3.6%)
- Scottish: 538 (3.2%)
- French Canadian: 471 (2.8%)
- Portuguese: 406 (2.5%)
- Russian: 387 (2.3%)
- United States: 352 (2.1%)
- Dutch: 262 (1.6%)
- Greek: 165 (1.0%)
- Scotch-Irish: 157 (0.9%)
- Norwegian: 147 (0.9%)
- Arab: 114 (0.7%)
- Swiss: 94 (0.6%)
- Welsh: 84 (0.5%)
- Subsaharan African: 60 (0.4%)
- Ukrainian: 55 (0.3%)
- Hungarian: 39 (0.2%)
- Lithuanian: 37 (0.2%)
- Danish: 25 (0.2%)
- West Indian: 15 (0.09%)
- Czech: 9 (0.05%)
Most common places of birth for foreign-born residents (%):
| East Greenwich: | 10.5% (65) |
| Rhode Island: | 2.6% (3,120) |
| East Greenwich: | 8.9% (55) |
| Rhode Island: | 3.8% (4,502) |
| East Greenwich: | 6.5% (40) |
| Rhode Island: | 1.7% (1,982) |
| East Greenwich: | 6.5% (40) |
| Rhode Island: | 1.2% (1,404) |
| East Greenwich: | 6.3% (39) |
| Rhode Island: | 0.5% (640) |
| East Greenwich: | 6.1% (38) |
| Rhode Island: | 0.4% (525) |
| East Greenwich: | 5.5% (34) |
| Rhode Island: | 3.4% (4,015) |
| East Greenwich: | 4.8% (30) |
| Rhode Island: | 0.9% (1,014) |
| East Greenwich: | 4.0% (25) |
| Rhode Island: | 0.2% (274) |
| East Greenwich: | 4.0% (25) |
| Rhode Island: | 0.7% (789) |
| East Greenwich: | 3.9% (24) |
| Rhode Island: | 0.3% (371) |
| East Greenwich: | 3.9% (24) |
| Rhode Island: | 0.5% (607) |
| East Greenwich: | 3.9% (24) |
| Rhode Island: | 1.6% (1,954) |
| East Greenwich: | 3.6% (22) |
| Rhode Island: | 0.5% (619) |
| East Greenwich: | 2.3% (14) |
| Rhode Island: | 13.7% (16,382) |
| East Greenwich: | 1.9% (12) |
| Rhode Island: | 17.6% (21,016) |
| East Greenwich: | 1.9% (12) |
| Rhode Island: | 0.1% (72) |
| East Greenwich: | 1.6% (10) |
| Rhode Island: | 1.6% (1,936) |
| East Greenwich: | 1.6% (10) |
| Rhode Island: | 0.1% (137) |
| East Greenwich: | 1.6% (10) |
| Rhode Island: | 1.1% (1,344) |
Place of birth for U.S.-born residents:
- This state: 7,178
- Other state: 5,048
- Northeast: 3,632
- Midwest: 579
- South: 554
- West: 283
62% of East Greenwich residents lived in the same house 5 years ago.
Out of people who lived in different houses, 37% lived in this county.
Out of people who lived in different counties, 45% lived in Rhode Island.
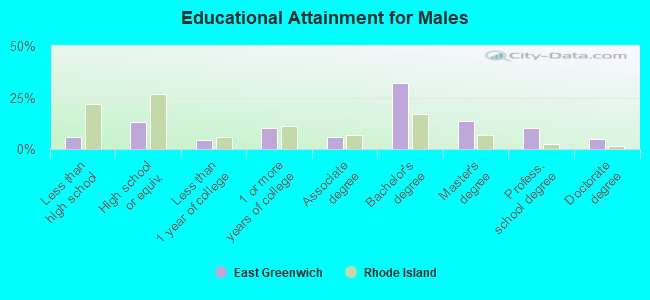
Education attainment for males 25 years and older:
- No schooling: 16
- Nursery to 4th grade: 0
- 5th and 6th grade: 11
- 7th and 8th grade: 13
- 9th grade: 62
- 10th grade: 69
- 11th grade: 21
- 12th grade, no diploma: 56
- High school graduate (or equivalency): 538
- Less than 1 year of college: 171
- Some college more than 1 year, no degree: 416
- Associate degree: 240
- Bachelor's degree: 1,310
- Master's degree: 567
- Professional school degree: 418
- Doctorate degree: 194
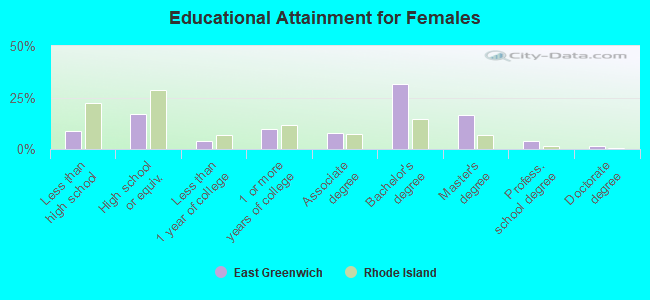
Education attainment for females 25 years and older:
- No schooling: 7
- Nursery to 4th grade: 6
- 5th and 6th grade: 34
- 7th and 8th grade: 38
- 9th grade: 80
- 10th grade: 71
- 11th grade: 76
- 12th grade, no diploma: 88
- High school graduate (or equivalency): 790
- Less than 1 year of college: 185
- Some college more than 1 year, no degree: 447
- Associate degree: 359
- Bachelor's degree: 1,462
- Master's degree: 756
- Professional school degree: 173
- Doctorate degree: 59
Housing units in structures:
- One, detached: 3,760
- One, attached: 97
- Two: 280
- 3 or 4: 176
- 5 to 9: 209
- 10 to 19: 59
- 20 to 49: 252
- 50 or more: 346
- Mobile homes: 47
Median worth of mobile homes: $129,241
Housing units lacking complete kitchen facilities: 1.9%
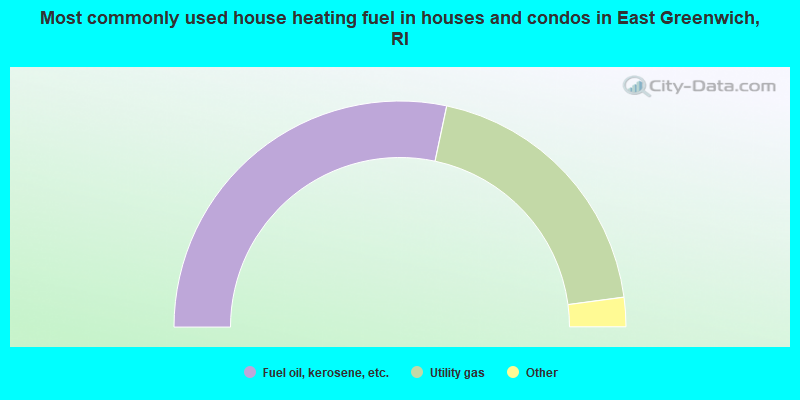
- 56.6%Fuel oil, kerosene, etc.
- 39.1%Utility gas
- 2.4%Electricity
- 0.9%Bottled, tank, or LP gas
- 0.6%Wood
- 0.2%Coal or coke
- 0.2%Solar energy
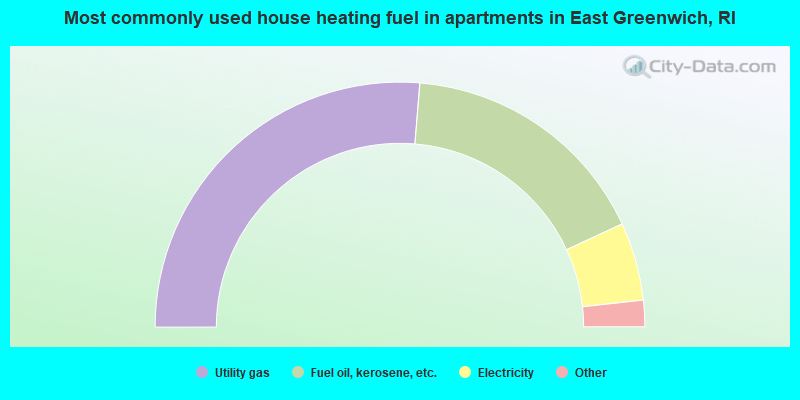
- 52.6%Utility gas
- 33.6%Fuel oil, kerosene, etc.
- 10.3%Electricity
- 1.9%Bottled, tank, or LP gas
- 1.7%Wood
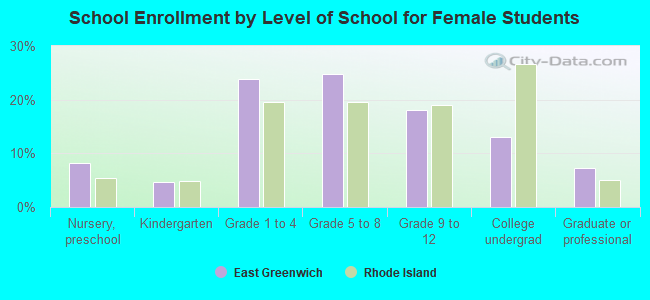
Private vs. public school enrollment:
| Here: | 12.3% |
| Rhode Island: | 12.6% |
| Here: | 13.5% |
| Rhode Island: | 12.7% |
| Here: | 34.4% |
| Rhode Island: | 43.8% |