East Hampton, CT (Connecticut) Houses and Residents
| East Hampton: | $328,537 |
| Connecticut: | $347,200 |
Total population: 2,691 (Urban population: 1,778 (all inside urban clusters), Rural population: 479 (all nonfarm))
Houses: 1,135 (1,030 occupied: 946 owner occupied, 95 renter occupied)
| % of renters here: | 9% |
| State: | 34% |
Housing density: 445 houses/condos per square mile
Median price asked for vacant for-sale houses and condos in 2022 in this county: $431,754.
Median contract rent in 2022: $1,143 (lower quartile is $724, upper quartile is $1,432)
Median rent asked for vacant for-rent units in 2022: $1,273
Median gross rent in East Hampton, CT in 2022: $1,204
Housing units in East Hampton with a mortgage: 711 (62 second mortgage, 0 home equity loan, 43 both second mortgage and home equity loan)
Houses without a mortgage: 54
Median household income for houses/condos with a mortgage: $125,989
Median household income for apartments without a mortgage: $110,915
Median monthly housing costs: $1,768
Compare current foreclosures near East Hampton, CT:
| Photo | Address | Area | Beds / Baths | Price | Details |
|---|---|---|---|---|---|

|
#1
Hayes Rd
East Hampton, CT 06424
|
1,152 sq. feet
|
1 baths 3 beds |
show details | |

|
#2
Mohigan Trl
East Hampton, CT 06424
|
864 sq. feet
|
1 baths 3 beds |
show details | |

|
#3
N Main St Unit 32
East Hampton, CT 06424
|
1,040 sq. feet
|
1 baths 2 beds |
show details | |

|
#4
Abbey Rd
East Hampton, CT 06424
|
2,541 sq. feet
|
2 baths 3 beds |
show details | |

|
#5
Old Young St
East Hampton, CT 06424
|
1,216 sq. feet
|
1 baths 3 beds |
show details | |

|
#6
Willis Ave
Meriden, CT 06450
|
1,008 sq. feet
|
1 baths 2 beds |
$299,900
|
show details |

|
#7
Roosevelt St
New Britain, CT 06051
|
1,536 sq. feet
|
2 baths 3 beds |
$299,900
|
show details |

|
#8
Peck St
Berlin, CT 06037
|
608 sq. feet
|
1 baths 1 beds |
$144,900
|
show details |

|
#9
Railroad Ave
Chester, CT 06412
|
2,092 sq. feet
|
2 baths 4 beds |
$484,900
|
show details |

|
#10
Winthrop Blvd
Cromwell, CT 06416
|
1,092 sq. feet
|
1 baths 3 beds |
$220,000
|
show details |
| Photo | Address | Area | Beds / Baths | Price | Details |
|---|---|---|---|---|---|

|
#11
Irving St
Manchester, CT 06042
|
1,335 sq. feet
|
2 baths 3 beds |
$251,750
|
show details |

|
#12
Shares Ln
South Windsor, CT 06074
|
1,850 sq. feet
|
2 baths 4 beds |
$365,000
|
show details |

|
#13
Lake Dr E
Oakdale, CT 06370
|
1,346 sq. feet
|
1 baths 3 beds |
$349,900
|
show details |

|
#14
Pleasant St
Willimantic, CT 06226
|
2,836 sq. feet
|
3 baths 6 beds |
show details | |

|
#15
Orient St
Meriden, CT 06450
|
1,780 sq. feet
|
3 baths 3 beds |
show details | |

|
#16
Mount Parnassus Rd
East Haddam, CT 06423
|
2,328 sq. feet
|
3 baths 3 beds |
show details | |

|
#17
Bell Ct Apt C1
East Hartford, CT 06108
|
890 sq. feet
|
1 baths 2 beds |
show details | |

|
#18
Stanley St
New Britain, CT 06051
|
1,890 sq. feet
|
1 baths 3 beds |
show details | |

|
#19
Llynwood Dr
Bolton, CT 06043
|
1,335 sq. feet
|
1 baths 4 beds |
show details | |

|
#20
Amity St
Meriden, CT 06450
|
1,568 sq. feet
|
2 baths 3 beds |
show details |
| Photo | Address | Area | Beds / Baths | Price | Details |
|---|---|---|---|---|---|

|
#21
City Ave
New Britain, CT 06051
|
1,932 sq. feet
|
1 baths 3 beds |
show details | |

|
#22
Butternut Ln
Rocky Hill, CT 06067
|
1,176 sq. feet
|
1 baths 2 beds |
show details | |

|
#23
21 Webster St
New Britain, CT 06051
|
3 sq. feet
|
2 baths 6 beds |
show details | |

|
#24
Florida Rd
East Haddam, CT 06423
|
1,734 sq. feet
|
2 baths 3 beds |
show details | |

|
#25
New London Rd
Colchester, CT 06415
|
1,938 sq. feet
|
3 baths 3 beds |
show details | |

|
#26
Broadview Ter
Hartford, CT 06106
|
1,821 sq. feet
|
2 baths 7 beds |
show details | |

|
#27
Middletown Ave
Wethersfield, CT 06109
|
1,372 sq. feet
|
1 baths 4 beds |
show details | |

|
#28
Greenwood Dr
Manchester, CT 06042
|
750 sq. feet
|
1 baths 2 beds |
show details | |

|
#29
Pratt St
Meriden, CT 06450
|
1,040 sq. feet
|
2 baths 3 beds |
show details | |

|
#30
Summer St
Manchester, CT 06040
|
2,418 sq. feet
|
2 baths 6 beds |
show details |
| Photo | Address | Area | Beds / Baths | Price | Details |
|---|---|---|---|---|---|

|
#31
Fawn Dr
Meriden, CT 06451
|
1,766 sq. feet
|
2 baths 4 beds |
show details | |

|
#32
Pond St
New Britain, CT 06051
|
2,400 sq. feet
|
2 baths 6 beds |
show details | |

|
#33
Cheshire St
Hartford, CT 06114
|
3,279 sq. feet
|
2 baths 4 beds |
show details | |

|
#34
Hidden Valley Dr
Meriden, CT 06451
|
2,264 sq. feet
|
2 baths 4 beds |
show details | |

|
#35
Spring St
Meriden, CT 06451
|
660 sq. feet
|
1 baths 3 beds |
show details | |

|
#36
Jones Hollow Rd
Marlborough, CT 06447
|
1,984 sq. feet
|
2 baths 3 beds |
show details | |

|
#37
Park Rd
Marlborough, CT 06447
|
1,134 sq. feet
|
1 baths 3 beds |
show details | |

|
#38
Hope Valley Rd
Amston, CT 06231
|
2,128 sq. feet
|
2 baths 3 beds |
show details | |

|
#39
Robbins Ave
Newington, CT 06111
|
1,346 sq. feet
|
2 baths 3 beds |
show details | |

|
#40
Thompson Rd # 2g
Manchester, CT 06040
|
734 sq. feet
|
1 baths 1 beds |
show details |
| Photo | Address | Area | Beds / Baths | Price | Details |
|---|---|---|---|---|---|

|
#41
Richard St Apt 2
Newington, CT 06111
|
710 sq. feet
|
1 baths 1 beds |
show details | |

|
#42
Linnmoore St
Hartford, CT 06114
|
2,406 sq. feet
|
2 baths 6 beds |
show details | |

|
#43
Whispering Brook Rd
Berlin, CT 06037
|
1,939 sq. feet
|
3 baths 4 beds |
show details | |

|
#44
Woodland St
Manchester, CT 06042
|
1,888 sq. feet
|
2 baths 5 beds |
show details | |

|
#45
Higbie Dr
East Hartford, CT 06108
|
1,081 sq. feet
|
2 baths 2 beds |
show details | |

|
#46
Thompson 2g
Manchester, CT 06040
|
734 sq. feet
|
1 baths 1 beds |
show details | |

|
#47
Lowe Ave
Meriden, CT 06450
|
1,392 sq. feet
|
2 baths 3 beds |
show details | |

|
#48
Haddam St
Hartford, CT 06106
|
900 sq. feet
|
1 baths 2 beds |
show details | |

|
#49
8th St
Newington, CT 06111
|
792 sq. feet
|
1 baths 3 beds |
show details | |

|
Check over 1 million property listings on Foreclosure.com!
|
browse all offers | |||


 | Lake house/ bungalow communities (15 replies) |
| 2024 Connecticut Town Tournament VI (Celebrating the 10-Year Anniversary & Dazzleman's Memorial) (1044 replies) |
| Connecticut TOWN TOURNAMENT V (2022) (831 replies) |
| Lakefront home near Plainfield (17 replies) |
| Looking to buy my first home, recommended towns? (30 replies) |
| "Make It Here" CT Marketing Branding (19 replies) |

Median year apartment built: 1974
Household type by relationship:
Households: 2,956- Male householders: 589 (51 living alone), Female householders: 439 (102 living alone)
725 spouses (725 opposite-sex spouses), 22 unmarried partners, (22 opposite-sex unmarried partners), 908 children (843 natural, 22 adopted, 43 stepchildren), 68 grandchildren, 10 brothers or sisters, 73 parents, 0 foster children, 9 other relatives, 68 non-relatives
- In group quarters: 41
Size of family households: 275 2-persons, 280 3-persons, 234 4-persons, 13 5-persons, 4 6-persons, 24 7-or-more-persons.
Size of nonfamily households: 162 1-person, 28 2-persons, 6 3-persons.
563 married couples with children.
48 single-parent households (28 men, 20 women).
94.8% of residents of East Hampton speak English at home.
1.7% of residents speak Spanish at home (82% speak English very well, 18% speak English well).
2.9% of residents speak other Indo-European language at home (65% speak English very well, 24% speak English well, 11% speak English not well).
Foreign born population: 100 (3.4%)
(76.0% of them are naturalized citizens)
| Here: | 6.8 |
| State: | 6.5 |
| Here: | 7.2 |
| State: | 4.0 |

- Bedrooms in owner-occupied houses and condos in East Hampton, Connecticut
- 0no bedroom
- 01 bedroom
- 752 bedrooms
- 5963 bedrooms
- 2764 bedrooms
- 05+ bedrooms

- Bedrooms in renter-occupied apartments in East Hampton, Connecticut
- 10no bedroom
- 11 bedroom
- 192 bedrooms
- 323 bedrooms
- 224 bedrooms
- 115+ bedrooms

- Cars and other vehicles available in East Hampton in owner-occupied houses/condos
- 13no vehicle
- 1181 vehicle
- 3782 vehicles
- 2893 vehicles
- 814 vehicles
- 675+ vehicles

- Cars and other vehicles available in East Hampton in renter-occupied apartments
- 0no vehicle
- 381 vehicle
- 222 vehicles
- 93 vehicles
- 114 vehicles
- 155+ vehicles

- Rooms in owner-occupied houses in East Hampton, Connecticut
- 01 room
- 02 rooms
- 83 rooms
- 364 rooms
- 815 rooms
- 2866 rooms
- 2177 rooms
- 1488 rooms
- 1719+ rooms

- Rooms in renter-occupied apartments in East Hampton, Connecticut
- 101 room
- 02 rooms
- 13 rooms
- 94 rooms
- 05 rooms
- 96 rooms
- 217 rooms
- 188 rooms
- 269+ rooms


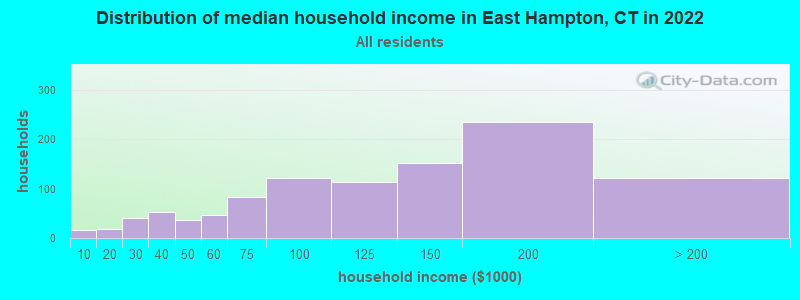
East Hampton, CT household income distribution

- 16Less than $10,000
- 18$10,000 to $19,999
- 41$20,000 to $29,999
- 52$30,000 to $39,999
- 36$40,000 to $49,999
- 46$50,000 to $59,999
- 84$60,000 to $74,999
- 121$75,000 to $99,999
- 113$100,000 to $124,999
- 152$125,000 to $149,999
- 235$150,000 to $199,999
- 122$200,000 or more
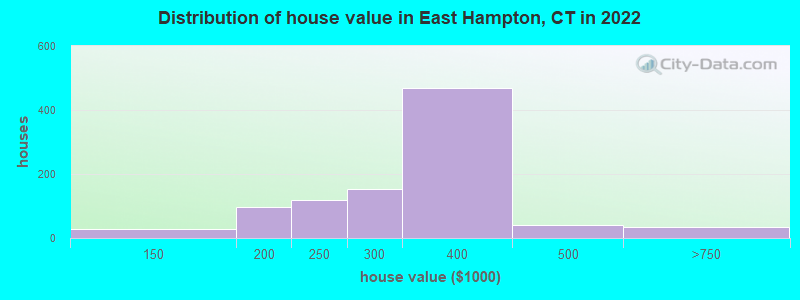
Home value of owner - occupied houses in 2022 in East Hampton, CT
-
- 23$100,000 to $124,999
- 5$125,000 to $149,999
- 74$150,000 to $174,999
- 22$175,000 to $199,999
- 118$200,000 to $249,999
- 153$250,000 to $299,999
- 469$300,000 to $399,999
- 41$400,000 to $499,999
- 35$500,000 to $749,999
Rent paid by renters in 2022 in East Hampton, CT
-
- 12$150 to $199
- 1$600 to $649
- 9$700 to $749
- 27$1,000 to $1,249
- 10$1,250 to $1,499
- 13$2,000 to $2,499
- 24No cash rent


Percentage of workers working in this county: 60.9%
Number of people working at home: 76 (5.2% of all workers)
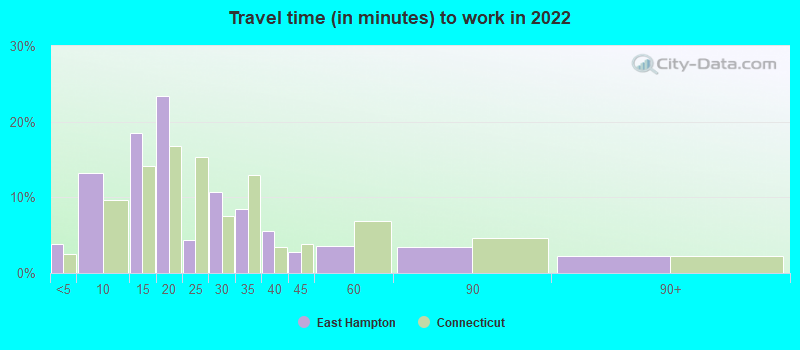
Travel time to work (commute)
- Less than 5 minutes: 29
- 5 to 9 minutes: 79
- 10 to 14 minutes: 76
- 15 to 19 minutes: 69
- 20 to 24 minutes: 147
- 25 to 29 minutes: 174
- 30 to 34 minutes: 146
- 35 to 39 minutes: 235
- 40 to 44 minutes: 160
- 45 to 59 minutes: 111
- 60 to 89 minutes: 90
- 90 or more minutes: 43
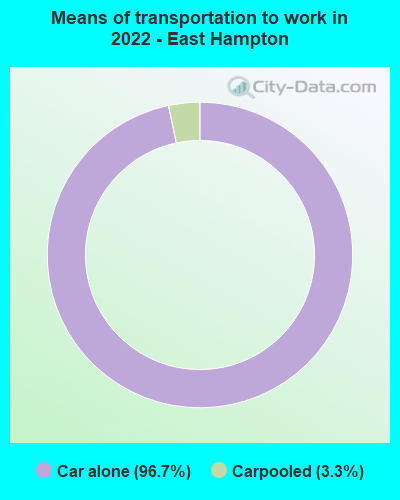
Means of transportation to work:
- Drove a car alone: 755 (85.6%)
- Carpooled: 27 (3.1%)
- Worked at home: 76 (8.6%)

- Unemployment by race in 2022
- Unemployment rate for White non-Hispanic residents
- 2.9%Males
- Unemployment rate for two or more race residents
- 100.0%Males
- Unemployment rate for Hispanic or Latino residents
- 59.2%Males
- 26.3%Females

- Year of entry for the foreign-born population in East Hampton, Connecticut
- 02010 or later
- 342000 to 2009
- 101990 to 1999
- 151980 to 1989
- 71970 to 1979
- 67Before 1970

First ancestries reported:
- European: 319 (21.1%)
- French Canadian: 292 (19.3%)
- Irish: 238 (15.8%)
- English: 123 (8.1%)
- American: 122 (8.1%)
- Polish: 119 (7.9%)
- Italian: 69 (4.6%)
- Swedish: 41 (2.7%)
- German: 29 (1.9%)
- Russian: 16 (1.1%)
- Portuguese: 13 (0.9%)
- Canadian: 10 (0.7%)
- Czech: 8 (0.5%)
- Scotch-Irish: 7 (0.5%)
- French: 6 (0.4%)
- Eastern European: 4 (0.3%)
- Dutch: 3 (0.2%)
Most common places of birth for foreign-born residents (%):
| East Hampton: | 52.0% (52) |
| Connecticut: | 4.0% (21,729) |
| East Hampton: | 35.0% (35) |
| Connecticut: | 2.3% (12,380) |
Place of birth for U.S.-born residents:
- This state: 2,151
- Other state: 633
- Northeast: 406
- Midwest: 119
- South: 37
- West: 74
94.9% of East Hampton residents lived in the same house 1 years ago.
Out of people who lived in different houses, 39.2% lived in this county.
Out of people who lived in different counties, 41.9% lived in Connecticut.
| East Hampton: | 94.9% |
| State average: | 88.4% |
Education attainment for males 25 years and older:
- No schooling: 0
- Nursery to 4th grade: 0
- 5th and 6th grade: 0
- 7th and 8th grade: 0
- 9th grade: 7
- 10th grade: 0
- 11th grade: 19
- 12th grade, no diploma: 7
- High school graduate (or equivalency): 184
- Less than 1 year of college: 180
- Some college more than 1 year, no degree: 175
- Associate degree: 67
- Bachelor's degree: 273
- Master's degree: 80
- Professional school degree: 9
- Doctorate degree: 8

Education attainment for females 25 years and older:
- No schooling: 13
- Nursery to 4th grade: 0
- 5th and 6th grade: 0
- 7th and 8th grade: 0
- 9th grade: 0
- 10th grade: 0
- 11th grade: 20
- 12th grade, no diploma: 65
- High school graduate (or equivalency): 246
- Less than 1 year of college: 49
- Some college more than 1 year, no degree: 103
- Associate degree: 153
- Bachelor's degree: 213
- Master's degree: 165
- Professional school degree: 0
- Doctorate degree: 24


Housing units in structures:
- One, detached: 1,028
- One, attached: 19
- Two: 65
- 3 or 4: 11
- 5 to 9: 10
- Boats, RVs, vans, etc.: 1
Housing units lacking complete kitchen facilities in 2022: 3.6%
House/condo owner moved in on average 12 years ago
Renter moved in on average 8 years ago

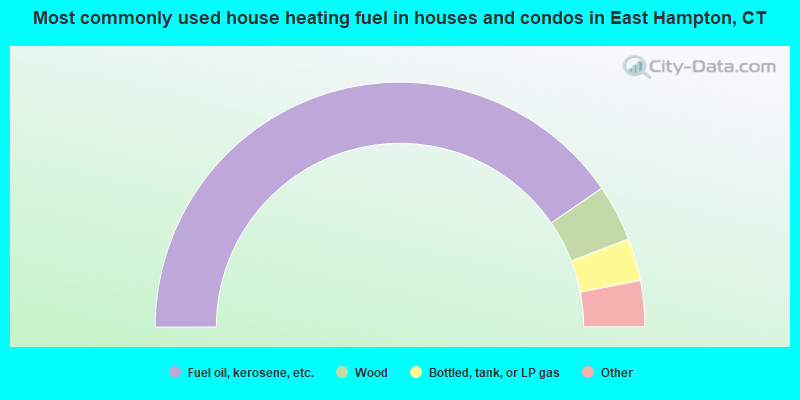
- 81.0%Fuel oil, kerosene, etc.
- 7.5%Wood
- 5.6%Bottled, tank, or LP gas
- 3.4%Electricity
- 1.4%Solar energy
- 1.1%Utility gas
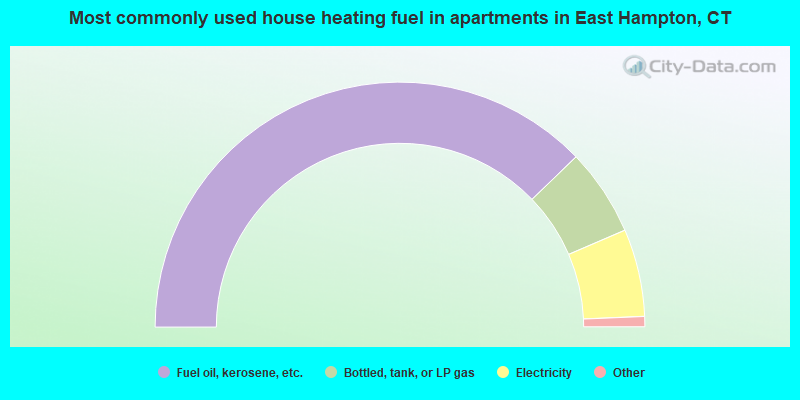
- 76.6%Fuel oil, kerosene, etc.
- 11.7%Bottled, tank, or LP gas
- 11.7%Electricity
Private vs. public school enrollment:
| Here: | 10.5% |
| Connecticut: | 9.5% |
| Here: | 3.6% |
| Connecticut: | 12.9% |
| Here: | 8.1% |
| Connecticut: | 35.5% |


