East Millcreek, UT (Utah) Houses and Residents
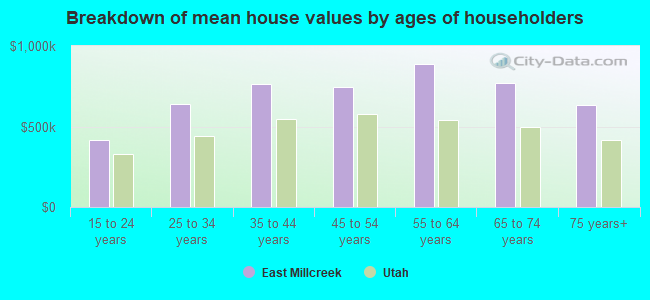
| East Millcreek: | $714,865 |
| Utah: | $499,500 |
Total population: 23,790 (Urban population: 21,401, Rural population: 0)
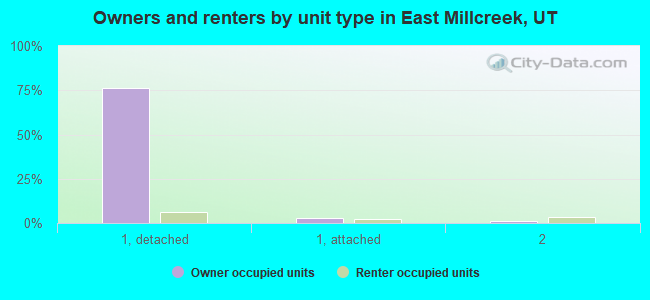
Houses: 7,690 (7,454 occupied: 6,108 owner occupied, 1,346 renter occupied)
| % of renters here: | 18% |
| State: | 29% |
Housing density: 1,727 houses/condos per square mile
Median price asked for vacant for-sale houses and condos in 2022 in this county: $719,617.
Median contract rent in 2022: $1,343 (lower quartile is $1,034, upper quartile is $1,870)
Median rent asked for vacant for-rent units in 2022: $1,334
Median gross rent in East Millcreek, UT in 2022: $1,458
Housing units in East Millcreek with a mortgage: 3,198 (405 second mortgage, 419 home equity loan, 14 both second mortgage and home equity loan)
Houses without a mortgage: 2,392
Compare current foreclosures near East Millcreek, UT:
| Photo | Address | Area | Beds / Baths | Price | Details |
|---|---|---|---|---|---|

|
#1
E Downington Ave
Salt Lake City, UT 84108
|
2,580 sq. feet
|
2 baths 1 beds |
$949,900
|
show details |

|
#2
S Holladay Cir
Salt Lake City, UT 84117
|
2,440 sq. feet
|
2 baths 4 beds |
$799,900
|
show details |

|
#3
Mankato St
Herriman, UT 84096
|
1,468 sq. feet
|
2 baths 3 beds |
show details | |

|
#4
Ashley Ridge Rd
Sandy, UT 84092
|
2,661 sq. feet
|
2 baths 6 beds |
show details | |

|
#5
W Mason Way
Magna, UT 84044
|
932 sq. feet
|
2 baths 4 beds |
show details | |

|
#6
W Patriot Cir
Magna, UT 84044
|
912 sq. feet
|
1 baths 2 beds |
show details | |

|
#7
W Alta View Way
Sandy, UT 84070
|
1,440 sq. feet
|
2 baths 3 beds |
show details | |

|
#8
W 5780 S
Salt Lake City, UT 84129
|
1,100 sq. feet
|
1 baths 1 beds |
show details | |

|
#9
W Heath Ave
Salt Lake City, UT 84118
|
979 sq. feet
|
1 baths 5 beds |
show details | |

|
#10
W 6785 S
West Jordan, UT 84084
|
1,516 sq. feet
|
3 baths 4 beds |
show details |
| Photo | Address | Area | Beds / Baths | Price | Details |
|---|---|---|---|---|---|

|
#11
S Interlochin Ln
West Jordan, UT 84084
|
2,054 sq. feet
|
2 baths 3 beds |
show details | |

|
#12
W 300 S
Salt Lake City, UT 84104
|
1,313 sq. feet
|
1 baths 3 beds |
show details | |

|
#13
N Fairway Dr
North Salt Lake, UT 84054
|
2,929 sq. feet
|
3 baths 4 beds |
show details | |

|
#14
S 4340 W
Salt Lake City, UT 84118
|
1,176 sq. feet
|
2 baths 3 beds |
show details | |

|
#15
S Solano Cir
Salt Lake City, UT 84120
|
1,009 sq. feet
|
2 baths 5 beds |
show details | |

|
#16
S Meadowlark Ln
West Jordan, UT 84088
|
1,748 sq. feet
|
2 baths 3 beds |
show details | |

|
#17
W Aspen Springs Dr
Herriman, UT 84096
|
1,334 sq. feet
|
2 baths 2 beds |
show details | |

|
#18
W 3800 S
Salt Lake City, UT 84119
|
2,050 sq. feet
|
2 baths 3 beds |
show details | |

|
#19
S Sorrento Way
West Jordan, UT 84081
|
1,332 sq. feet
|
2 baths 4 beds |
show details | |

|
#20
W 3500 S Ste 5040w
Salt Lake City, UT 84119
|
736 sq. feet
|
2 baths 3 beds |
show details |
| Photo | Address | Area | Beds / Baths | Price | Details |
|---|---|---|---|---|---|

|
#21
S Cascade Way
Salt Lake City, UT 84109
|
1,185 sq. feet
|
1 baths 5 beds |
show details | |

|
#22
E Wilson Ave
Salt Lake City, UT 84105
|
950 sq. feet
|
1 baths 3 beds |
show details | |

|
#23
S Bree St
Salt Lake City, UT 84129
|
2,469 sq. feet
|
4 baths 5 beds |
show details | |

|
#24
N New Star Dr
Salt Lake City, UT 84116
|
1,931 sq. feet
|
2 baths 4 beds |
show details | |

|
#25
S De Mass Dr
Salt Lake City, UT 84128
|
728 sq. feet
|
2 baths 3 beds |
show details | |

|
#26
E Elise St
Sandy, UT 84070
|
1,354 sq. feet
|
2 baths 2 beds |
show details | |

|
#27
S 2345 W
West Jordan, UT 84084
|
1,600 sq. feet
|
2 baths 3 beds |
show details | |

|
#28
S Ridgecrest Dr
Salt Lake City, UT 84129
|
1,439 sq. feet
|
2 baths 4 beds |
show details | |

|
#29
E 9670 S
Sandy, UT 84070
|
1,756 sq. feet
|
2 baths 4 beds |
show details | |

|
#30
E 9670 S
Sandy, UT 84070
|
2,177 sq. feet
|
1 baths 4 beds |
show details |
| Photo | Address | Area | Beds / Baths | Price | Details |
|---|---|---|---|---|---|

|
#31
S 3720 W
Salt Lake City, UT 84120
|
1,144 sq. feet
|
1 baths 3 beds |
show details | |

|
#32
W 5775 S
Salt Lake City, UT 84129
|
1,017 sq. feet
|
1 baths 3 beds |
show details | |

|
#33
S 6935 W
Salt Lake City, UT 84128
|
1,842 sq. feet
|
1 baths 4 beds |
show details | |

|
#34
W River Hills Dr
Riverton, UT 84065
|
3,080 sq. feet
|
2 baths 5 beds |
show details | |

|
#35
S Mirkwood Ln
Salt Lake City, UT 84129
|
1,826 sq. feet
|
3 baths 5 beds |
show details | |

|
#36
W 5700 S
Salt Lake City, UT 84129
|
1,764 sq. feet
|
2 baths 3 beds |
show details | |

|
#37
W 4960 S
Salt Lake City, UT 84118
|
1,282 sq. feet
|
1 baths 4 beds |
show details | |

|
#38
W Spruce Leaf Cir
South Jordan, UT 84095
|
2,634 sq. feet
|
2 baths 4 beds |
show details | |

|
#39
W 5700 S
Salt Lake City, UT 84129
|
1,091 sq. feet
|
1 baths 2 beds |
show details | |

|
#40
E Glacier View Dr
Sandy, UT 84092
|
3,139 sq. feet
|
4 baths 5 beds |
show details |
| Photo | Address | Area | Beds / Baths | Price | Details |
|---|---|---|---|---|---|

|
#41
S 3600 W
Salt Lake City, UT 84129
|
1,640 sq. feet
|
3 baths 4 beds |
show details | |

|
#42
S Sego Lily Dr
Sandy, UT 84094
|
2,645 sq. feet
|
1 baths 5 beds |
show details | |

|
#43
S 3340 W
Salt Lake City, UT 84129
|
1,240 sq. feet
|
3 baths 3 beds |
show details | |

|
#44
S Cortney Dr
Salt Lake City, UT 84120
|
1,164 sq. feet
|
1 baths 3 beds |
show details | |

|
#45
E Kristin Dr
Sandy, UT 84070
|
2,268 sq. feet
|
4 baths 5 beds |
show details | |

|
#46
River Ridge Dr
West Jordan, UT 84088
|
1,221 sq. feet
|
1 baths 3 beds |
show details | |

|
#47
E Sego Lily Dr
Sandy, UT 84070
|
1,648 sq. feet
|
2 baths 3 beds |
show details | |

|
#48
E 10260 S
Sandy, UT 84092
|
3,086 sq. feet
|
3 baths 5 beds |
show details | |

|
#49
Westfield Cir
West Jordan, UT 84084
|
1,032 sq. feet
|
1 baths 3 beds |
show details | |

|
Check over 1 million property listings on Foreclosure.com!
|
browse all offers | |||

 | Confused about apartments (13 replies) |
| Good areas with new construction homes? (10 replies) |
| Looking for a neighborhood in SLC suburbs (14 replies) |
| Would I like Salt Lake City? (nerd, nature, rent) (11 replies) |
| Which neighborhoods to tour before a potential move (33 replies) |
| Relocating to SLC in late fall (9 replies) |
Household type by relationship:
Households: 1,015,649- In family households: 879,880 (178,461 male householders, 64,165 female householders)
187,678 spouses, 347,268 children (321,676 natural, 9,572 adopted, 16,020 stepchildren), 25,511 grandchildren, 12,209 brothers or sisters, 7,940 parents, foster children, 18,887 other relatives, 27,608 non-relatives
- In nonfamily households: 135,769 (49,607 male householders (35,052 living alone)), 50,389 female householders (40,012 living alone)), 35,773 nonrelatives
- In group quarters: 14,006 (9,420 institutionalized population)
205,311 married couples with children.
43,285 single-parent households (10,357 men, 32,928 women).
90.7% of residents of East Millcreek speak English at home.
2.6% of residents speak Spanish at home (66% speak English very well, 21% speak English well, 12% speak English not well, 2% don't speak English at all).
4.6% of residents speak other Indo-European language at home (81% speak English very well, 15% speak English well, 3% speak English not well, 1% don't speak English at all).
1.9% of residents speak Asian or Pacific Island language at home (75% speak English very well, 16% speak English well, 9% speak English not well).
0.2% of residents speak other language at home (100% speak English very well).
Foreign born population: 1,789 (6.3%)
(77.5% of them are naturalized citizens)
| Here: | 7.6 |
| State: | 7.6 |
| Here: | 5.3 |
| State: | 4.3 |
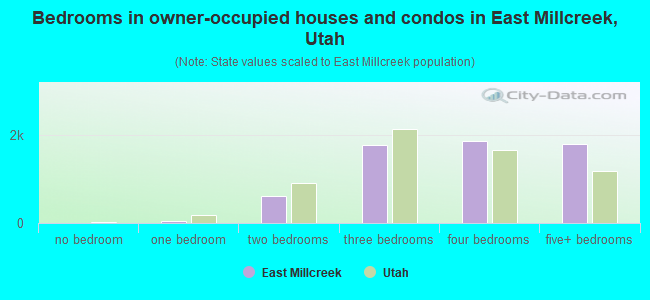
- Bedrooms in owner-occupied houses and condos in East Millcreek, Utah
- 9no bedroom
- 481 bedroom
- 6082 bedrooms
- 1,7673 bedrooms
- 1,8774 bedrooms
- 1,7995+ bedrooms
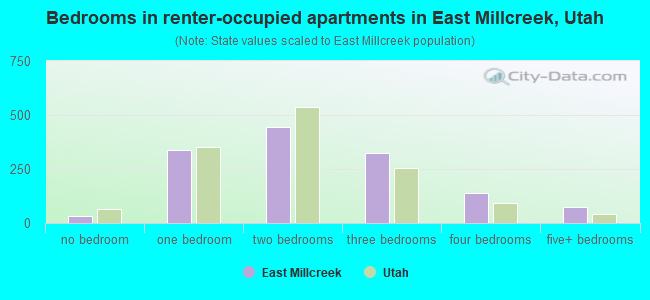
- Bedrooms in renter-occupied apartments in East Millcreek, Utah
- 32no bedroom
- 3381 bedroom
- 4432 bedrooms
- 3223 bedrooms
- 1384 bedrooms
- 735+ bedrooms
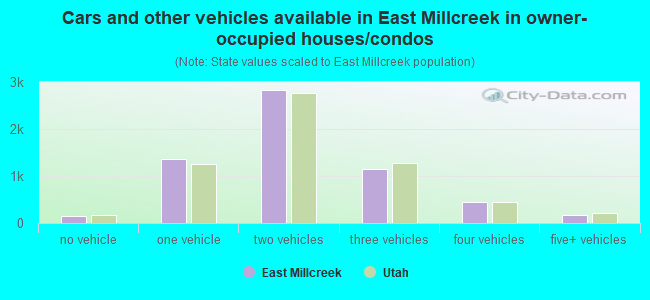
- Cars and other vehicles available in East Millcreek in owner-occupied houses/condos
- 150no vehicle
- 1,3631 vehicle
- 2,8352 vehicles
- 1,1463 vehicles
- 4374 vehicles
- 1775+ vehicles
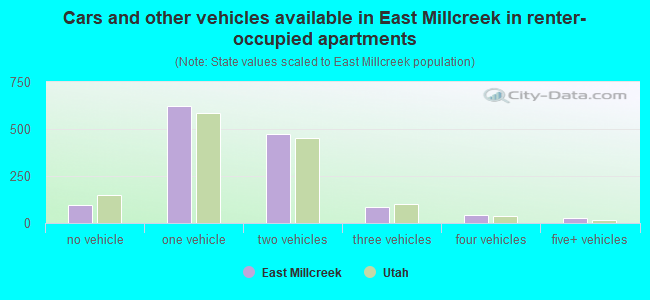
- Cars and other vehicles available in East Millcreek in renter-occupied apartments
- 95no vehicle
- 6241 vehicle
- 4752 vehicles
- 873 vehicles
- 404 vehicles
- 255+ vehicles
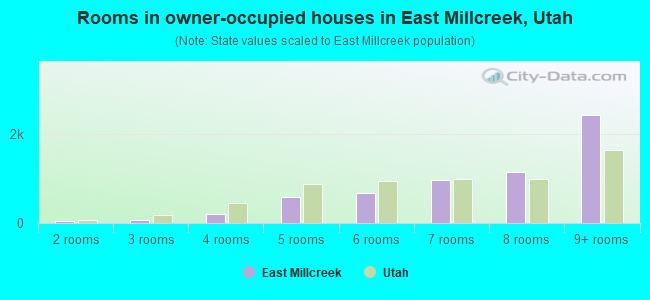
- Rooms in owner-occupied houses in East Millcreek, Utah
- 01 room
- 342 rooms
- 723 rooms
- 2054 rooms
- 5885 rooms
- 6766 rooms
- 9657 rooms
- 1,1468 rooms
- 2,4229+ rooms
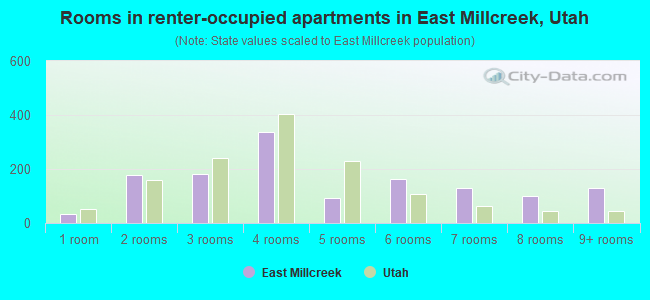
- Rooms in renter-occupied apartments in East Millcreek, Utah
- 321 room
- 1772 rooms
- 1833 rooms
- 3374 rooms
- 945 rooms
- 1636 rooms
- 1307 rooms
- 1018 rooms
- 1299+ rooms
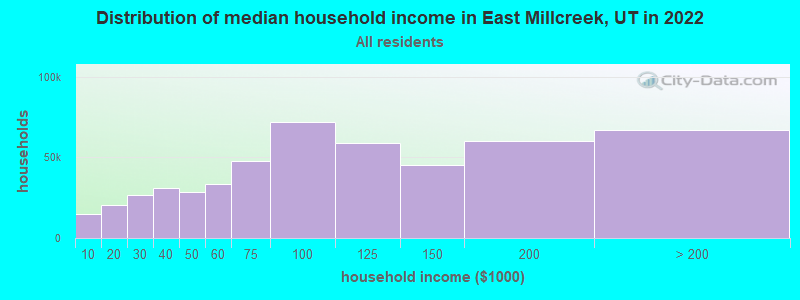
East Millcreek, UT household income distribution

- 14,614Less than $10,000
- 20,478$10,000 to $19,999
- 26,614$20,000 to $29,999
- 30,942$30,000 to $39,999
- 28,577$40,000 to $49,999
- 33,481$50,000 to $59,999
- 47,626$60,000 to $74,999
- 71,877$75,000 to $99,999
- 59,061$100,000 to $124,999
- 45,173$125,000 to $149,999
- 60,370$150,000 to $199,999
- 67,105$200,000 or more
Percentage of workers working in this county: 93.0%
Number of people working at home: 2,765 (19.0% of all workers)
Travel time to work (commute)
- Less than 5 minutes: 275
- 5 to 9 minutes: 807
- 10 to 14 minutes: 1,208
- 15 to 19 minutes: 2,074
- 20 to 24 minutes: 2,194
- 25 to 29 minutes: 989
- 30 to 34 minutes: 953
- 35 to 39 minutes: 152
- 40 to 44 minutes: 196
- 45 to 59 minutes: 265
- 60 to 89 minutes: 235
- 90 or more minutes: 63
Means of transportation to work:
- Drove a car alone: 8,155 (82.0%)
- Carpooled: 800 (8.0%)
- Bus or trolley bus: 292 (2.9%)
- Railroad: 20 (0.2%)
- Motorcycle: 7 (0.1%)
- Bicycle: 15 (0.2%)
- Walked: 116 (1.2%)
- Other means: 6 (0.1%)
- Worked at home: 531 (5.3%)
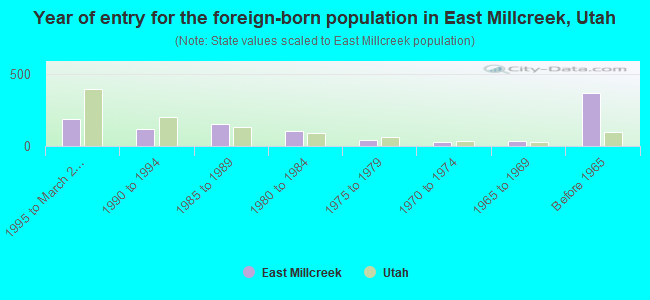
- Year of entry for the foreign-born population in East Millcreek, Utah
- 1911995 to March 2000
- 1201990 to 1994
- 1521985 to 1989
- 1031980 to 1984
- 441975 to 1979
- 261970 to 1974
- 361965 to 1969
- 371Before 1965
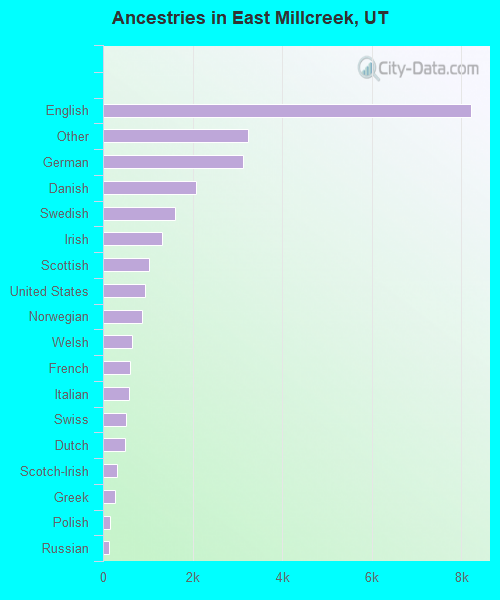
First ancestries reported:
- English: 8,210 (31.1%)
- Other: 3,240 (12.3%)
- German: 3,135 (11.9%)
- Danish: 2,078 (7.9%)
- Swedish: 1,599 (6.1%)
- Irish: 1,309 (5.0%)
- Scottish: 1,023 (3.9%)
- United States: 942 (3.6%)
- Norwegian: 869 (3.3%)
- Welsh: 638 (2.4%)
- French: 592 (2.2%)
- Italian: 572 (2.2%)
- Swiss: 506 (1.9%)
- Dutch: 485 (1.8%)
- Scotch-Irish: 312 (1.2%)
- Greek: 279 (1.1%)
- Polish: 162 (0.6%)
- Russian: 128 (0.5%)
- Czech: 50 (0.2%)
- Slovak: 44 (0.2%)
- Subsaharan African: 42 (0.2%)
- Arab: 41 (0.2%)
- French Canadian: 38 (0.1%)
- Ukrainian: 33 (0.1%)
- Lithuanian: 19 (0.07%)
- Hungarian: 16 (0.06%)
- Portuguese: 11 (0.04%)
Most common places of birth for foreign-born residents (%):
| East Millcreek: | 14.1% (147) |
| Utah: | 3.2% (5,086) |
| East Millcreek: | 8.8% (92) |
| Utah: | 1.0% (1,655) |
| East Millcreek: | 7.6% (79) |
| Utah: | 1.3% (2,020) |
| East Millcreek: | 7.6% (79) |
| Utah: | 41.9% (66,478) |
| East Millcreek: | 5.7% (59) |
| Utah: | 2.0% (3,195) |
| East Millcreek: | 4.2% (44) |
| Utah: | 4.9% (7,722) |
| East Millcreek: | 4.1% (43) |
| Utah: | 1.9% (3,013) |
| East Millcreek: | 4.0% (42) |
| Utah: | 1.3% (2,030) |
| East Millcreek: | 3.6% (38) |
| Utah: | 0.3% (495) |
| East Millcreek: | 3.5% (37) |
| Utah: | 0.3% (518) |
| East Millcreek: | 3.5% (36) |
| Utah: | 2.9% (4,662) |
| East Millcreek: | 3.3% (34) |
| Utah: | 0.5% (839) |
| East Millcreek: | 3.1% (32) |
| Utah: | 0.3% (460) |
| East Millcreek: | 2.5% (26) |
| Utah: | 1.2% (1,908) |
| East Millcreek: | 2.4% (25) |
| Utah: | 0.4% (613) |
| East Millcreek: | 2.4% (25) |
| Utah: | 0.3% (537) |
| East Millcreek: | 2.3% (24) |
| Utah: | 0.4% (594) |
| East Millcreek: | 2.3% (24) |
| Utah: | 3.0% (4,784) |
| East Millcreek: | 2.1% (22) |
| Utah: | 1.5% (2,357) |
| East Millcreek: | 1.7% (18) |
| Utah: | 1.1% (1,735) |
Place of birth for U.S.-born residents:
- This state: 15,165
- Other state: 5,097
- Northeast: 554
- Midwest: 1,315
- South: 684
- West: 2,544
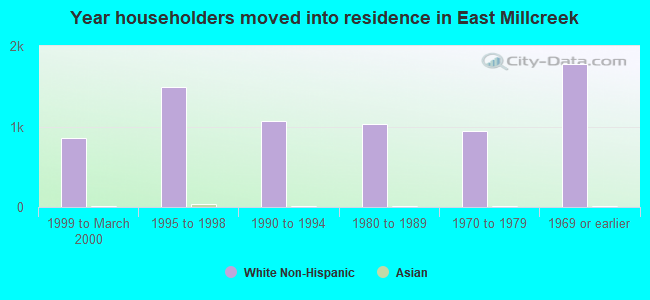
68% of East Millcreek residents lived in the same house 5 years ago.
Out of people who lived in different houses, 76% lived in this county.
Out of people who lived in different counties, 28% lived in Utah.
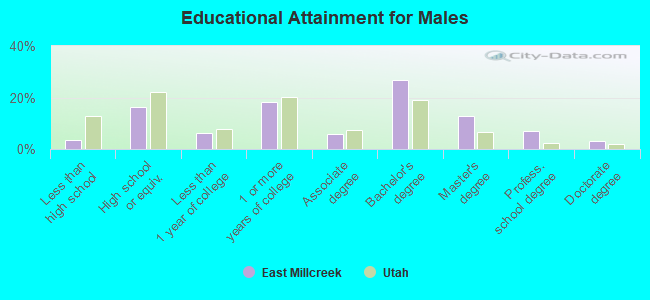
Education attainment for males 25 years and older:
- No schooling: 28
- Nursery to 4th grade: 8
- 5th and 6th grade: 0
- 7th and 8th grade: 14
- 9th grade: 26
- 10th grade: 8
- 11th grade: 53
- 12th grade, no diploma: 82
- High school graduate (or equivalency): 1,020
- Less than 1 year of college: 403
- Some college more than 1 year, no degree: 1,142
- Associate degree: 369
- Bachelor's degree: 1,686
- Master's degree: 818
- Professional school degree: 448
- Doctorate degree: 191
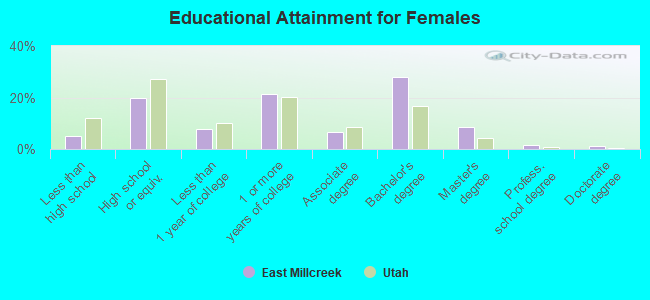
Education attainment for females 25 years and older:
- No schooling: 0
- Nursery to 4th grade: 0
- 5th and 6th grade: 10
- 7th and 8th grade: 43
- 9th grade: 58
- 10th grade: 63
- 11th grade: 100
- 12th grade, no diploma: 94
- High school graduate (or equivalency): 1,408
- Less than 1 year of college: 567
- Some college more than 1 year, no degree: 1,519
- Associate degree: 482
- Bachelor's degree: 1,994
- Master's degree: 619
- Professional school degree: 117
- Doctorate degree: 88


Housing units in structures:
- One, detached: 6,323
- One, attached: 380
- Two: 350
- 3 or 4: 272
- 5 to 9: 52
- 10 to 19: 110
- 20 to 49: 147
- 50 or more: 39
- Boats, RVs, vans, etc.: 17
Housing units lacking complete kitchen facilities: 0.4%
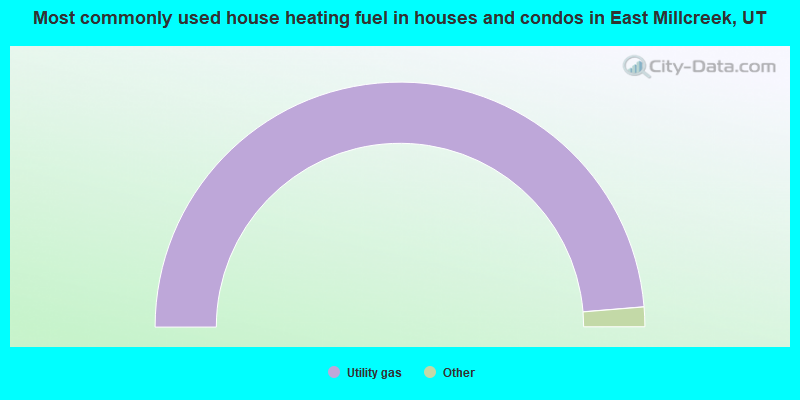
- 97.4%Utility gas
- 2.2%Electricity
- 0.1%Wood
- 0.1%No fuel used
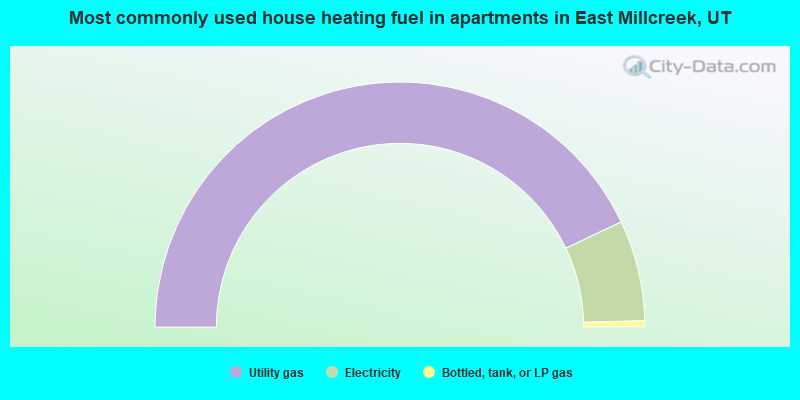
- 85.9%Utility gas
- 13.3%Electricity
- 0.8%Bottled, tank, or LP gas
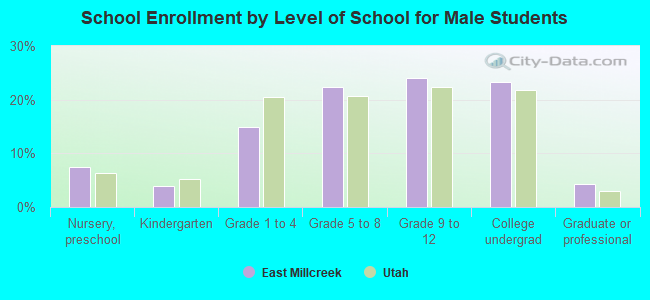
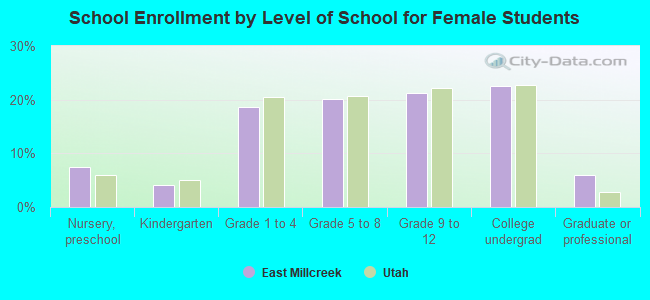
Private vs. public school enrollment:
| Here: | 10.5% |
| Utah: | 4.2% |
| Here: | 6.4% |
| Utah: | 3.9% |
| Here: | 15.6% |
| Utah: | 27.4% |