Elgin, IL (Illinois) Houses and Residents
Estimated median house or condo value in 2022: $263,500 (it was $138,500 in 2000 )
Elgin:
$263,500Illinois:
$251,600
Lower value quartile - upper value quartile: $197,400 - $355,300Mean price in 2022: Detached houses: $300,989 Here:
$300,989State:
$310,164
Townhouses or other attached units: $213,893 Here:
$213,893State:
$286,230
In 2-unit structures: $193,338 Here:
$193,338State:
$299,638
In 3-to-4-unit structures: $216,848 Here:
$216,848State:
$330,907
In 5-or-more-unit structures: $849,211 Here:
$849,211State:
$318,887
Mobile homes: $72,798 Here:
$72,798State:
$78,855
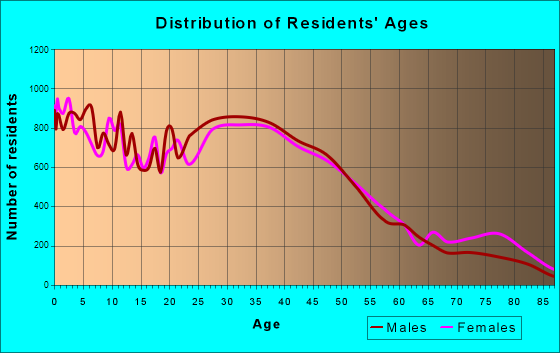
Total population: 111,117 (Urban population: 93,880, Rural population: 15 (all nonfarm) )
Houses: 38,965 (38,350 occupied: 28,776 owner occupied, 9,574 renter occupied )
% of renters here:
25%State:
33%
Housing density: 1,558 houses/condos per square mile
Median price asked for vacant for-sale houses and condos in 2022: $351,985.
Median contract rent in 2022: $1,007 (lower quartile is $782, upper quartile is $1,324)
Median rent asked for vacant for-rent units in 2022: $1,548
Median gross rent in Elgin, IL in 2022: $1,120
Housing units in Elgin with a mortgage: 18,472 (1,395 second mortgage, 0 home equity loan, 1,154 both second mortgage and home equity loan )Houses without a mortgage: 281
Median household income for houses/condos with a mortgage: $112,893
Median household income for apartments without a mortgage: $79,833
Median monthly housing costs: $1,412
Data:
Median house or condo value ($)
Median house or condo value ($ change since 2000)
Median house or condo value ($) - White
Median house or condo value ($) - Black or African American
Median house or condo value ($) - Asian
Median house or condo value ($) - Hispanic or Latino
Median house or condo value ($) - American Indian and Alaska Native
Median house or condo value ($) - Multirace
Median house or condo value ($) - Other Race
Median price asked for mobile homes ($)
Household density (households per square mile)
Mean house or condo value by units in structure - 1, detached ($)
Mean house or condo value by units in structure - 1, attached ($)
Mean house or condo value by units in structure - 2 ($)
Mean house or condo value by units in structure by units in structure - 3 or 4 ($)
Mean house or condo value by units in structure - 5 or more ($)
Mean house or condo value by units in structure - Boat, RV, van, etc. ($)
Mean house or condo value by units in structure - Mobile home ($)
Median contract rent ($)
Median contract rent - Lower quartile ($)
Median contract rent - Upper quartile ($)
Median gross rent ($)
Urban houses (%)
Rural houses (%)
Houses occupied (%)
Houses occupied (% change since 2000)
Houses owner occupied (%)
Houses owner occupied (% change since 2000)
Houses renter occupied (%)
Houses renter occupied (% change since 2000)
Vacant housing units - For rent (%)
Vacant housing units - For rent (% change since 2000)
Vacant housing units - For sale only (%)
Vacant housing units - For sale only (% change since 2000)
Vacant housing units - Rented or sold, not occupied (%)
Vacant housing units - Rented or sold, not occupied (% change since 2000)
Vacant housing units - For seasonal, recreational, or occasional use (%)
Vacant housing units - For seasonal, recreational, or occasional use (% change since 2000)
Vacant housing units - For migrant workers (%)
Vacant housing units - For migrant workers (% change since 2000)
Vacant housing units - Other vacant (%)
Vacant housing units - Other vacant (% change since 2000)
Median monthly housing costs ($)
Median household income for houses/condos with a mortgage ($)
Median household income for houses/condos without a mortgage ($)
Median household income ($)
Median household income ($) - White
Median household income ($) - Black or African American
Median household income ($) - Asian
Median household income ($) - Hispanic or Latino
Median household income ($) - American Indian and Alaska Native
Median household income ($) - Multirace
Median household income ($) - Other Race
Mortgage status - with mortgage (%)
Mortgage status - with second mortgage (%)
Mortgage status - with home equity loan (%)
Mortgage status - with both second mortgage and home equity loan (%)
Mortgage status - without a mortgage (%)
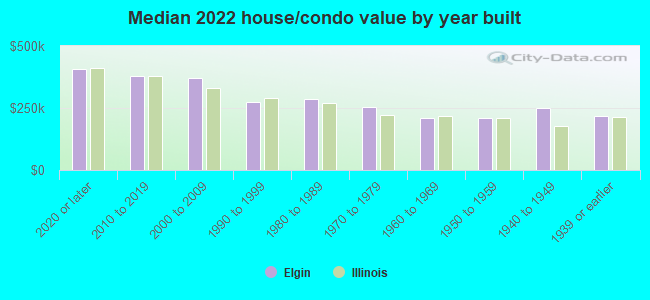
Median year house/condo built
Median year apartment built
Household type by relationship - Male householder living alone (%)
Household type by relationship - Male householder not living alone (%)
Household type by relationship - Female householder living alone (%)
Household type by relationship - Female householder not living alone (%)
Household type by relationship - Opposite-Sex spouse (%)
Household type by relationship - Same-Sex spouse (%)
Household type by relationship - Opposite-Sex unmarried partner (%)
Household type by relationship - Same-Sex unmarried partner (%)
Household type by relationship - In group quarters (%)
Size of family households - 2-person household (%)
Size of family households - 3-person household (%)
Size of family households - 4-person household (%)
Size of family households - 5-person household (%)
Size of family households - 6-person household (%)
Size of family households - 7-or-more-person household (%)
Size of nonfamily households - 1-person household (%)
Size of nonfamily households - 2-person household (%)
Size of nonfamily households - 3-person household (%)
Size of nonfamily households - 4-person household (%)
Size of nonfamily households - 5-person household (%)
Size of nonfamily households - 6-person household (%)
Size of nonfamily households - 7-or-moreperson household (%)
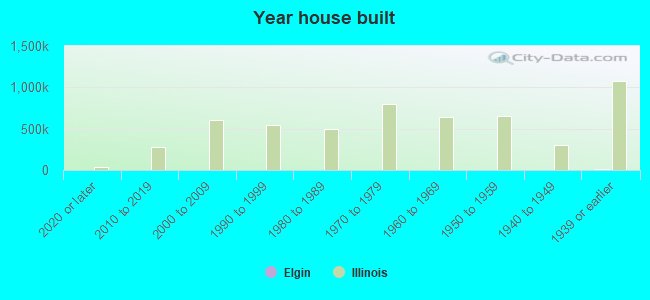
Year house built - Built 2010 or later (%)
Year house built - Built 2000 to 2009 (%)
Year house built - Built 1990 to 1999 (%)
Year house built - Built 1980 to 1989 (%)
Year house built - Built 1970 to 1979 (%)
Year house built - Built 1960 to 1969 (%)
Year house built - Built 1950 to 1959 (%)
Year house built - Built 1940 to 1949 (%)
Year house built - Built 1939 or earlier (%)
Median number of rooms in houses and condos
Median number of rooms in apartments
Median number of bedrooms in owner occupied houses
Mean number of bedrooms in owner occupied houses
Median number of bedrooms in renter occupied houses
Mean number of bedrooms in renter occupied houses
Median number of vehichles in owner occupied houses
Mean number of vehichles in owner occupied houses
Median number of vehichles in renter occupied houses
Mean number of vehichles in renter occupied houses
Rooms in owner-occupied houses - 1 room (%)
Rooms in owner-occupied houses - 2 rooms (%)
Rooms in owner-occupied houses - 3 rooms (%)
Rooms in owner-occupied houses - 4 rooms (%)
Rooms in owner-occupied houses - 5 rooms (%)
Rooms in owner-occupied houses - 6 rooms (%)
Rooms in owner-occupied houses - 7 rooms (%)
Rooms in owner-occupied houses - 8 rooms (%)
Rooms in owner-occupied houses - 9+ rooms (%)
Rooms in renter-occupied houses - 1 room (%)
Rooms in renter-occupied houses - 2 rooms (%)
Rooms in renter-occupied houses - 3 rooms (%)
Rooms in renter-occupied houses - 4 rooms (%)
Rooms in renter-occupied houses - 5 rooms (%)
Rooms in renter-occupied houses - 6 rooms (%)
Rooms in renter-occupied houses - 7 rooms (%)
Rooms in renter-occupied houses - 8 rooms (%)
Rooms in renter-occupied houses - 9+ rooms (%)
Bedrooms in owner-occupied houses - no bedrooms (%)
Bedrooms in owner-occupied houses - 1 bedroom (%)
Bedrooms in owner-occupied houses - 2 bedrooms (%)
Bedrooms in owner-occupied houses - 3 bedrooms (%)
Bedrooms in owner-occupied houses - 4 bedrooms (%)
Bedrooms in owner-occupied houses - 5+ bedrooms (%)
Bedrooms in renter-occupied houses - no bedrooms (%)
Bedrooms in renter-occupied houses - 1 bedroom (%)
Bedrooms in renter-occupied houses - 2 bedrooms (%)
Bedrooms in renter-occupied houses - 3 bedrooms (%)
Bedrooms in renter-occupied houses - 4 bedrooms (%)
Bedrooms in renter-occupied houses - 5+ bedrooms (%)
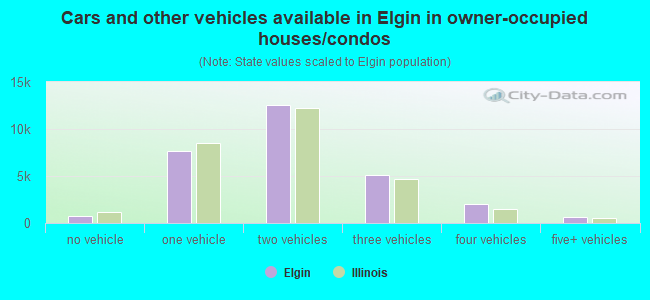
Vehicles available in owner-occupied houses - no vehicle available (%)
Vehicles available in owner-occupied houses - 1 vehicle available(%)
Vehicles available in owner-occupied houses - 2 Vehicles available (%)
Vehicles available in owner-occupied houses - 3 Vehicles available (%)
Vehicles available in owner-occupied houses - 4 Vehicles available (%)
Vehicles available in owner-occupied houses - 5+ Vehicles available (%)
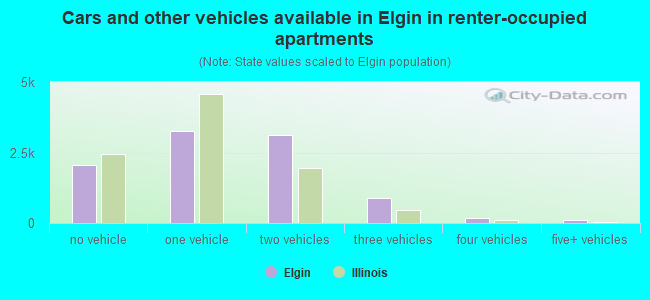
Vehicles available in renter-occupied houses - no vehicle available (%)
Vehicles available in renter-occupied houses - 1 vehicle available (%)
Vehicles available in renter-occupied houses - 2 Vehicles available (%)
Vehicles available in renter-occupied houses - 3 Vehicles available (%)
Vehicles available in renter-occupied houses - 4 Vehicles available (%)
Vehicles available in renter-occupied houses - 5+ Vehicles available (%)
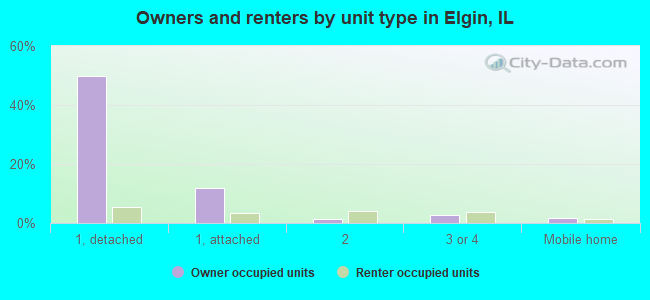
Housing units in structures - 1, detached (%)
Housing units in structures - 1, attached (%)
Housing units in structures - 2 (%)
Housing units in structures - 3 or 4 (%)
Housing units in structures - 5 to 9 (%)
Housing units in structures - 10 to 19 (%)
Housing units in structures - 20 to 49 (%)
Housing units in structures - 50 or more (%)
Housing units in structures - Mobile home (%)
Housing units in structures - Boat, RV, van, etc. (%)
Housing units in structures - Owners - 1, detached (%)
Housing units in structures - Owners - 1, attached (%)
Housing units in structures - Owners - 2 (%)
Housing units in structures - Owners - 3 or 4 (%)
Housing units in structures - Owners - 5 to 9 (%)
Housing units in structures - Owners - 10 to 19 (%)
Housing units in structures - Owners - 20 to 49 (%)
Housing units in structures - Owners - 50 or more (%)
Housing units in structures - Owners - Mobile home (%)
Housing units in structures - Owners - Boat, RV, van, etc. (%)
Housing units in structures - Renters - 1, detached (%)
Housing units in structures - Renters - 1, attached (%)
Housing units in structures - Renters - 2 (%)
Housing units in structures - Renters - 3 or 4 (%)
Housing units in structures - Renters - 5 to 9 (%)
Housing units in structures - Renters - 10 to 19 (%)
Housing units in structures - Renters - 20 to 49 (%)
Housing units in structures - Renters - 50 or more (%)
Housing units in structures - Renters - Mobile home (%)
Housing units in structures - Renters - Boat, RV, van, etc. (%)
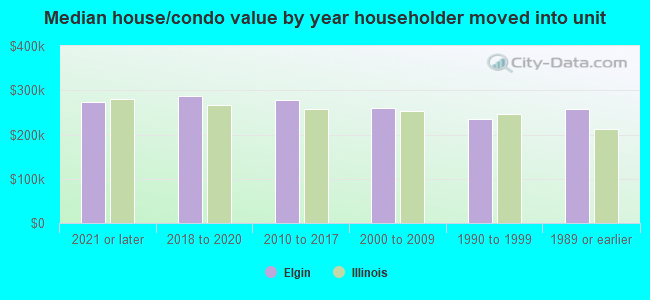
House/condo owner moved in on average (years ago)
Renter moved in on average (years ago)
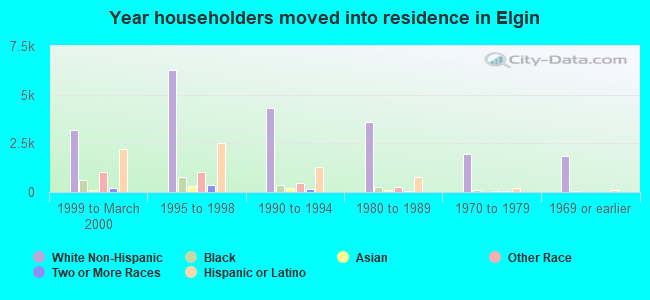
Year householder moved into unit - Moved in 1999 to March 2000 (%)
Year householder moved into unit - Moved in 1999 to March 2000 (%) - White
Year householder moved into unit - Moved in 1999 to March 2000 (%) - Black or African American
Year householder moved into unit - Moved in 1999 to March 2000 (%) - Asian
Year householder moved into unit - Moved in 1999 to March 2000 (%) - Hispanic or Latino
Year householder moved into unit - Moved in 1999 to March 2000 (%) - American Indian and Alaska Native
Year householder moved into unit - Moved in 1999 to March 2000 (%) - Multirace
Year householder moved into unit - Moved in 1999 to March 2000 (%) - Other Race
Year householder moved into unit - Moved in 1995 to 1998 (%)
Year householder moved into unit - Moved in 1995 to 1998 (%) - White
Year householder moved into unit - Moved in 1995 to 1998 (%) - Black or African American
Year householder moved into unit - Moved in 1995 to 1998 (%) - Asian
Year householder moved into unit - Moved in 1995 to 1998 (%) - Hispanic or Latino
Year householder moved into unit - Moved in 1995 to 1998 (%) - American Indian and Alaska Native
Year householder moved into unit - Moved in 1995 to 1998 (%) - Multirace
Year householder moved into unit - Moved in 1995 to 1998 (%) - Other Race
Year householder moved into unit - Moved in 1990 to 1994 (%)
Year householder moved into unit - Moved in 1990 to 1994 (%) - White
Year householder moved into unit - Moved in 1990 to 1994 (%) - Black or African American
Year householder moved into unit - Moved in 1990 to 1994 (%) - Asian
Year householder moved into unit - Moved in 1990 to 1994 (%) - Hispanic or Latino
Year householder moved into unit - Moved in 1990 to 1994 (%) - American Indian and Alaska Native
Year householder moved into unit - Moved in 1990 to 1994 (%) - Multirace
Year householder moved into unit - Moved in 1990 to 1994 (%) - Other Race
Year householder moved into unit - Moved in 1980 to 1989 (%)
Year householder moved into unit - Moved in 1980 to 1989 (%) - White
Year householder moved into unit - Moved in 1980 to 1989 (%) - Black or African American
Year householder moved into unit - Moved in 1980 to 1989 (%) - Asian
Year householder moved into unit - Moved in 1980 to 1989 (%) - Hispanic or Latino
Year householder moved into unit - Moved in 1980 to 1989 (%) - American Indian and Alaska Native
Year householder moved into unit - Moved in 1980 to 1989 (%) - Multirace
Year householder moved into unit - Moved in 1980 to 1989 (%) - Other Race
Year householder moved into unit - Moved in 1970 to 1979 (%)
Year householder moved into unit - Moved in 1970 to 1979 (%) - White
Year householder moved into unit - Moved in 1970 to 1979 (%) - Black or African American
Year householder moved into unit - Moved in 1970 to 1979 (%) - Asian
Year householder moved into unit - Moved in 1970 to 1979 (%) - Hispanic or Latino
Year householder moved into unit - Moved in 1970 to 1979 (%) - American Indian and Alaska Native
Year householder moved into unit - Moved in 1970 to 1979 (%) - Multirace
Year householder moved into unit - Moved in 1970 to 1979 (%) - Other Race
Year householder moved into unit - Moved in 1969 or earlier (%)
Year householder moved into unit - Moved in 1969 or earlier (%) - White
Year householder moved into unit - Moved in 1969 or earlier (%) - Black or African American
Year householder moved into unit - Moved in 1969 or earlier (%) - Asian
Year householder moved into unit - Moved in 1969 or earlier (%) - Hispanic or Latino
Year householder moved into unit - Moved in 1969 or earlier (%) - American Indian and Alaska Native
Year householder moved into unit - Moved in 1969 or earlier (%) - Multirace
Year householder moved into unit - Moved in 1969 or earlier (%) - Other Race
Housing units lacking complete plumbing facilities (%)
Housing units lacking complete kitchen facilities (%)
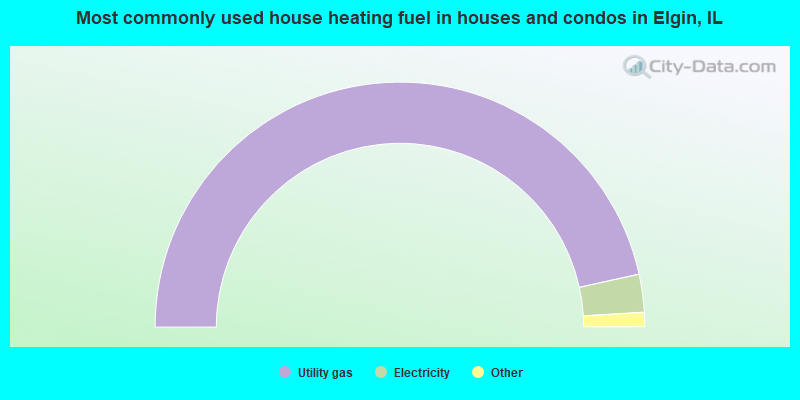
House heating fuel used in houses and condos - Utility gas (%)
House heating fuel used in houses and condos - Bottled, tank, or LP gas (%)
House heating fuel used in houses and condos - Electricity (%)
House heating fuel used in houses and condos - Fuel oil, kerosene, etc. (%)
House heating fuel used in houses and condos - Coal or coke (%)
House heating fuel used in houses and condos - Wood (%)
House heating fuel used in houses and condos - Solar energy (%)
House heating fuel used in houses and condos - Other fuel (%)
House heating fuel used in houses and condos - No fuel used (%)
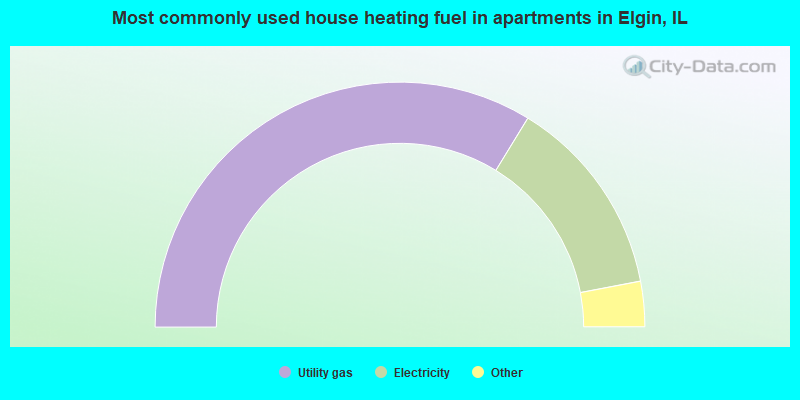
House heating fuel used in apartments - Utility gas (%)
House heating fuel used in apartments - Bottled, tank, or LP gas (%)
House heating fuel used in apartments - Electricity (%)
House heating fuel used in apartments - Fuel oil, kerosene, etc. (%)
House heating fuel used in apartments - Coal or coke (%)
House heating fuel used in apartments - Wood (%)
House heating fuel used in apartments - Solar energy (%)
House heating fuel used in apartments - Other fuel (%)
House heating fuel used in apartments - No fuel used (%)
Latest news about housing in Elgin, IL collected exclusively by city-data.com from local newspapers, TV, and radio stations
Median year house/condo built: 1980Median year apartment built: 1970Household type by relationship:
Households: 109,634
Male householders: 19,072 (3,589 living alone ), Female householders: 19,278 (4,529 living alone )18,921 spouses (18,825 opposite-sex spouses ), 3,368 unmarried partners , (3,368 opposite-sex unmarried partners ), 36,297 children (34,095 natural , 986 adopted , 1,216 stepchildren ), 3,163 grandchildren , 1,458 brothers or sisters , 2,236 parents , 393 foster children , 2,067 other relatives , 1,742 non-relatives In group quarters: 1,639
Size of family households: 10,340 2-persons , 5,499 3-persons , 6,766 4-persons , 3,839 5-persons , 1,167 6-persons , 369 7-or-more-persons .
Size of nonfamily households: 8,118 1-person , 2,021 2-persons , 69 3-persons , 124 4-persons , 38 7-or-more-persons .
15,413 married couples with children. single-parent households (1,929 men , 6,135 women ).
52.7% of residents of Elgin speak English at home. of residents speak Spanish at home (59% speak English very well , 18% speak English well , 16% speak English not well , 7% don't speak English at all ).of residents speak other Indo-European language at home (64% speak English very well , 22% speak English well , 12% speak English not well , 1% don't speak English at all ).of residents speak Asian or Pacific Island language at home (72% speak English very well , 18% speak English well , 10% speak English not well , 1% don't speak English at all ).of residents speak other language at home (62% speak English very well , 29% speak English well , 4% speak English not well , 4% don't speak English at all ).
Foreign born population: 26,625 (24.3%)of them are naturalized citizens )
Median number of rooms in houses and condos:
Median number of rooms in apartments
Owner-occupied Renter-occupied
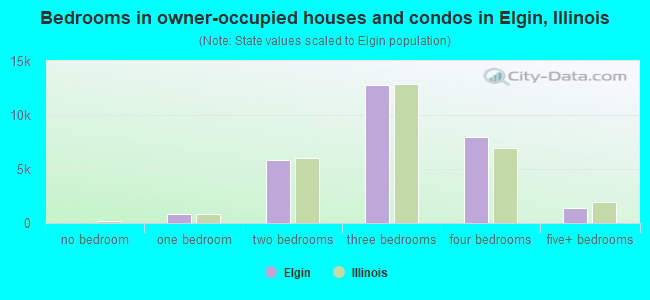
Bedrooms in owner-occupied houses and condos in Elgin, Illinois
0 no bedroom 874 1 bedroom 5,830 2 bedrooms 12,778 3 bedrooms 7,947 4 bedrooms 1,347 5+ bedrooms
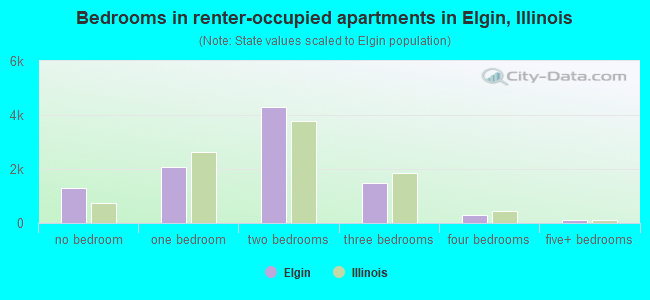
Bedrooms in renter-occupied apartments in Elgin, Illinois
1,300 no bedroom 2,074 1 bedroom 4,311 2 bedrooms 1,497 3 bedrooms 297 4 bedrooms 95 5+ bedrooms
Owner-occupied Renter-occupied
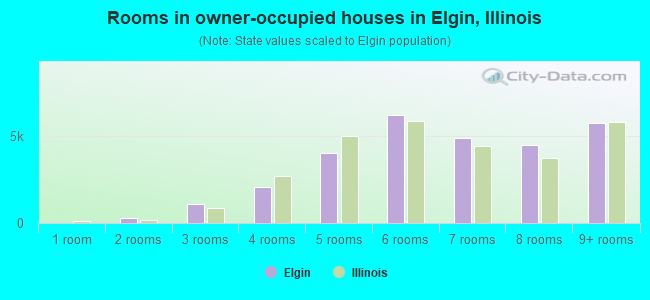
Rooms in owner-occupied houses in Elgin, Illinois
0 1 room 278 2 rooms 1,102 3 rooms 2,052 4 rooms 4,012 5 rooms 6,214 6 rooms 4,876 7 rooms 4,471 8 rooms 5,771 9+ rooms
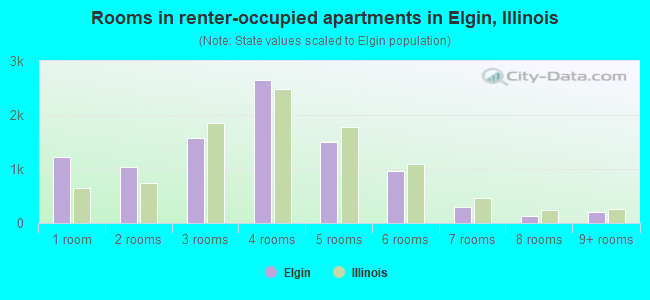
Rooms in renter-occupied apartments in Elgin, Illinois
1,222 1 room 1,044 2 rooms 1,579 3 rooms 2,645 4 rooms 1,498 5 rooms 956 6 rooms 288 7 rooms 137 8 rooms 205 9+ rooms
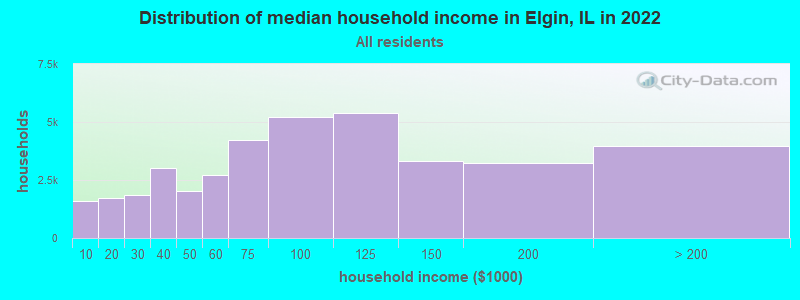
Elgin, IL household income distribution 1,606 Less than $10,0001,704 $10,000 to $19,9991,863 $20,000 to $29,9993,038 $30,000 to $39,9992,035 $40,000 to $49,9992,714 $50,000 to $59,9994,243 $60,000 to $74,9995,237 $75,000 to $99,9995,381 $100,000 to $124,9993,326 $125,000 to $149,9993,222 $150,000 to $199,9993,981 $200,000 or more
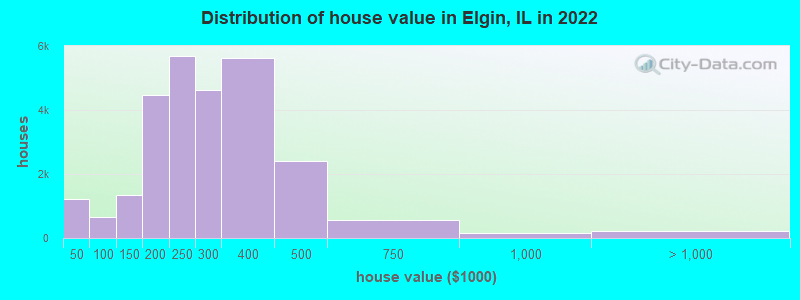
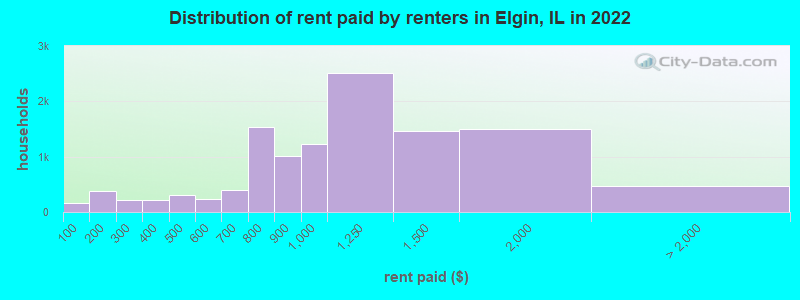
Home value of owner - occupied houses in 2022 in Elgin, IL 248 Less than $10,000383 $10,000 to $14,999158 $15,000 to $19,99999 $20,000 to $24,99990 $25,000 to $29,999102 $30,000 to $34,99927 $35,000 to $39,999113 $40,000 to $49,99943 $50,000 to $59,99983 $60,000 to $69,99971 $70,000 to $79,99971 $80,000 to $89,999278 $90,000 to $99,999807 $100,000 to $124,999541 $125,000 to $149,9991,759 $150,000 to $174,9992,696 $175,000 to $199,9995,699 $200,000 to $249,9994,614 $250,000 to $299,9995,632 $300,000 to $399,9992,413 $400,000 to $499,999564 $500,000 to $749,999157 $750,000 to $999,99969 $1,000,000 to $1,499,99948 $1,500,000 to $1,999,99994 $2,000,000 or moreRent paid by renters in 2022 in Elgin, IL 161 Less than $100237 $100 to $149148 $150 to $19947 $200 to $249167 $250 to $299180 $300 to $34930 $350 to $399159 $400 to $449151 $450 to $499134 $500 to $54996 $550 to $599271 $600 to $649122 $650 to $699596 $700 to $749937 $750 to $7991,016 $800 to $8991,236 $900 to $9992,512 $1,000 to $1,2491,470 $1,250 to $1,4991,497 $1,500 to $1,999152 $2,000 to $2,499107 $2,500 to $2,999212 No cash rent
Percentage of workers working in this county: 59.3%Number of people working at home: 6,534 (11.5% of all workers )
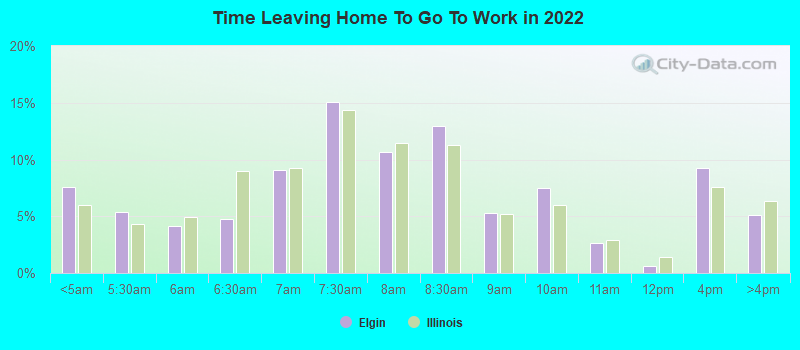
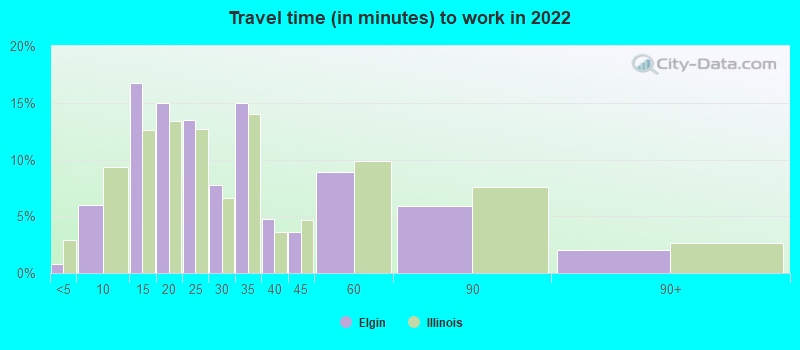
Travel time to work (commute)
Less than 5 minutes: 6075 to 9 minutes: 2,69010 to 14 minutes: 8,53415 to 19 minutes: 5,86920 to 24 minutes: 7,48525 to 29 minutes: 2,64830 to 34 minutes: 7,96435 to 39 minutes: 1,62040 to 44 minutes: 2,36645 to 59 minutes: 5,05160 to 89 minutes: 4,03990 or more minutes: 794
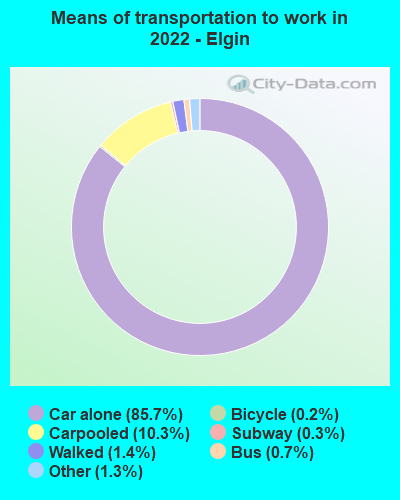
Means of transportation to work:
Drove a car alone: 44,376 (75.1%)Carpooled: 5,661 (9.6%)Bus : 498 (0.8%)Subway or elevated rail : 8 (0.0%)Long-distance train or commuter rail : 124 (0.2%)Ferryboat: 58 (0.1%)Taxi: 903 (1.5%)Bicycle: 184 (0.3%)Walked: 630 (1.1%)Worked at home: 6,534 (11.1%)
Unemployment by race in 2022
Unemployment rate for White non-Hispanic residents 4.6% Males9.0% FemalesUnemployment rate for Black residents 7.0% Males6.4% FemalesUnemployment rate for American Indian and Alaska Native residents 6.1% Males25.7% FemalesUnemployment rate for Asian residents 3.1% Males5.4% FemalesUnemployment rate for other race residents 7.3% Males2.0% FemalesUnemployment rate for two or more race residents 3.7% Males13.4% FemalesUnemployment rate for Hispanic or Latino residents 6.4% Males10.0% Females
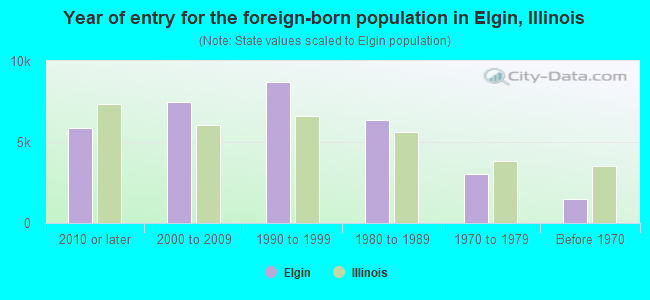
Year of entry for the foreign-born population in Elgin, Illinois
5,891 2010 or later 7,498 2000 to 2009 8,685 1990 to 1999 6,354 1980 to 1989 3,003 1970 to 1979 1,512 Before 1970
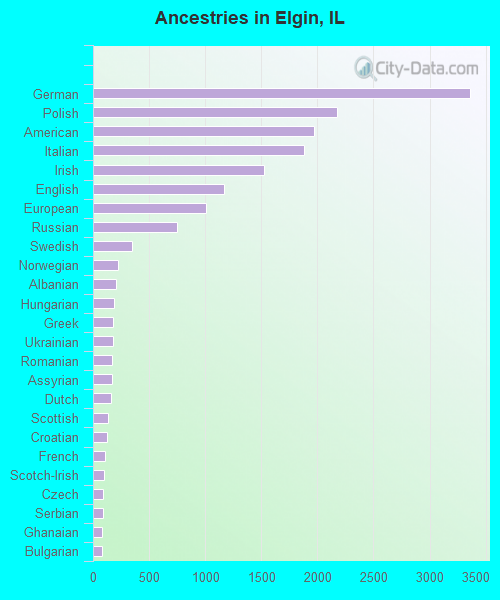
First ancestries reported:
German: 3,362 (5.3%)
Polish: 2,172 (3.4%)
American: 1,971 (3.1%)
Italian: 1,880 (3.0%)
Irish: 1,522 (2.4%)
English: 1,167 (1.8%)
European: 1,010 (1.6%)
Russian: 746 (1.2%)
Swedish: 345 (0.5%)
Norwegian: 219 (0.3%)
Albanian: 206 (0.3%)
Hungarian: 190 (0.3%)
Greek: 182 (0.3%)
Ukrainian: 177 (0.3%)
Romanian: 169 (0.3%)
Assyrian: 168 (0.3%)
Dutch: 157 (0.2%)
Scottish: 135 (0.2%)
Croatian: 127 (0.2%)
French: 103 (0.2%)
Scotch-Irish: 95 (0.1%)
Czech: 88 (0.1%)
Serbian: 87 (0.1%)
Ghanaian: 80 (0.1%)
Bulgarian: 76 (0.1%)
Kenyan: 65 (0.1%)
Welsh: 57 (0.09%)
African: 54 (0.08%)
Australian: 53 (0.08%)
Danish: 52 (0.08%)
Canadian: 47 (0.07%)
Eastern European: 43 (0.07%)
Jamaican: 38 (0.06%)
Slovene: 35 (0.06%)
Syrian: 34 (0.05%)
Scandinavian: 33 (0.05%)
Swiss: 30 (0.05%)
Turkish: 27 (0.04%)
French Canadian: 26 (0.04%)
Lithuanian: 26 (0.04%)
Nigerian: 24 (0.04%)
Haitian: 24 (0.04%)
Egyptian: 19 (0.03%)
West Indian: 19 (0.03%)
Belgian: 18 (0.03%)
British: 17 (0.03%)
Finnish: 16 (0.03%)
Austrian: 15 (0.02%)
Luxembourger: 13 (0.02%)
Somali: 13 (0.02%)
Trinidadian and Tobagonian: 13 (0.02%)
Lebanese: 13 (0.02%)
Yugoslavian: 12 (0.02%)
Northern European: 9 (0.01%)
Slovak: 8 (0.01%)
Bahamian: 7 (0.01%)
Czechoslovakian: 6 (0.01%)
Barbadian: 6 (0.01%)
U.S. Virgin Islander: 4 (0.01%)
Most common places of birth for foreign-born residents (%): Mexico Elgin:
67.0% (19,652)Illinois:
34.7% (626,958)
India Elgin:
5.2% (1,510)Illinois:
9.2% (166,409)
Philippines Elgin:
3.8% (1,111)Illinois:
5.2% (93,003)
Laos Elgin:
2.3% (663)Illinois:
0.2% (3,512)
Colombia Elgin:
2.3% (663)Illinois:
0.9% (16,553)
Poland Elgin:
2.2% (646)Illinois:
6.9% (124,474)
Pakistan Elgin:
1.7% (489)Illinois:
1.6% (29,519)
Venezuela Elgin:
1.6% (470)Illinois:
0.5% (9,688)
Place of birth for U.S.-born residents:
This state: 69,430Other state: 11,029Northeast: 921Midwest: 4,900South: 2,641West: 2,567 86.5% of Elgin residents lived in the same house 1 years ago.
Out of people who lived in different houses, 29.0% lived in this county.
Out of people who lived in different counties, 75.7% lived in Illinois.
Elgin:
86.5%State average:
88.3%
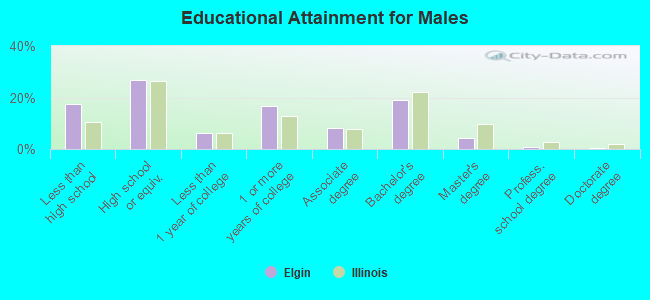
Education attainment for males 25 years and older:
No schooling: 1,910Nursery to 4th grade: 2605th and 6th grade: 6047th and 8th grade: 7109th grade: 29810th grade: 59611th grade: 18812th grade, no diploma: 1,644High school graduate (or equivalency): 9,558Less than 1 year of college: 2,256Some college more than 1 year, no degree: 5,910Associate degree: 2,874Bachelor's degree: 6,818Master's degree: 1,579Professional school degree: 313Doctorate degree: 165
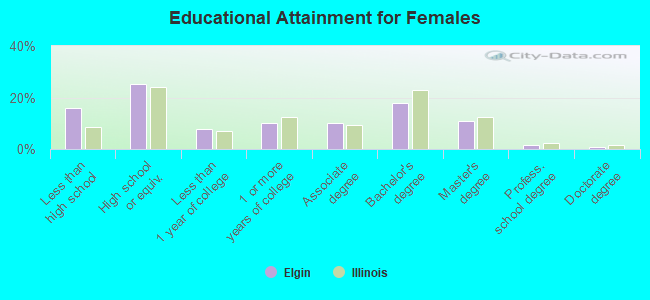
Education attainment for females 25 years and older:
No schooling: 1,143Nursery to 4th grade: 5985th and 6th grade: 7717th and 8th grade: 8559th grade: 67710th grade: 011th grade: 61612th grade, no diploma: 800High school graduate (or equivalency): 8,766Less than 1 year of college: 2,735Some college more than 1 year, no degree: 3,439Associate degree: 3,442Bachelor's degree: 6,231Master's degree: 3,833Professional school degree: 485Doctorate degree: 315
Housing units in structures:
One, detached: 24,734One, attached: 5,105Two: 7223 or 4: 2,4045 to 9: 1,51710 to 19: 1,07720 to 49: 1,50750 or more: 1,173Mobile homes: 726Median worth of mobile homes: $44,200
Housing units lacking complete kitchen facilities in 2022: 0.2%House/condo owner moved in on average 10 years ago
Renter moved in on average 3 years ago
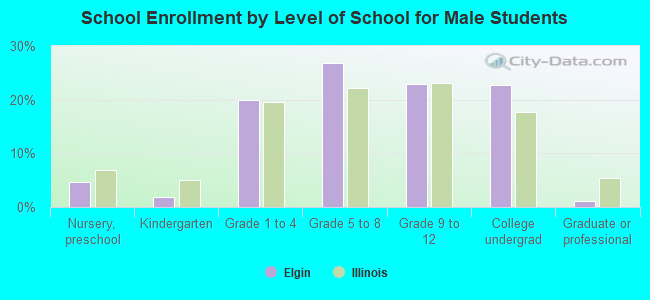
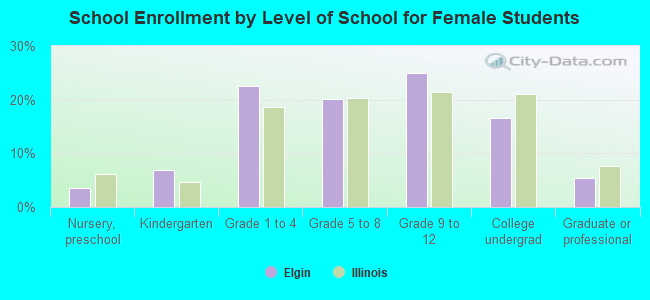
Private vs. public school enrollment:
Students in private schools in grades 1 to 8 (elementary and middle school): 711 Students in private schools in grades 9 to 12 (high school): 497 Students in private undergraduate colleges: 1,103