Jump to a detailed profile or search site with Google Custom Search

Emigration, UT (Utah) Houses and Residents

Estimated median house or condo value in 2022: $960,600 (it was $275,200 in 2000)
Emigration:

$960,600
Utah:

$499,500
Lower value quartile - upper value quartile: $695,930 - $1,326,936

Total population: 9,626 (Urban population: 6,972, Rural population: 1,681 (all nonfarm))

Houses: 3,317 (3,111 occupied: 2,940 owner occupied, 171 renter occupied)

% of renters here:

5%
State:

29%

Housing density: 27 houses/condos per square mile

Median price asked for vacant for-sale houses and condos in 2022 in this county: $719,617.

Median contract rent in 2022: over $2,000 (lower quartile is $1,608, upper quartile is over $2,000)


Median rent asked for vacant for-rent units in 2022: $1,669


Median gross rent in Emigration, UT in 2022: over $2,000

Housing units in Emigration with a mortgage: 1,878 (244 second mortgage, 217 home equity loan, 0 both second mortgage and home equity loan)
Houses without a mortgage: 920

Compare current foreclosures near Emigration, UT:

Check out more offers near Emigration, UT.
Powered by Foreclosure.com


Emigration, Utah Age and Sex of Residents

Household type by relationship:

Households: 1,015,649
  • In family households: 879,880 (178,461 male householders, 64,165 female householders)
    187,678 spouses, 347,268 children (321,676 natural, 9,572 adopted, 16,020 stepchildren), 25,511 grandchildren, 12,209 brothers or sisters, 7,940 parents, foster children, 18,887 other relatives, 27,608 non-relatives
  • In nonfamily households: 135,769 (49,607 male householders (35,052 living alone)), 50,389 female householders (40,012 living alone)), 35,773 nonrelatives
  • In group quarters: 14,006 (9,420 institutionalized population)

205,311 married couples with children.
43,285 single-parent households (10,357 men, 32,928 women).

90.1% of residents of Emigration speak English at home.
2.1% of residents speak Spanish at home (85% speak English very well, 11% speak English well, 4% speak English not well).
5.5% of residents speak other Indo-European language at home (87% speak English very well, 6% speak English well, 7% speak English not well).
2.1% of residents speak Asian or Pacific Island language at home (48% speak English very well, 38% speak English well, 15% speak English not well).
0.2% of residents speak other language at home (100% speak English very well).

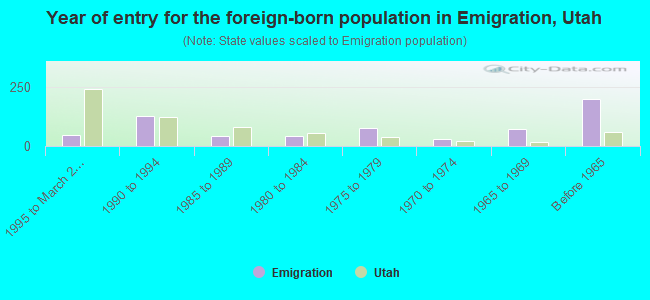
Foreign born population: 1,085 (9.5%)
(98.2% of them are naturalized citizens)

Median number of rooms in houses and condos:
Here:

8.7
State:

7.6

Median number of rooms in apartments
Here:

9.3
State:

4.3

Owner-occupied Renter-occupied
Bedrooms in owner-occupied houses and condos in Emigration, Utah
  • Bedrooms in owner-occupied houses and condos in Emigration, Utah
  • 0no bedroom
  • 201 bedroom
  • 1312 bedrooms
  • 8263 bedrooms
  • 1,2074 bedrooms
  • 7565+ bedrooms
Bedrooms in renter-occupied apartments in Emigration, Utah
  • Bedrooms in renter-occupied apartments in Emigration, Utah
  • 0no bedroom
  • 171 bedroom
  • 252 bedrooms
  • 493 bedrooms
  • 514 bedrooms
  • 295+ bedrooms
Owner-occupied Renter-occupied
Cars and other vehicles available in Emigration in owner-occupied houses/condos
  • Cars and other vehicles available in Emigration in owner-occupied houses/condos
  • 42no vehicle
  • 5381 vehicle
  • 1,5492 vehicles
  • 6063 vehicles
  • 1254 vehicles
  • 805+ vehicles
Cars and other vehicles available in Emigration in renter-occupied apartments
  • Cars and other vehicles available in Emigration in renter-occupied apartments
  • 0no vehicle
  • 401 vehicle
  • 762 vehicles
  • 193 vehicles
  • 364 vehicles
  • 05+ vehicles
Owner-occupied Renter-occupied
Rooms in owner-occupied houses in Emigration, Utah
  • Rooms in owner-occupied houses in Emigration, Utah
  • 01 room
  • 72 rooms
  • 123 rooms
  • 284 rooms
  • 1405 rooms
  • 2886 rooms
  • 5017 rooms
  • 6468 rooms
  • 1,3189+ rooms
Rooms in renter-occupied apartments in Emigration, Utah
  • Rooms in renter-occupied apartments in Emigration, Utah
  • 01 room
  • 02 rooms
  • 163 rooms
  • 264 rooms
  • 165 rooms
  • 146 rooms
  • 187 rooms
  • 538 rooms
  • 289+ rooms
Year house built
Breakdown of mean house values by ages of householders
  • Emigration, UT household income distribution

  • Distribution of median household income in Emigration, UT in 2022
  • 22,483Less than $10,000
  • 31,505$10,000 to $19,999
  • 40,947$20,000 to $29,999
  • 47,604$30,000 to $39,999
  • 43,966$40,000 to $49,999
  • 51,511$50,000 to $59,999
  • 73,274$60,000 to $74,999
  • 110,583$75,000 to $99,999
  • 90,866$100,000 to $124,999
  • 69,498$125,000 to $149,999
  • 92,880$150,000 to $199,999
  • 103,241$200,000 or more

Percentage of workers working in this county: 94.3%
Number of people working at home: 1,138 (19.0% of all workers)

Travel time to work (commute)

  • Less than 5 minutes: 62
  • 5 to 9 minutes: 240
  • 10 to 14 minutes: 495
  • 15 to 19 minutes: 869
  • 20 to 24 minutes: 1,092
  • 25 to 29 minutes: 365
  • 30 to 34 minutes: 439
  • 35 to 39 minutes: 28
  • 40 to 44 minutes: 46
  • 45 to 59 minutes: 77
  • 60 to 89 minutes: 34
  • 90 or more minutes: 47

Means of transportation to work:

  • Drove a car alone: 3,372 (82.4%)
  • Carpooled: 318 (7.8%)
  • Bus or trolley bus: 62 (1.5%)
  • Motorcycle: 5 (0.1%)
  • Walked: 15 (0.4%)
  • Other means: 22 (0.5%)
  • Worked at home: 300 (7.3%)
Class of Workers in 2000
Year of entry for the foreign-born population in Emigration, Utah
  • Year of entry for the foreign-born population in Emigration, Utah
  • 461995 to March 2000
  • 1261990 to 1994
  • 421985 to 1989
  • 431980 to 1984
  • 751975 to 1979
  • 311970 to 1974
  • 721965 to 1969
  • 198Before 1965

Most common places of birth for foreign-born residents (%):

China, excluding Hong Kong and Taiwan
Emigration:

13.0% (82)
Utah:

2.0% (3,195)

Germany
Emigration:

9.8% (62)
Utah:

3.2% (5,086)

Canada
Emigration:

9.8% (62)
Utah:

4.9% (7,722)

Other Northern Europe
Emigration:

8.7% (55)
Utah:

1.0% (1,655)

United Kingdom
Emigration:

7.1% (45)
Utah:

3.0% (4,784)

Other Western Asia
Emigration:

6.5% (41)
Utah:

0.3% (523)

Ukraine
Emigration:

5.8% (37)
Utah:

0.3% (518)

Korea
Emigration:

5.2% (33)
Utah:

1.9% (3,013)

Brazil
Emigration:

4.3% (27)
Utah:

1.6% (2,507)

Czechoslovakia (includes Czech Republic and Slovakia)
Emigration:

3.0% (19)
Utah:

0.3% (460)

Other Eastern Europe
Emigration:

3.0% (19)
Utah:

0.6% (983)

Lebanon
Emigration:

2.5% (16)
Utah:

0.2% (339)

Honduras
Emigration:

2.5% (16)
Utah:

0.5% (865)

Taiwan
Emigration:

2.1% (13)
Utah:

0.7% (1,098)

Mexico
Emigration:

1.9% (12)
Utah:

41.9% (66,478)

Japan
Emigration:

1.7% (11)
Utah:

1.2% (1,908)

India
Emigration:

1.6% (10)
Utah:

1.3% (2,030)

Vietnam
Emigration:

1.6% (10)
Utah:

3.1% (4,920)

Place of birth for U.S.-born residents:

  • This state: 4,528
  • Other state: 3,385
  • Northeast: 632
  • Midwest: 904
  • South: 575
  • West: 1,274

66% of Emigration residents lived in the same house 5 years ago.
   Out of people who lived in different houses, 65% lived in this county.
   Out of people who lived in different counties, 9% lived in Utah.

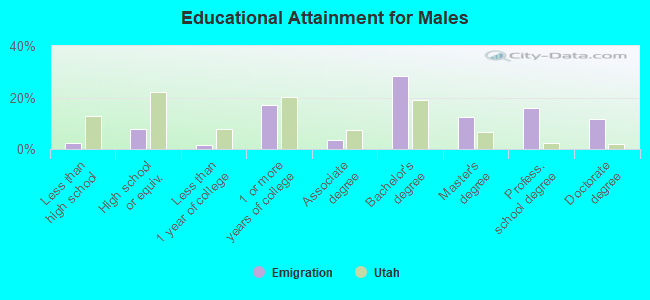
Education attainment for males 25 years and older:

  • No schooling: 16
  • Nursery to 4th grade: 0
  • 5th and 6th grade: 0
  • 7th and 8th grade: 0
  • 9th grade: 7
  • 10th grade: 21
  • 11th grade: 13
  • 12th grade, no diploma: 7
  • High school graduate (or equivalency): 221
  • Less than 1 year of college: 39
  • Some college more than 1 year, no degree: 484
  • Associate degree: 102
  • Bachelor's degree: 805
  • Master's degree: 359
  • Professional school degree: 450
  • Doctorate degree: 329
Educational Attainment for Males

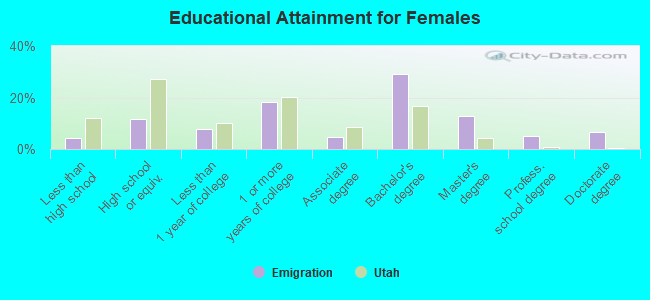
Education attainment for females 25 years and older:

  • No schooling: 0
  • Nursery to 4th grade: 9
  • 5th and 6th grade: 26
  • 7th and 8th grade: 8
  • 9th grade: 0
  • 10th grade: 30
  • 11th grade: 12
  • 12th grade, no diploma: 48
  • High school graduate (or equivalency): 355
  • Less than 1 year of college: 242
  • Some college more than 1 year, no degree: 560
  • Associate degree: 138
  • Bachelor's degree: 897
  • Master's degree: 389
  • Professional school degree: 157
  • Doctorate degree: 206
Educational Attainment for Females
Emigration marital status for males
Emigration marital status for females

Housing units in structures:

  • One, detached: 3,272
  • One, attached: 13
  • Two: 27
  • Boats, RVs, vans, etc.: 5
Housing units lacking complete plumbing facilities: 1.8%
Year householders moved into residence in Emigration
Houses and condos Apartments
Most commonly used house heating fuel in houses and condos in Emigration, UT
  • 97.3%Utility gas
  • 2.3%Electricity
  • 0.4%Bottled, tank, or LP gas
Most commonly used house heating fuel in apartments in Emigration, UT
  • 85.4%Utility gas
  • 14.6%Electricity

Private vs. public school enrollment:

Students in private schools in grades 1 to 8 (elementary and middle school): 167
Here:

16.9%
Utah:

4.2%

Students in private schools in grades 9 to 12 (high school): 86
Here:

14.7%
Utah:

3.9%

Students in private undergraduate colleges: 97
Here:

24.2%
Utah:

27.4%
School Enrollment by Level of School for Male Students
School Enrollment by Level of School for Female Students
Age and Sex of Sensory-Disabled Noninstitutionalized Residents
Age and Sex of Physically-Disabled Noninstitutionalized Residents
Age and Sex of Mentally-Disabled Noninstitutionalized Residents
Age and Sex of Self-Care Disabled Noninstitutionalized Residents
Age and Sex of Go-Outside-Home Disabled Noninstitutionalized Residents
Age and Sex of Noninstitutionalized Residents with Employment Disability