Erie, PA (Pennsylvania) Houses and Residents
Estimated median house or condo value in 2022: $98,200 (it was $64,700 in 2000 )
Erie:
$98,200Pennsylvania:
$245,500
Lower value quartile - upper value quartile: $68,600 - $144,500Mean price in 2022: Detached houses: $159,367 Here:
$159,367State:
$317,202
Townhouses or other attached units: $131,003 Here:
$131,003State:
$254,369
In 2-unit structures: $98,853 Here:
$98,853State:
$249,182
In 3-to-4-unit structures: $135,719 Here:
$135,719State:
$297,446
In 5-or-more-unit structures: $56,130 Here:
$56,130State:
$320,068
Mobile homes: $55,541 Here:
$55,541State:
$92,414
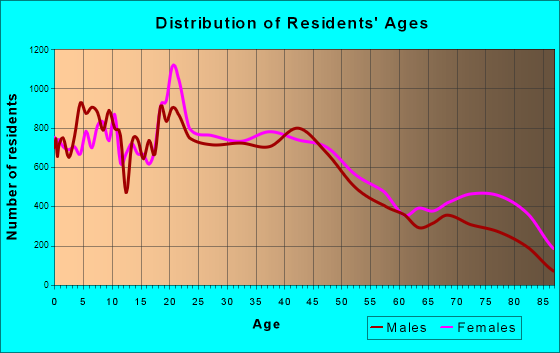
Total population: 99,452 (All urban)
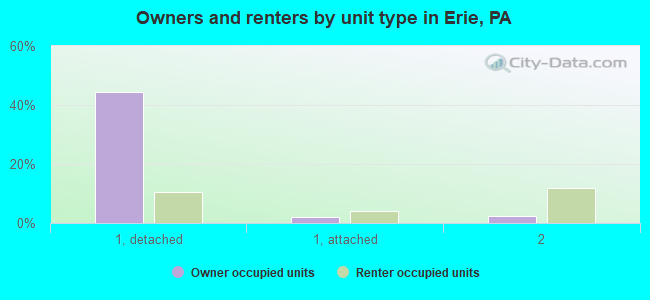
Houses: 44,034 (39,958 occupied: 22,095 owner occupied, 17,863 renter occupied )
% of renters here:
45%State:
31%
Housing density: 2,005 houses/condos per square mile
Median price asked for vacant for-sale houses and condos in 2022: $66,059.
Median contract rent in 2022: $621 (lower quartile is $486, upper quartile is $839)
Median rent asked for vacant for-rent units in 2022: $732
Median gross rent in Erie, PA in 2022: $781
Housing units in Erie with a mortgage: 11,443 (897 second mortgage, 70 home equity loan, 589 both second mortgage and home equity loan )Houses without a mortgage: 729
Median household income for houses/condos with a mortgage: $64,743
Median household income for apartments without a mortgage: $48,563
Median monthly housing costs: $775
Data:
Median house or condo value ($)
Median house or condo value ($ change since 2000)
Median house or condo value ($) - White
Median house or condo value ($) - Black or African American
Median house or condo value ($) - Asian
Median house or condo value ($) - Hispanic or Latino
Median house or condo value ($) - American Indian and Alaska Native
Median house or condo value ($) - Multirace
Median house or condo value ($) - Other Race
Median price asked for mobile homes ($)
Household density (households per square mile)
Mean house or condo value by units in structure - 1, detached ($)
Mean house or condo value by units in structure - 1, attached ($)
Mean house or condo value by units in structure - 2 ($)
Mean house or condo value by units in structure by units in structure - 3 or 4 ($)
Mean house or condo value by units in structure - 5 or more ($)
Mean house or condo value by units in structure - Boat, RV, van, etc. ($)
Mean house or condo value by units in structure - Mobile home ($)
Median contract rent ($)
Median contract rent - Lower quartile ($)
Median contract rent - Upper quartile ($)
Median gross rent ($)
Urban houses (%)
Rural houses (%)
Houses occupied (%)
Houses occupied (% change since 2000)
Houses owner occupied (%)
Houses owner occupied (% change since 2000)
Houses renter occupied (%)
Houses renter occupied (% change since 2000)
Vacant housing units - For rent (%)
Vacant housing units - For rent (% change since 2000)
Vacant housing units - For sale only (%)
Vacant housing units - For sale only (% change since 2000)
Vacant housing units - Rented or sold, not occupied (%)
Vacant housing units - Rented or sold, not occupied (% change since 2000)
Vacant housing units - For seasonal, recreational, or occasional use (%)
Vacant housing units - For seasonal, recreational, or occasional use (% change since 2000)
Vacant housing units - For migrant workers (%)
Vacant housing units - For migrant workers (% change since 2000)
Vacant housing units - Other vacant (%)
Vacant housing units - Other vacant (% change since 2000)
Median monthly housing costs ($)
Median household income for houses/condos with a mortgage ($)
Median household income for houses/condos without a mortgage ($)
Median household income ($)
Median household income ($) - White
Median household income ($) - Black or African American
Median household income ($) - Asian
Median household income ($) - Hispanic or Latino
Median household income ($) - American Indian and Alaska Native
Median household income ($) - Multirace
Median household income ($) - Other Race
Mortgage status - with mortgage (%)
Mortgage status - with second mortgage (%)
Mortgage status - with home equity loan (%)
Mortgage status - with both second mortgage and home equity loan (%)
Mortgage status - without a mortgage (%)
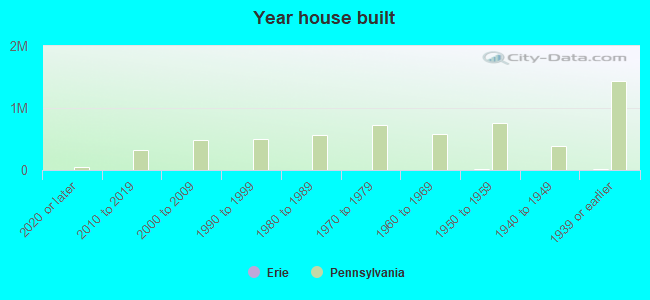
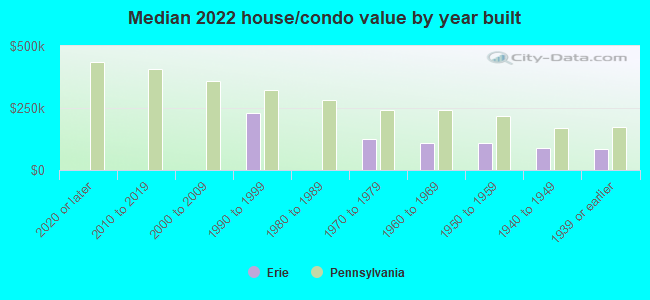
Median year house/condo built
Median year apartment built
Household type by relationship - Male householder living alone (%)
Household type by relationship - Male householder not living alone (%)
Household type by relationship - Female householder living alone (%)
Household type by relationship - Female householder not living alone (%)
Household type by relationship - Opposite-Sex spouse (%)
Household type by relationship - Same-Sex spouse (%)
Household type by relationship - Opposite-Sex unmarried partner (%)
Household type by relationship - Same-Sex unmarried partner (%)
Household type by relationship - In group quarters (%)
Size of family households - 2-person household (%)
Size of family households - 3-person household (%)
Size of family households - 4-person household (%)
Size of family households - 5-person household (%)
Size of family households - 6-person household (%)
Size of family households - 7-or-more-person household (%)
Size of nonfamily households - 1-person household (%)
Size of nonfamily households - 2-person household (%)
Size of nonfamily households - 3-person household (%)
Size of nonfamily households - 4-person household (%)
Size of nonfamily households - 5-person household (%)
Size of nonfamily households - 6-person household (%)
Size of nonfamily households - 7-or-moreperson household (%)
Year house built - Built 2010 or later (%)
Year house built - Built 2000 to 2009 (%)
Year house built - Built 1990 to 1999 (%)
Year house built - Built 1980 to 1989 (%)
Year house built - Built 1970 to 1979 (%)
Year house built - Built 1960 to 1969 (%)
Year house built - Built 1950 to 1959 (%)
Year house built - Built 1940 to 1949 (%)
Year house built - Built 1939 or earlier (%)
Median number of rooms in houses and condos
Median number of rooms in apartments
Median number of bedrooms in owner occupied houses
Mean number of bedrooms in owner occupied houses
Median number of bedrooms in renter occupied houses
Mean number of bedrooms in renter occupied houses
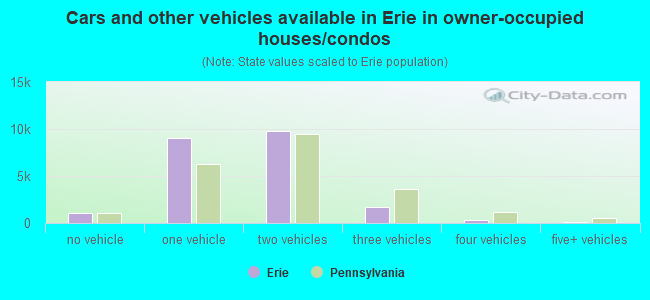
Median number of vehichles in owner occupied houses
Mean number of vehichles in owner occupied houses
Median number of vehichles in renter occupied houses
Mean number of vehichles in renter occupied houses
Rooms in owner-occupied houses - 1 room (%)
Rooms in owner-occupied houses - 2 rooms (%)
Rooms in owner-occupied houses - 3 rooms (%)
Rooms in owner-occupied houses - 4 rooms (%)
Rooms in owner-occupied houses - 5 rooms (%)
Rooms in owner-occupied houses - 6 rooms (%)
Rooms in owner-occupied houses - 7 rooms (%)
Rooms in owner-occupied houses - 8 rooms (%)
Rooms in owner-occupied houses - 9+ rooms (%)
Rooms in renter-occupied houses - 1 room (%)
Rooms in renter-occupied houses - 2 rooms (%)
Rooms in renter-occupied houses - 3 rooms (%)
Rooms in renter-occupied houses - 4 rooms (%)
Rooms in renter-occupied houses - 5 rooms (%)
Rooms in renter-occupied houses - 6 rooms (%)
Rooms in renter-occupied houses - 7 rooms (%)
Rooms in renter-occupied houses - 8 rooms (%)
Rooms in renter-occupied houses - 9+ rooms (%)
Bedrooms in owner-occupied houses - no bedrooms (%)
Bedrooms in owner-occupied houses - 1 bedroom (%)
Bedrooms in owner-occupied houses - 2 bedrooms (%)
Bedrooms in owner-occupied houses - 3 bedrooms (%)
Bedrooms in owner-occupied houses - 4 bedrooms (%)
Bedrooms in owner-occupied houses - 5+ bedrooms (%)
Bedrooms in renter-occupied houses - no bedrooms (%)
Bedrooms in renter-occupied houses - 1 bedroom (%)
Bedrooms in renter-occupied houses - 2 bedrooms (%)
Bedrooms in renter-occupied houses - 3 bedrooms (%)
Bedrooms in renter-occupied houses - 4 bedrooms (%)
Bedrooms in renter-occupied houses - 5+ bedrooms (%)
Vehicles available in owner-occupied houses - no vehicle available (%)
Vehicles available in owner-occupied houses - 1 vehicle available(%)
Vehicles available in owner-occupied houses - 2 Vehicles available (%)
Vehicles available in owner-occupied houses - 3 Vehicles available (%)
Vehicles available in owner-occupied houses - 4 Vehicles available (%)
Vehicles available in owner-occupied houses - 5+ Vehicles available (%)
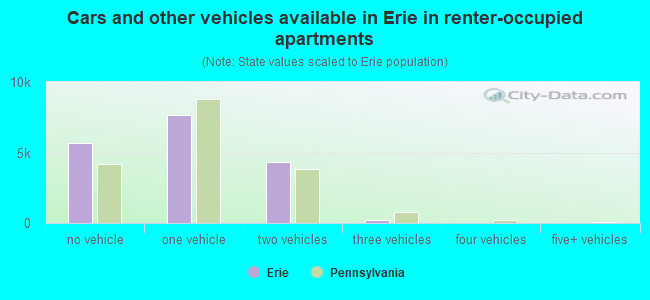
Vehicles available in renter-occupied houses - no vehicle available (%)
Vehicles available in renter-occupied houses - 1 vehicle available (%)
Vehicles available in renter-occupied houses - 2 Vehicles available (%)
Vehicles available in renter-occupied houses - 3 Vehicles available (%)
Vehicles available in renter-occupied houses - 4 Vehicles available (%)
Vehicles available in renter-occupied houses - 5+ Vehicles available (%)
Housing units in structures - 1, detached (%)
Housing units in structures - 1, attached (%)
Housing units in structures - 2 (%)
Housing units in structures - 3 or 4 (%)
Housing units in structures - 5 to 9 (%)
Housing units in structures - 10 to 19 (%)
Housing units in structures - 20 to 49 (%)
Housing units in structures - 50 or more (%)
Housing units in structures - Mobile home (%)
Housing units in structures - Boat, RV, van, etc. (%)
Housing units in structures - Owners - 1, detached (%)
Housing units in structures - Owners - 1, attached (%)
Housing units in structures - Owners - 2 (%)
Housing units in structures - Owners - 3 or 4 (%)
Housing units in structures - Owners - 5 to 9 (%)
Housing units in structures - Owners - 10 to 19 (%)
Housing units in structures - Owners - 20 to 49 (%)
Housing units in structures - Owners - 50 or more (%)
Housing units in structures - Owners - Mobile home (%)
Housing units in structures - Owners - Boat, RV, van, etc. (%)
Housing units in structures - Renters - 1, detached (%)
Housing units in structures - Renters - 1, attached (%)
Housing units in structures - Renters - 2 (%)
Housing units in structures - Renters - 3 or 4 (%)
Housing units in structures - Renters - 5 to 9 (%)
Housing units in structures - Renters - 10 to 19 (%)
Housing units in structures - Renters - 20 to 49 (%)
Housing units in structures - Renters - 50 or more (%)
Housing units in structures - Renters - Mobile home (%)
Housing units in structures - Renters - Boat, RV, van, etc. (%)
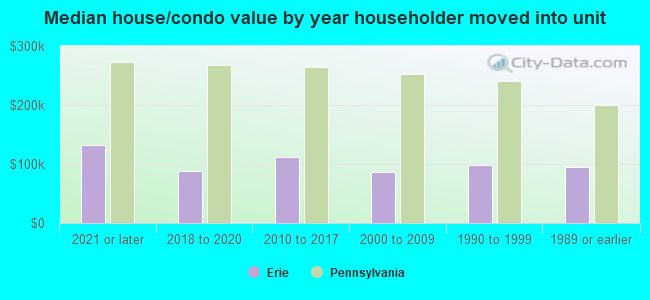
House/condo owner moved in on average (years ago)
Renter moved in on average (years ago)
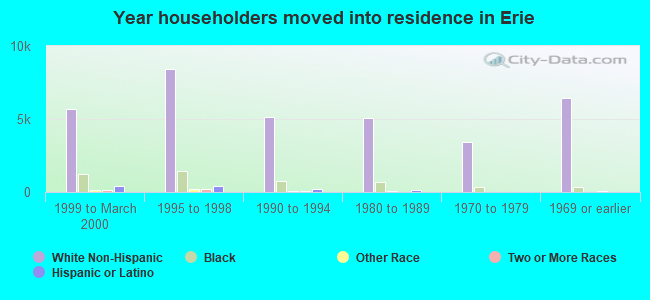
Year householder moved into unit - Moved in 1999 to March 2000 (%)
Year householder moved into unit - Moved in 1999 to March 2000 (%) - White
Year householder moved into unit - Moved in 1999 to March 2000 (%) - Black or African American
Year householder moved into unit - Moved in 1999 to March 2000 (%) - Asian
Year householder moved into unit - Moved in 1999 to March 2000 (%) - Hispanic or Latino
Year householder moved into unit - Moved in 1999 to March 2000 (%) - American Indian and Alaska Native
Year householder moved into unit - Moved in 1999 to March 2000 (%) - Multirace
Year householder moved into unit - Moved in 1999 to March 2000 (%) - Other Race
Year householder moved into unit - Moved in 1995 to 1998 (%)
Year householder moved into unit - Moved in 1995 to 1998 (%) - White
Year householder moved into unit - Moved in 1995 to 1998 (%) - Black or African American
Year householder moved into unit - Moved in 1995 to 1998 (%) - Asian
Year householder moved into unit - Moved in 1995 to 1998 (%) - Hispanic or Latino
Year householder moved into unit - Moved in 1995 to 1998 (%) - American Indian and Alaska Native
Year householder moved into unit - Moved in 1995 to 1998 (%) - Multirace
Year householder moved into unit - Moved in 1995 to 1998 (%) - Other Race
Year householder moved into unit - Moved in 1990 to 1994 (%)
Year householder moved into unit - Moved in 1990 to 1994 (%) - White
Year householder moved into unit - Moved in 1990 to 1994 (%) - Black or African American
Year householder moved into unit - Moved in 1990 to 1994 (%) - Asian
Year householder moved into unit - Moved in 1990 to 1994 (%) - Hispanic or Latino
Year householder moved into unit - Moved in 1990 to 1994 (%) - American Indian and Alaska Native
Year householder moved into unit - Moved in 1990 to 1994 (%) - Multirace
Year householder moved into unit - Moved in 1990 to 1994 (%) - Other Race
Year householder moved into unit - Moved in 1980 to 1989 (%)
Year householder moved into unit - Moved in 1980 to 1989 (%) - White
Year householder moved into unit - Moved in 1980 to 1989 (%) - Black or African American
Year householder moved into unit - Moved in 1980 to 1989 (%) - Asian
Year householder moved into unit - Moved in 1980 to 1989 (%) - Hispanic or Latino
Year householder moved into unit - Moved in 1980 to 1989 (%) - American Indian and Alaska Native
Year householder moved into unit - Moved in 1980 to 1989 (%) - Multirace
Year householder moved into unit - Moved in 1980 to 1989 (%) - Other Race
Year householder moved into unit - Moved in 1970 to 1979 (%)
Year householder moved into unit - Moved in 1970 to 1979 (%) - White
Year householder moved into unit - Moved in 1970 to 1979 (%) - Black or African American
Year householder moved into unit - Moved in 1970 to 1979 (%) - Asian
Year householder moved into unit - Moved in 1970 to 1979 (%) - Hispanic or Latino
Year householder moved into unit - Moved in 1970 to 1979 (%) - American Indian and Alaska Native
Year householder moved into unit - Moved in 1970 to 1979 (%) - Multirace
Year householder moved into unit - Moved in 1970 to 1979 (%) - Other Race
Year householder moved into unit - Moved in 1969 or earlier (%)
Year householder moved into unit - Moved in 1969 or earlier (%) - White
Year householder moved into unit - Moved in 1969 or earlier (%) - Black or African American
Year householder moved into unit - Moved in 1969 or earlier (%) - Asian
Year householder moved into unit - Moved in 1969 or earlier (%) - Hispanic or Latino
Year householder moved into unit - Moved in 1969 or earlier (%) - American Indian and Alaska Native
Year householder moved into unit - Moved in 1969 or earlier (%) - Multirace
Year householder moved into unit - Moved in 1969 or earlier (%) - Other Race
Housing units lacking complete plumbing facilities (%)
Housing units lacking complete kitchen facilities (%)
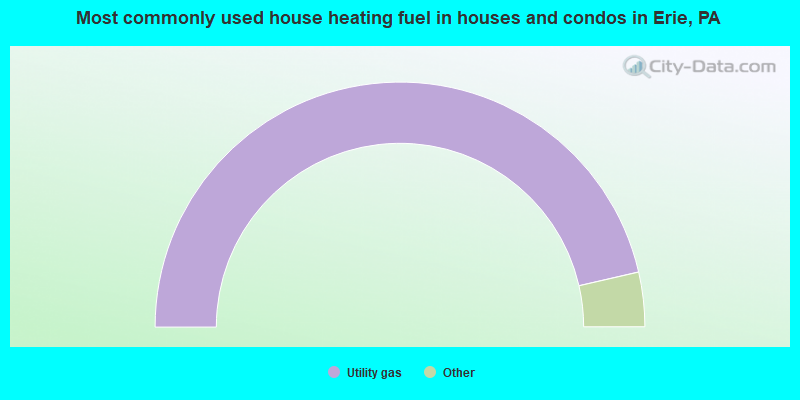
House heating fuel used in houses and condos - Utility gas (%)
House heating fuel used in houses and condos - Bottled, tank, or LP gas (%)
House heating fuel used in houses and condos - Electricity (%)
House heating fuel used in houses and condos - Fuel oil, kerosene, etc. (%)
House heating fuel used in houses and condos - Coal or coke (%)
House heating fuel used in houses and condos - Wood (%)
House heating fuel used in houses and condos - Solar energy (%)
House heating fuel used in houses and condos - Other fuel (%)
House heating fuel used in houses and condos - No fuel used (%)
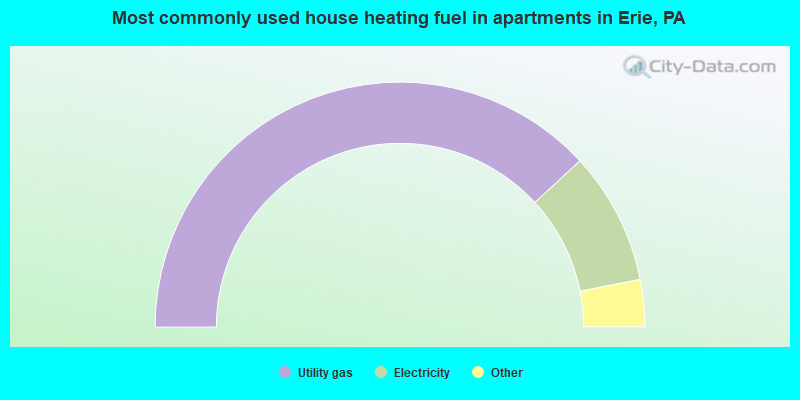
House heating fuel used in apartments - Utility gas (%)
House heating fuel used in apartments - Bottled, tank, or LP gas (%)
House heating fuel used in apartments - Electricity (%)
House heating fuel used in apartments - Fuel oil, kerosene, etc. (%)
House heating fuel used in apartments - Coal or coke (%)
House heating fuel used in apartments - Wood (%)
House heating fuel used in apartments - Solar energy (%)
House heating fuel used in apartments - Other fuel (%)
House heating fuel used in apartments - No fuel used (%)
Latest news about housing in Erie, PA collected exclusively by city-data.com from local newspapers, TV, and radio stations
Median year house/condo built: 1949Median year apartment built: 1953Household type by relationship:
Households: 93,517
Male householders: 18,720 (6,506 living alone ), Female householders: 21,238 (8,430 living alone )11,270 spouses (11,189 opposite-sex spouses ), 3,465 unmarried partners , (3,350 opposite-sex unmarried partners ), 23,926 children (22,512 natural , 898 adopted , 516 stepchildren ), 3,646 grandchildren , 726 brothers or sisters , 494 parents , 0 foster children , 584 other relatives , 3,285 non-relatives In group quarters: 6,163
Size of family households: 10,178 2-persons , 4,565 3-persons , 3,244 4-persons , 1,047 5-persons , 776 6-persons , 940 7-or-more-persons .
Size of nonfamily households: 14,936 1-person , 3,835 2-persons , 254 3-persons , 41 4-persons , 58 5-persons , 84 6-persons .
6,603 married couples with children. single-parent households (2,255 men , 6,425 women ).
88.1% of residents of Erie speak English at home. of residents speak Spanish at home (57% speak English very well , 19% speak English well , 20% speak English not well , 5% don't speak English at all ).of residents speak other Indo-European language at home (51% speak English very well , 23% speak English well , 16% speak English not well , 10% don't speak English at all ).of residents speak Asian or Pacific Island language at home (53% speak English very well , 16% speak English well , 30% speak English not well , 1% don't speak English at all ).of residents speak other language at home (58% speak English very well , 24% speak English well , 12% speak English not well , 6% don't speak English at all ).
Foreign born population: 6,191 (6.6%)of them are naturalized citizens )
Median number of rooms in houses and condos:
Median number of rooms in apartments
Owner-occupied Renter-occupied
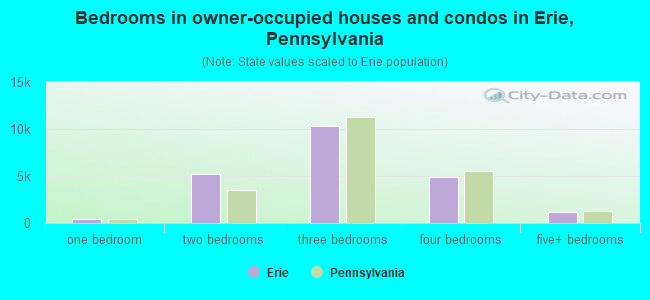
Bedrooms in owner-occupied houses and condos in Erie, Pennsylvania
0 no bedroom 467 1 bedroom 5,189 2 bedrooms 10,370 3 bedrooms 4,856 4 bedrooms 1,213 5+ bedrooms
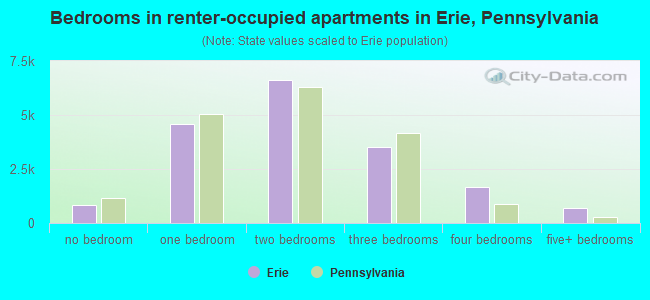
Bedrooms in renter-occupied apartments in Erie, Pennsylvania
814 no bedroom 4,571 1 bedroom 6,606 2 bedrooms 3,526 3 bedrooms 1,668 4 bedrooms 678 5+ bedrooms
Owner-occupied Renter-occupied
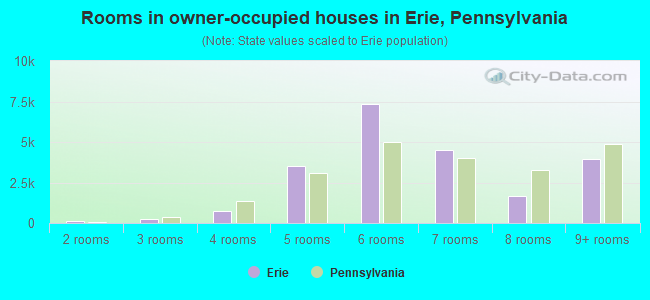
Rooms in owner-occupied houses in Erie, Pennsylvania
0 1 room 127 2 rooms 224 3 rooms 757 4 rooms 3,491 5 rooms 7,375 6 rooms 4,503 7 rooms 1,649 8 rooms 3,969 9+ rooms
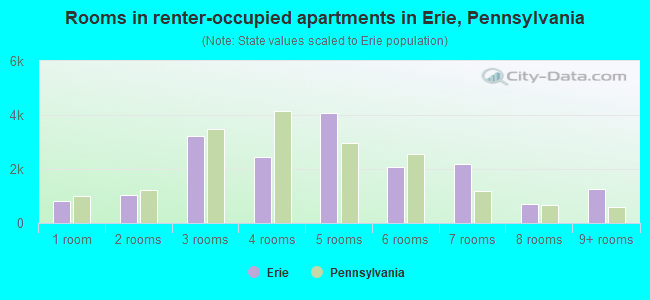
Rooms in renter-occupied apartments in Erie, Pennsylvania
814 1 room 1,054 2 rooms 3,218 3 rooms 2,458 4 rooms 4,082 5 rooms 2,088 6 rooms 2,195 7 rooms 691 8 rooms 1,263 9+ rooms
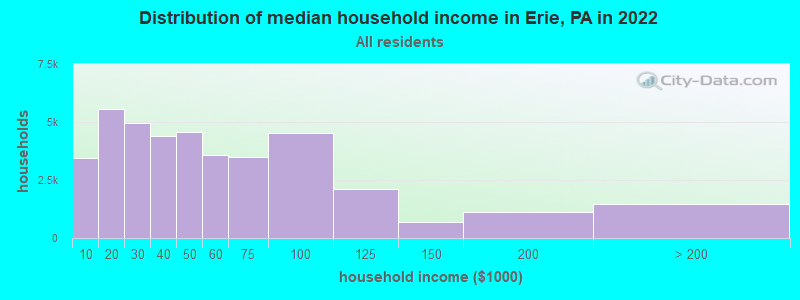
Erie, PA household income distribution 3,466 Less than $10,0005,573 $10,000 to $19,9994,968 $20,000 to $29,9994,393 $30,000 to $39,9994,589 $40,000 to $49,9993,564 $50,000 to $59,9993,482 $60,000 to $74,9994,520 $75,000 to $99,9992,093 $100,000 to $124,999706 $125,000 to $149,9991,131 $150,000 to $199,9991,473 $200,000 or more
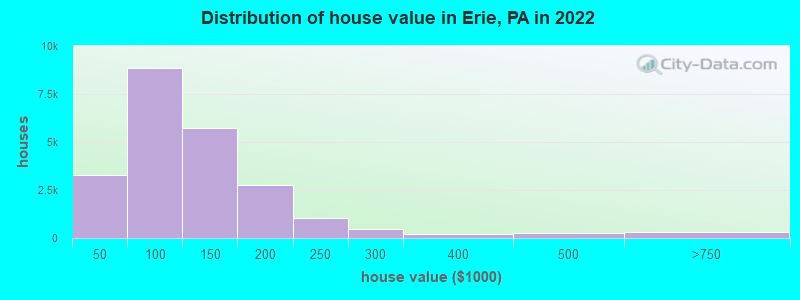
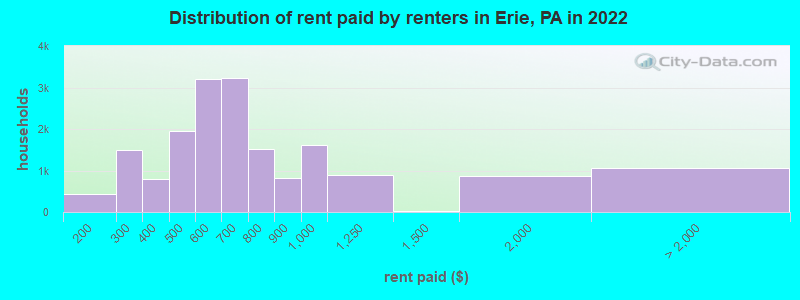
Home value of owner - occupied houses in 2022 in Erie, PA 289 Less than $10,00083 $10,000 to $14,999192 $15,000 to $19,999578 $20,000 to $24,99963 $25,000 to $29,999507 $30,000 to $34,999787 $35,000 to $39,999801 $40,000 to $49,9991,071 $50,000 to $59,9991,345 $60,000 to $69,9991,819 $70,000 to $79,9992,068 $80,000 to $89,9991,753 $90,000 to $99,9993,390 $100,000 to $124,9992,340 $125,000 to $149,9992,095 $150,000 to $174,999647 $175,000 to $199,9991,050 $200,000 to $249,999447 $250,000 to $299,999219 $300,000 to $399,999238 $400,000 to $499,999218 $500,000 to $749,99995 $750,000 to $999,999Rent paid by renters in 2022 in Erie, PA 257 $100 to $149173 $150 to $199609 $200 to $249886 $250 to $299341 $300 to $349447 $350 to $399667 $400 to $4491,274 $450 to $4991,424 $500 to $5491,788 $550 to $5991,783 $600 to $6491,443 $650 to $699683 $700 to $749829 $750 to $799811 $800 to $8991,604 $900 to $999884 $1,000 to $1,24935 $1,250 to $1,499865 $1,500 to $1,999100 $2,000 to $2,499328 $3,500 or more632 No cash rent
Percentage of workers working in this county: 97.5%Number of people working at home: 2,739 (6.7% of all workers )
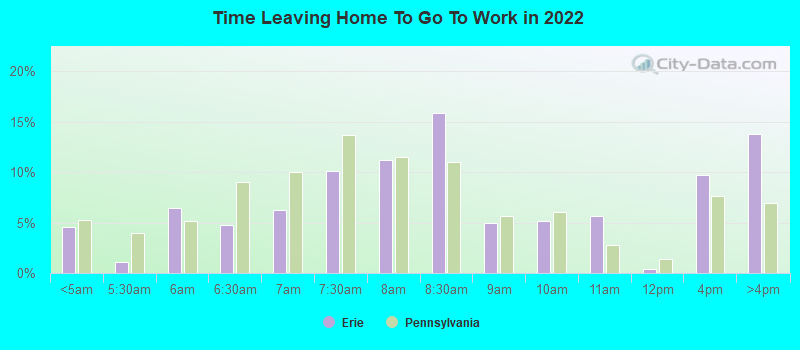
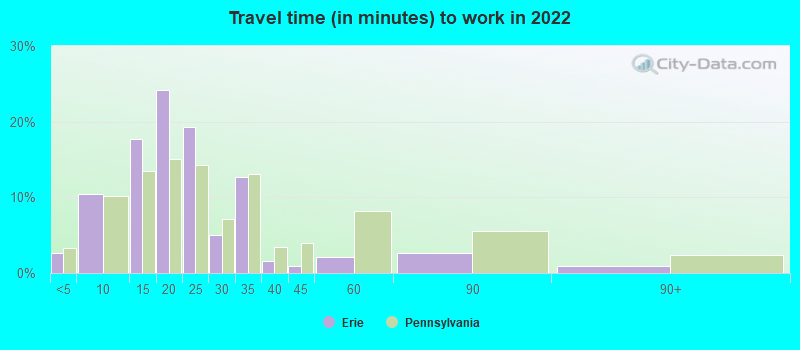
Travel time to work (commute)
Less than 5 minutes: 1,0575 to 9 minutes: 5,07310 to 14 minutes: 9,09215 to 19 minutes: 8,37920 to 24 minutes: 6,25225 to 29 minutes: 1,97830 to 34 minutes: 3,85835 to 39 minutes: 57740 to 44 minutes: 13045 to 59 minutes: 69460 to 89 minutes: 1,04490 or more minutes: 226
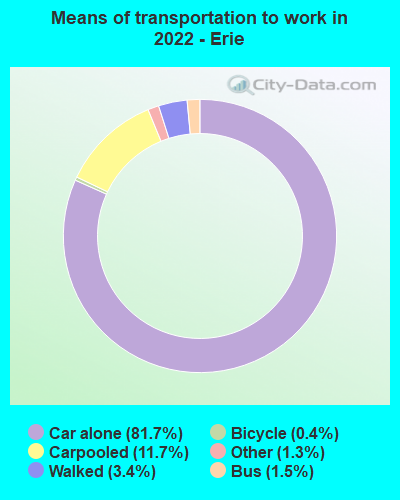
Means of transportation to work:
Drove a car alone: 40,527 (76.3%)Carpooled: 6,124 (11.5%)Bus : 401 (0.8%)Ferryboat: 15 (0.0%)Taxi: 1,074 (2.0%)Bicycle: 226 (0.4%)Walked: 1,841 (3.5%)Worked at home: 2,739 (5.2%)
Unemployment by race in 2022
Unemployment rate for White non-Hispanic residents 5.3% Males2.1% FemalesUnemployment rate for Asian residents 6.5% Males4.7% FemalesUnemployment rate for other race residents 8.6% Males1.7% FemalesUnemployment rate for two or more race residents 7.0% Males20.3% FemalesUnemployment rate for Hispanic or Latino residents 3.1% Males10.4% Females
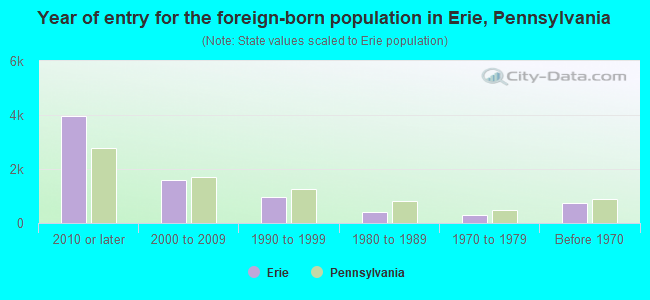
Year of entry for the foreign-born population in Erie, Pennsylvania
3,971 2010 or later 1,596 2000 to 2009 948 1990 to 1999 395 1980 to 1989 309 1970 to 1979 745 Before 1970
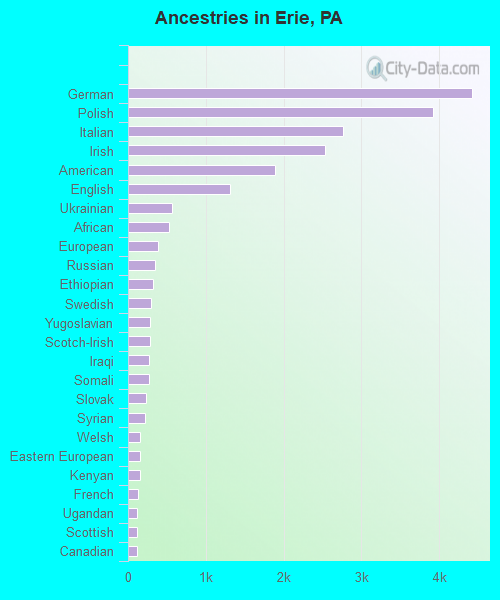
First ancestries reported:
German: 4,421 (11.1%)
Polish: 3,924 (9.8%)
Italian: 2,764 (6.9%)
Irish: 2,529 (6.3%)
American: 1,887 (4.7%)
English: 1,311 (3.3%)
Ukrainian: 562 (1.4%)
African: 531 (1.3%)
European: 390 (1.0%)
Russian: 345 (0.9%)
Ethiopian: 321 (0.8%)
Swedish: 297 (0.7%)
Yugoslavian: 284 (0.7%)
Scotch-Irish: 282 (0.7%)
Iraqi: 276 (0.7%)
Somali: 272 (0.7%)
Slovak: 226 (0.6%)
Syrian: 220 (0.6%)
Welsh: 159 (0.4%)
Eastern European: 156 (0.4%)
Kenyan: 150 (0.4%)
French: 128 (0.3%)
Ugandan: 114 (0.3%)
Scottish: 114 (0.3%)
Canadian: 113 (0.3%)
Sudanese: 93 (0.2%)
Arab: 89 (0.2%)
Jamaican: 79 (0.2%)
Lithuanian: 76 (0.2%)
Albanian: 68 (0.2%)
Pennsylvania German: 64 (0.2%)
Czech: 62 (0.2%)
Moroccan: 61 (0.2%)
Slavic: 60 (0.2%)
Croatian: 55 (0.1%)
Assyrian: 54 (0.1%)
Armenian: 52 (0.1%)
Dutch: 49 (0.1%)
French Canadian: 46 (0.1%)
Palestinian: 45 (0.1%)
Haitian: 42 (0.1%)
Lebanese: 40 (0.1%)
Hungarian: 40 (0.1%)
Norwegian: 34 (0.09%)
British: 31 (0.08%)
Bulgarian: 29 (0.07%)
Danish: 28 (0.07%)
Czechoslovakian: 26 (0.07%)
Romanian: 26 (0.07%)
Belgian: 22 (0.06%)
Iranian: 21 (0.05%)
Egyptian: 17 (0.04%)
Scandinavian: 17 (0.04%)
Portuguese: 14 (0.04%)
Carpatho Rusyn: 13 (0.03%)
Senegalese: 10 (0.03%)
Afghan: 10 (0.03%)
Northern European: 8 (0.02%)
Nigerian: 8 (0.02%)
Guyanese: 7 (0.02%)
Greek: 7 (0.02%)
Austrian: 6 (0.02%)
Basque: 4 (0.01%)
Most common places of birth for foreign-born residents (%): Nepal Erie:
11.3% (762)Pennsylvania:
0.7% (6,855)
Bhutan Erie:
10.6% (714)Pennsylvania:
0.8% (7,882)
Kenya Erie:
8.0% (537)Pennsylvania:
0.5% (4,946)
Ukraine Erie:
7.8% (527)Pennsylvania:
2.1% (19,841)
Bosnia and Herzegovina Erie:
6.4% (432)Pennsylvania:
0.3% (3,273)
Mexico Erie:
5.7% (387)Pennsylvania:
5.8% (54,190)
Peru Erie:
5.4% (365)Pennsylvania:
0.7% (6,690)
Syria Erie:
3.2% (217)Pennsylvania:
0.5% (5,121)
Canada Erie:
2.8% (189)Pennsylvania:
1.8% (17,032)
Iraq Erie:
2.8% (188)Pennsylvania:
0.3% (2,395)
Dominican Republic Erie:
2.6% (172)Pennsylvania:
9.2% (86,544)
Ethiopia Erie:
2.4% (163)Pennsylvania:
0.5% (4,658)
Philippines Erie:
2.2% (148)Pennsylvania:
2.2% (21,039)
Saudi Arabia Erie:
1.9% (130)Pennsylvania:
0.3% (2,533)
Vietnam Erie:
1.6% (108)Pennsylvania:
3.3% (31,542)
Place of birth for U.S.-born residents:
This state: 68,316Other state: 16,889Northeast: 5,242Midwest: 3,388South: 6,270West: 1,989 83.2% of Erie residents lived in the same house 1 years ago.
Out of people who lived in different houses, 41.5% lived in this county.
Out of people who lived in different counties, 32.9% lived in Pennsylvania.
Erie:
83.2%State average:
89.3%
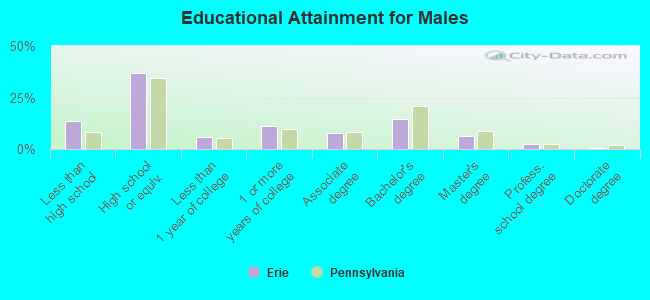
Education attainment for males 25 years and older:
No schooling: 450Nursery to 4th grade: 425th and 6th grade: 07th and 8th grade: 2939th grade: 63810th grade: 92711th grade: 74712th grade, no diploma: 807High school graduate (or equivalency): 10,702Less than 1 year of college: 1,729Some college more than 1 year, no degree: 3,197Associate degree: 2,263Bachelor's degree: 4,239Master's degree: 1,886Professional school degree: 759Doctorate degree: 145
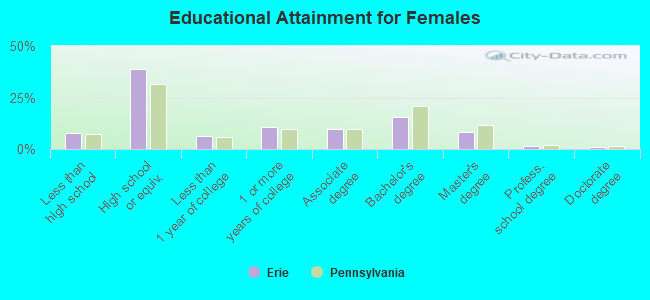
Education attainment for females 25 years and older:
No schooling: 587Nursery to 4th grade: 1425th and 6th grade: 07th and 8th grade: 1769th grade: 4010th grade: 29111th grade: 47612th grade, no diploma: 852High school graduate (or equivalency): 12,539Less than 1 year of college: 2,047Some college more than 1 year, no degree: 3,468Associate degree: 3,206Bachelor's degree: 4,940Master's degree: 2,613Professional school degree: 490Doctorate degree: 357
Housing units in structures:
One, detached: 26,542One, attached: 1,907Two: 5,9543 or 4: 3,3795 to 9: 1,13110 to 19: 1,33220 to 49: 76950 or more: 2,893Mobile homes: 127Housing units lacking complete plumbing facilities in 2022: 2.7%Housing units lacking complete kitchen facilities in 2022: 4.0%House/condo owner moved in on average 16 years ago
Renter moved in on average 3 years ago
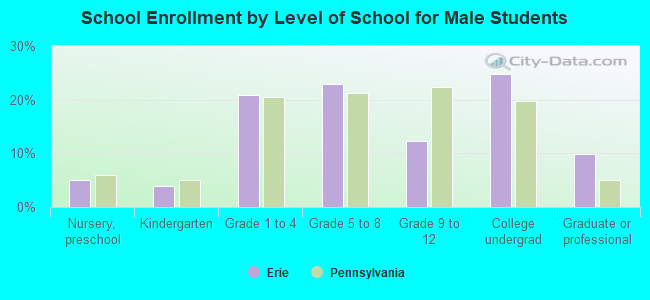
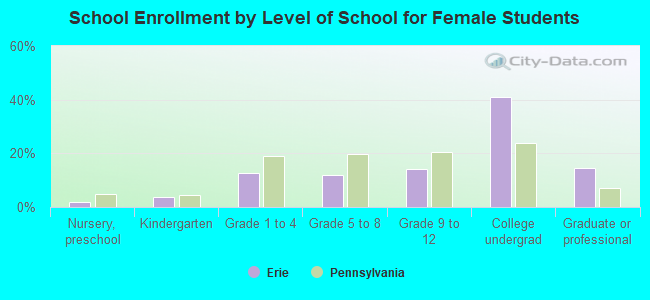
Private vs. public school enrollment:
Students in private schools in grades 1 to 8 (elementary and middle school): 973 Here:
11.1%Pennsylvania:
15.7%
Students in private schools in grades 9 to 12 (high school): 527 Here:
15.3%Pennsylvania:
13.4%
Students in private undergraduate colleges: 4,768 Here:
55.4%Pennsylvania:
39.8%