Evanston, IL (Illinois) Houses and Residents
Estimated median house or condo value in 2022: $448,600 (it was $229,500 in 2000 )
Evanston:
$448,600Illinois:
$251,600
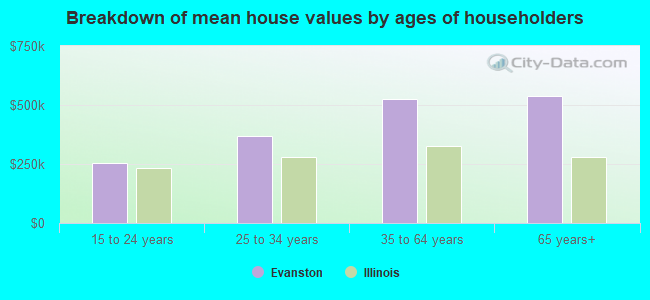
Lower value quartile - upper value quartile: $281,400 - $770,000Mean price in 2022: Detached houses: $655,275 Here:
$655,275State:
$310,164
Townhouses or other attached units: $455,588 Here:
$455,588State:
$286,230
In 2-unit structures: $403,382 Here:
$403,382State:
$299,638
In 3-to-4-unit structures: $539,524 Here:
$539,524State:
$330,907
In 5-or-more-unit structures: $328,239 Here:
$328,239State:
$318,887
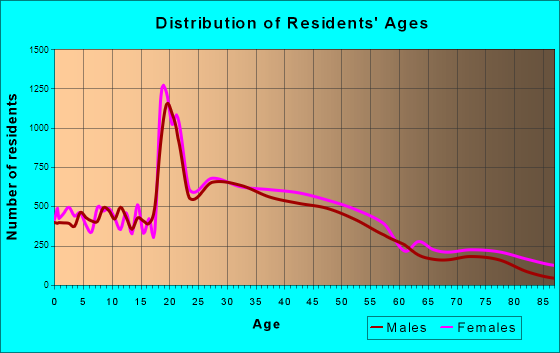
Total population: 75,658 (Urban population: 74,239, Rural population: 0)
Houses: 35,929 (33,257 occupied: 18,732 owner occupied, 14,525 renter occupied )
% of renters here:
44%State:
33%
Housing density: 4,638 houses/condos per square mile
Median price asked for vacant for-sale houses and condos in 2022: $234,893.
Median contract rent in 2022: $1,448 (lower quartile is $1,086, upper quartile is $1,886)
Median rent asked for vacant for-rent units in 2022: $1,929
Median gross rent in Evanston, IL in 2022: $1,561
Housing units in Evanston with a mortgage: 12,363 (1,086 second mortgage, 0 home equity loan, 934 both second mortgage and home equity loan )Houses without a mortgage: 298
Median household income for houses/condos with a mortgage: $150,140
Median household income for apartments without a mortgage: $119,936
Median monthly housing costs: $1,755
Data:
Median house or condo value ($)
Median house or condo value ($ change since 2000)
Median house or condo value ($) - White
Median house or condo value ($) - Black or African American
Median house or condo value ($) - Asian
Median house or condo value ($) - Hispanic or Latino
Median house or condo value ($) - American Indian and Alaska Native
Median house or condo value ($) - Multirace
Median house or condo value ($) - Other Race
Median price asked for mobile homes ($)
Household density (households per square mile)
Mean house or condo value by units in structure - 1, detached ($)
Mean house or condo value by units in structure - 1, attached ($)
Mean house or condo value by units in structure - 2 ($)
Mean house or condo value by units in structure by units in structure - 3 or 4 ($)
Mean house or condo value by units in structure - 5 or more ($)
Mean house or condo value by units in structure - Boat, RV, van, etc. ($)
Mean house or condo value by units in structure - Mobile home ($)
Median contract rent ($)
Median contract rent - Lower quartile ($)
Median contract rent - Upper quartile ($)
Median gross rent ($)
Urban houses (%)
Rural houses (%)
Houses occupied (%)
Houses occupied (% change since 2000)
Houses owner occupied (%)
Houses owner occupied (% change since 2000)
Houses renter occupied (%)
Houses renter occupied (% change since 2000)
Vacant housing units - For rent (%)
Vacant housing units - For rent (% change since 2000)
Vacant housing units - For sale only (%)
Vacant housing units - For sale only (% change since 2000)
Vacant housing units - Rented or sold, not occupied (%)
Vacant housing units - Rented or sold, not occupied (% change since 2000)
Vacant housing units - For seasonal, recreational, or occasional use (%)
Vacant housing units - For seasonal, recreational, or occasional use (% change since 2000)
Vacant housing units - For migrant workers (%)
Vacant housing units - For migrant workers (% change since 2000)
Vacant housing units - Other vacant (%)
Vacant housing units - Other vacant (% change since 2000)
Median monthly housing costs ($)
Median household income for houses/condos with a mortgage ($)
Median household income for houses/condos without a mortgage ($)
Median household income ($)
Median household income ($) - White
Median household income ($) - Black or African American
Median household income ($) - Asian
Median household income ($) - Hispanic or Latino
Median household income ($) - American Indian and Alaska Native
Median household income ($) - Multirace
Median household income ($) - Other Race
Mortgage status - with mortgage (%)
Mortgage status - with second mortgage (%)
Mortgage status - with home equity loan (%)
Mortgage status - with both second mortgage and home equity loan (%)
Mortgage status - without a mortgage (%)
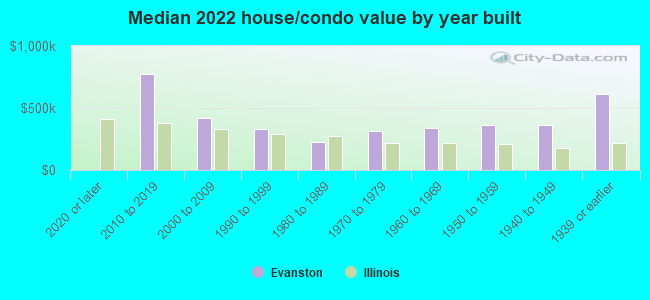
Median year house/condo built
Median year apartment built
Household type by relationship - Male householder living alone (%)
Household type by relationship - Male householder not living alone (%)
Household type by relationship - Female householder living alone (%)
Household type by relationship - Female householder not living alone (%)
Household type by relationship - Opposite-Sex spouse (%)
Household type by relationship - Same-Sex spouse (%)
Household type by relationship - Opposite-Sex unmarried partner (%)
Household type by relationship - Same-Sex unmarried partner (%)
Household type by relationship - In group quarters (%)
Size of family households - 2-person household (%)
Size of family households - 3-person household (%)
Size of family households - 4-person household (%)
Size of family households - 5-person household (%)
Size of family households - 6-person household (%)
Size of family households - 7-or-more-person household (%)
Size of nonfamily households - 1-person household (%)
Size of nonfamily households - 2-person household (%)
Size of nonfamily households - 3-person household (%)
Size of nonfamily households - 4-person household (%)
Size of nonfamily households - 5-person household (%)
Size of nonfamily households - 6-person household (%)
Size of nonfamily households - 7-or-moreperson household (%)
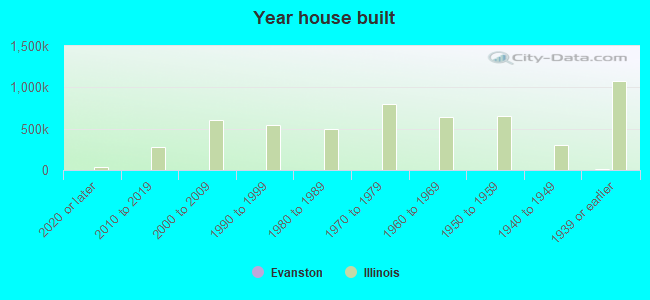
Year house built - Built 2010 or later (%)
Year house built - Built 2000 to 2009 (%)
Year house built - Built 1990 to 1999 (%)
Year house built - Built 1980 to 1989 (%)
Year house built - Built 1970 to 1979 (%)
Year house built - Built 1960 to 1969 (%)
Year house built - Built 1950 to 1959 (%)
Year house built - Built 1940 to 1949 (%)
Year house built - Built 1939 or earlier (%)
Median number of rooms in houses and condos
Median number of rooms in apartments
Median number of bedrooms in owner occupied houses
Mean number of bedrooms in owner occupied houses
Median number of bedrooms in renter occupied houses
Mean number of bedrooms in renter occupied houses
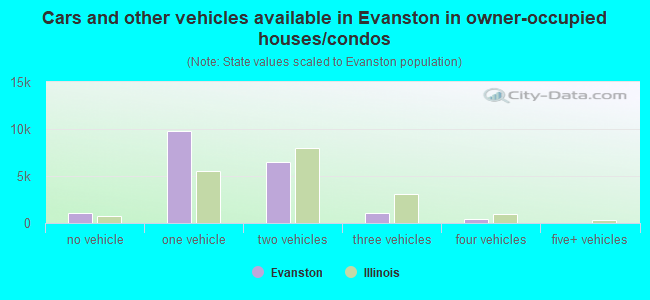
Median number of vehichles in owner occupied houses
Mean number of vehichles in owner occupied houses
Median number of vehichles in renter occupied houses
Mean number of vehichles in renter occupied houses
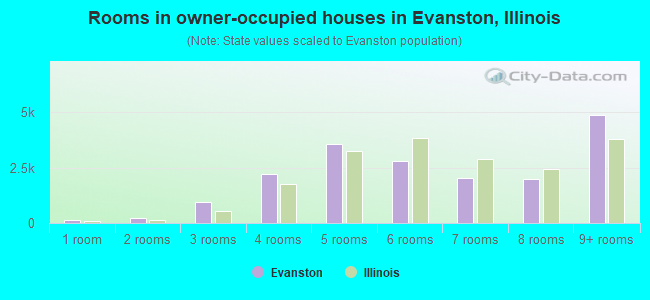
Rooms in owner-occupied houses - 1 room (%)
Rooms in owner-occupied houses - 2 rooms (%)
Rooms in owner-occupied houses - 3 rooms (%)
Rooms in owner-occupied houses - 4 rooms (%)
Rooms in owner-occupied houses - 5 rooms (%)
Rooms in owner-occupied houses - 6 rooms (%)
Rooms in owner-occupied houses - 7 rooms (%)
Rooms in owner-occupied houses - 8 rooms (%)
Rooms in owner-occupied houses - 9+ rooms (%)
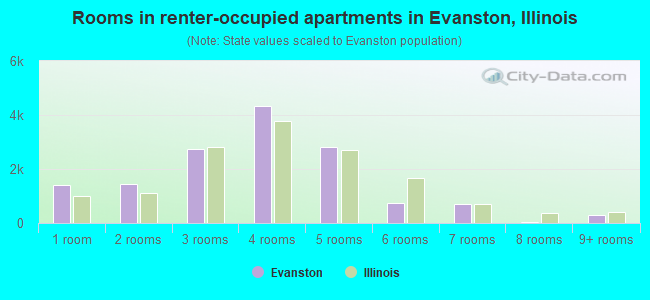
Rooms in renter-occupied houses - 1 room (%)
Rooms in renter-occupied houses - 2 rooms (%)
Rooms in renter-occupied houses - 3 rooms (%)
Rooms in renter-occupied houses - 4 rooms (%)
Rooms in renter-occupied houses - 5 rooms (%)
Rooms in renter-occupied houses - 6 rooms (%)
Rooms in renter-occupied houses - 7 rooms (%)
Rooms in renter-occupied houses - 8 rooms (%)
Rooms in renter-occupied houses - 9+ rooms (%)
Bedrooms in owner-occupied houses - no bedrooms (%)
Bedrooms in owner-occupied houses - 1 bedroom (%)
Bedrooms in owner-occupied houses - 2 bedrooms (%)
Bedrooms in owner-occupied houses - 3 bedrooms (%)
Bedrooms in owner-occupied houses - 4 bedrooms (%)
Bedrooms in owner-occupied houses - 5+ bedrooms (%)
Bedrooms in renter-occupied houses - no bedrooms (%)
Bedrooms in renter-occupied houses - 1 bedroom (%)
Bedrooms in renter-occupied houses - 2 bedrooms (%)
Bedrooms in renter-occupied houses - 3 bedrooms (%)
Bedrooms in renter-occupied houses - 4 bedrooms (%)
Bedrooms in renter-occupied houses - 5+ bedrooms (%)
Vehicles available in owner-occupied houses - no vehicle available (%)
Vehicles available in owner-occupied houses - 1 vehicle available(%)
Vehicles available in owner-occupied houses - 2 Vehicles available (%)
Vehicles available in owner-occupied houses - 3 Vehicles available (%)
Vehicles available in owner-occupied houses - 4 Vehicles available (%)
Vehicles available in owner-occupied houses - 5+ Vehicles available (%)
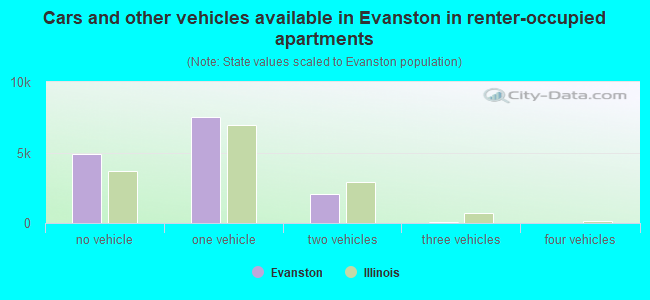
Vehicles available in renter-occupied houses - no vehicle available (%)
Vehicles available in renter-occupied houses - 1 vehicle available (%)
Vehicles available in renter-occupied houses - 2 Vehicles available (%)
Vehicles available in renter-occupied houses - 3 Vehicles available (%)
Vehicles available in renter-occupied houses - 4 Vehicles available (%)
Vehicles available in renter-occupied houses - 5+ Vehicles available (%)
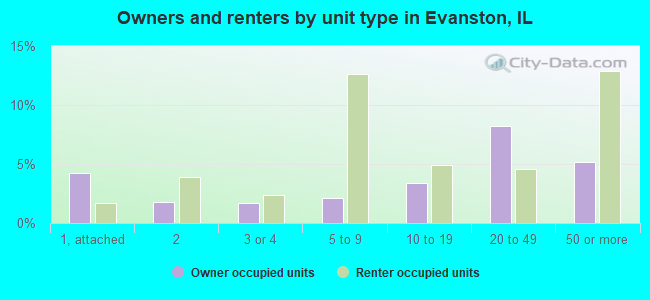
Housing units in structures - 1, detached (%)
Housing units in structures - 1, attached (%)
Housing units in structures - 2 (%)
Housing units in structures - 3 or 4 (%)
Housing units in structures - 5 to 9 (%)
Housing units in structures - 10 to 19 (%)
Housing units in structures - 20 to 49 (%)
Housing units in structures - 50 or more (%)
Housing units in structures - Mobile home (%)
Housing units in structures - Boat, RV, van, etc. (%)
Housing units in structures - Owners - 1, detached (%)
Housing units in structures - Owners - 1, attached (%)
Housing units in structures - Owners - 2 (%)
Housing units in structures - Owners - 3 or 4 (%)
Housing units in structures - Owners - 5 to 9 (%)
Housing units in structures - Owners - 10 to 19 (%)
Housing units in structures - Owners - 20 to 49 (%)
Housing units in structures - Owners - 50 or more (%)
Housing units in structures - Owners - Mobile home (%)
Housing units in structures - Owners - Boat, RV, van, etc. (%)
Housing units in structures - Renters - 1, detached (%)
Housing units in structures - Renters - 1, attached (%)
Housing units in structures - Renters - 2 (%)
Housing units in structures - Renters - 3 or 4 (%)
Housing units in structures - Renters - 5 to 9 (%)
Housing units in structures - Renters - 10 to 19 (%)
Housing units in structures - Renters - 20 to 49 (%)
Housing units in structures - Renters - 50 or more (%)
Housing units in structures - Renters - Mobile home (%)
Housing units in structures - Renters - Boat, RV, van, etc. (%)
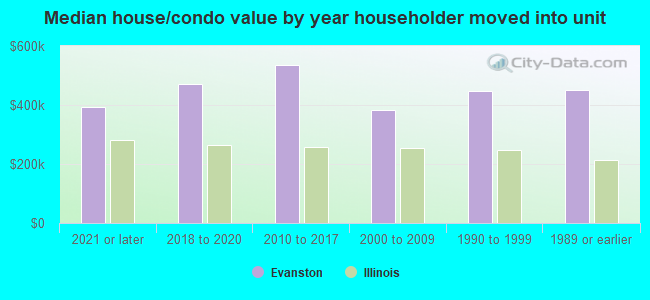
House/condo owner moved in on average (years ago)
Renter moved in on average (years ago)
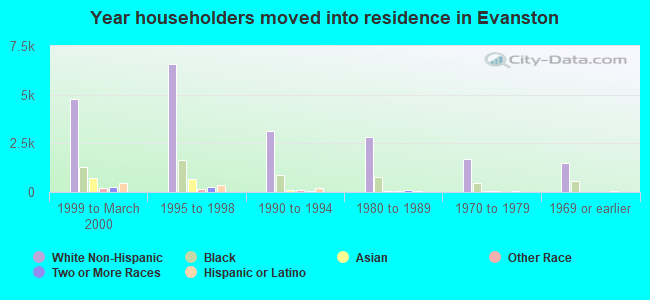
Year householder moved into unit - Moved in 1999 to March 2000 (%)
Year householder moved into unit - Moved in 1999 to March 2000 (%) - White
Year householder moved into unit - Moved in 1999 to March 2000 (%) - Black or African American
Year householder moved into unit - Moved in 1999 to March 2000 (%) - Asian
Year householder moved into unit - Moved in 1999 to March 2000 (%) - Hispanic or Latino
Year householder moved into unit - Moved in 1999 to March 2000 (%) - American Indian and Alaska Native
Year householder moved into unit - Moved in 1999 to March 2000 (%) - Multirace
Year householder moved into unit - Moved in 1999 to March 2000 (%) - Other Race
Year householder moved into unit - Moved in 1995 to 1998 (%)
Year householder moved into unit - Moved in 1995 to 1998 (%) - White
Year householder moved into unit - Moved in 1995 to 1998 (%) - Black or African American
Year householder moved into unit - Moved in 1995 to 1998 (%) - Asian
Year householder moved into unit - Moved in 1995 to 1998 (%) - Hispanic or Latino
Year householder moved into unit - Moved in 1995 to 1998 (%) - American Indian and Alaska Native
Year householder moved into unit - Moved in 1995 to 1998 (%) - Multirace
Year householder moved into unit - Moved in 1995 to 1998 (%) - Other Race
Year householder moved into unit - Moved in 1990 to 1994 (%)
Year householder moved into unit - Moved in 1990 to 1994 (%) - White
Year householder moved into unit - Moved in 1990 to 1994 (%) - Black or African American
Year householder moved into unit - Moved in 1990 to 1994 (%) - Asian
Year householder moved into unit - Moved in 1990 to 1994 (%) - Hispanic or Latino
Year householder moved into unit - Moved in 1990 to 1994 (%) - American Indian and Alaska Native
Year householder moved into unit - Moved in 1990 to 1994 (%) - Multirace
Year householder moved into unit - Moved in 1990 to 1994 (%) - Other Race
Year householder moved into unit - Moved in 1980 to 1989 (%)
Year householder moved into unit - Moved in 1980 to 1989 (%) - White
Year householder moved into unit - Moved in 1980 to 1989 (%) - Black or African American
Year householder moved into unit - Moved in 1980 to 1989 (%) - Asian
Year householder moved into unit - Moved in 1980 to 1989 (%) - Hispanic or Latino
Year householder moved into unit - Moved in 1980 to 1989 (%) - American Indian and Alaska Native
Year householder moved into unit - Moved in 1980 to 1989 (%) - Multirace
Year householder moved into unit - Moved in 1980 to 1989 (%) - Other Race
Year householder moved into unit - Moved in 1970 to 1979 (%)
Year householder moved into unit - Moved in 1970 to 1979 (%) - White
Year householder moved into unit - Moved in 1970 to 1979 (%) - Black or African American
Year householder moved into unit - Moved in 1970 to 1979 (%) - Asian
Year householder moved into unit - Moved in 1970 to 1979 (%) - Hispanic or Latino
Year householder moved into unit - Moved in 1970 to 1979 (%) - American Indian and Alaska Native
Year householder moved into unit - Moved in 1970 to 1979 (%) - Multirace
Year householder moved into unit - Moved in 1970 to 1979 (%) - Other Race
Year householder moved into unit - Moved in 1969 or earlier (%)
Year householder moved into unit - Moved in 1969 or earlier (%) - White
Year householder moved into unit - Moved in 1969 or earlier (%) - Black or African American
Year householder moved into unit - Moved in 1969 or earlier (%) - Asian
Year householder moved into unit - Moved in 1969 or earlier (%) - Hispanic or Latino
Year householder moved into unit - Moved in 1969 or earlier (%) - American Indian and Alaska Native
Year householder moved into unit - Moved in 1969 or earlier (%) - Multirace
Year householder moved into unit - Moved in 1969 or earlier (%) - Other Race
Housing units lacking complete plumbing facilities (%)
Housing units lacking complete kitchen facilities (%)
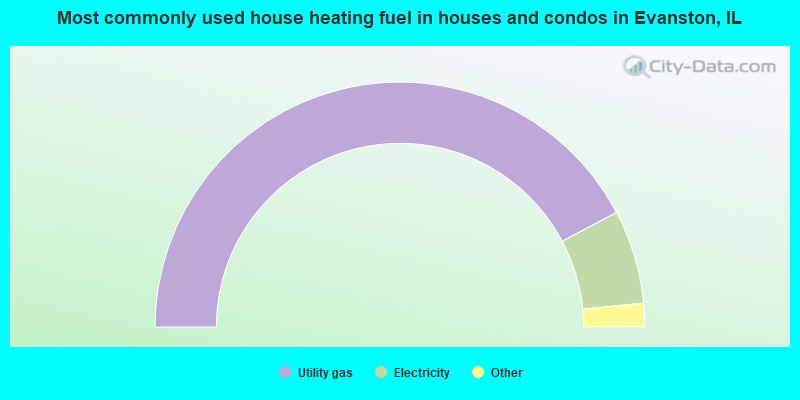
House heating fuel used in houses and condos - Utility gas (%)
House heating fuel used in houses and condos - Bottled, tank, or LP gas (%)
House heating fuel used in houses and condos - Electricity (%)
House heating fuel used in houses and condos - Fuel oil, kerosene, etc. (%)
House heating fuel used in houses and condos - Coal or coke (%)
House heating fuel used in houses and condos - Wood (%)
House heating fuel used in houses and condos - Solar energy (%)
House heating fuel used in houses and condos - Other fuel (%)
House heating fuel used in houses and condos - No fuel used (%)
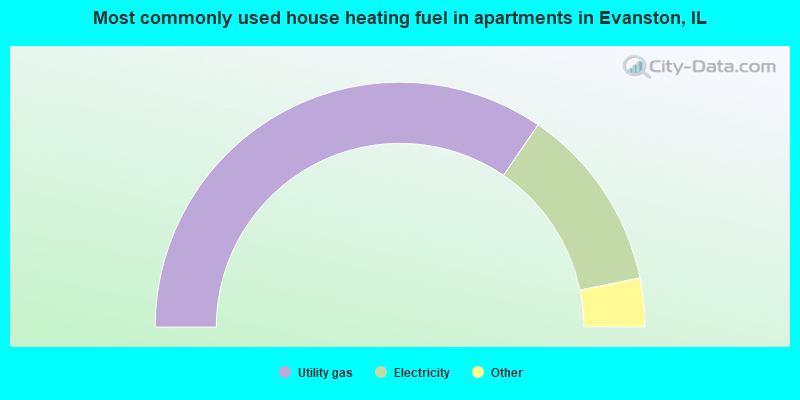
House heating fuel used in apartments - Utility gas (%)
House heating fuel used in apartments - Bottled, tank, or LP gas (%)
House heating fuel used in apartments - Electricity (%)
House heating fuel used in apartments - Fuel oil, kerosene, etc. (%)
House heating fuel used in apartments - Coal or coke (%)
House heating fuel used in apartments - Wood (%)
House heating fuel used in apartments - Solar energy (%)
House heating fuel used in apartments - Other fuel (%)
House heating fuel used in apartments - No fuel used (%)
Latest news about housing in Evanston, IL collected exclusively by city-data.com from local newspapers, TV, and radio stations
Median year house/condo built: 1938Median year apartment built: 1963Household type by relationship:
Households: 75,538
Male householders: 15,775 (6,711 living alone ), Female householders: 17,482 (7,266 living alone )12,323 spouses (12,021 opposite-sex spouses ), 1,592 unmarried partners , (1,473 opposite-sex unmarried partners ), 17,294 children (16,207 natural , 742 adopted , 345 stepchildren ), 952 grandchildren , 127 brothers or sisters , 543 parents , 0 foster children , 430 other relatives , 2,383 non-relatives In group quarters: 6,637
Size of family households: 7,932 2-persons , 4,039 3-persons , 2,806 4-persons , 1,205 5-persons , 213 6-persons , 104 7-or-more-persons .
Size of nonfamily households: 13,977 1-person , 2,423 2-persons , 344 3-persons , 214 4-persons .
8,526 married couples with children. single-parent households (876 men , 2,778 women ).
77.1% of residents of Evanston speak English at home. of residents speak Spanish at home (78% speak English very well , 15% speak English well , 5% speak English not well , 1% don't speak English at all ).of residents speak other Indo-European language at home (82% speak English very well , 13% speak English well , 5% speak English not well ).of residents speak Asian or Pacific Island language at home (78% speak English very well , 20% speak English well , 3% speak English not well ).of residents speak other language at home (76% speak English very well , 18% speak English well , 5% speak English not well ).
Foreign born population: 10,400 (13.8%)of them are naturalized citizens )
Median number of rooms in houses and condos:
Median number of rooms in apartments
Owner-occupied Renter-occupied
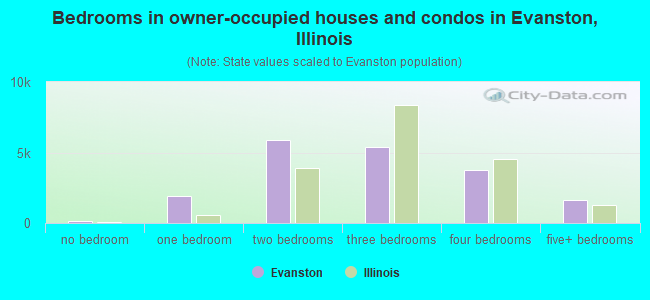
Bedrooms in owner-occupied houses and condos in Evanston, Illinois
115 no bedroom 1,885 1 bedroom 5,908 2 bedrooms 5,405 3 bedrooms 3,778 4 bedrooms 1,641 5+ bedrooms
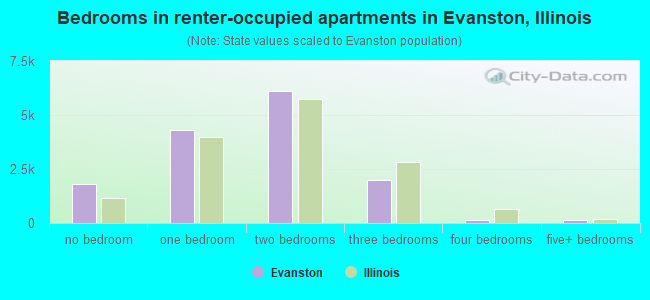
Bedrooms in renter-occupied apartments in Evanston, Illinois
1,821 no bedroom 4,324 1 bedroom 6,113 2 bedrooms 1,984 3 bedrooms 155 4 bedrooms 128 5+ bedrooms
Owner-occupied Renter-occupied
Rooms in owner-occupied houses in Evanston, Illinois
115 1 room 205 2 rooms 960 3 rooms 2,193 4 rooms 3,562 5 rooms 2,812 6 rooms 2,032 7 rooms 1,986 8 rooms 4,867 9+ rooms
Rooms in renter-occupied apartments in Evanston, Illinois
1,410 1 room 1,450 2 rooms 2,749 3 rooms 4,350 4 rooms 2,803 5 rooms 728 6 rooms 703 7 rooms 49 8 rooms 283 9+ rooms
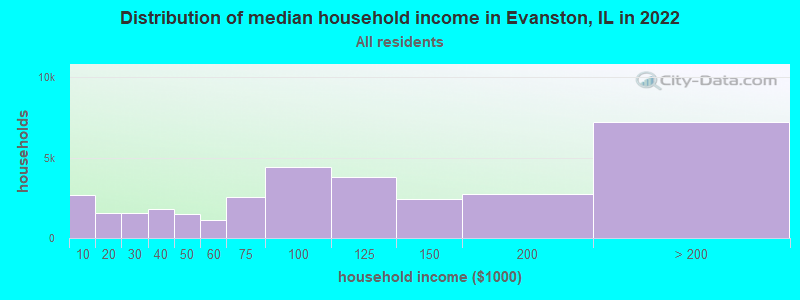
Evanston, IL household income distribution 2,686 Less than $10,0001,542 $10,000 to $19,9991,536 $20,000 to $29,9991,774 $30,000 to $39,9991,475 $40,000 to $49,9991,117 $50,000 to $59,9992,531 $60,000 to $74,9994,430 $75,000 to $99,9993,771 $100,000 to $124,9992,455 $125,000 to $149,9992,721 $150,000 to $199,9997,219 $200,000 or more
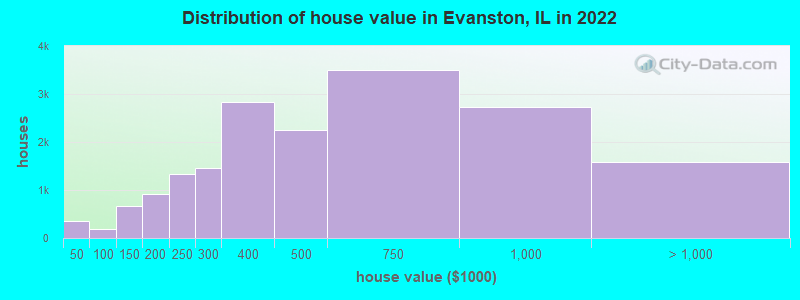
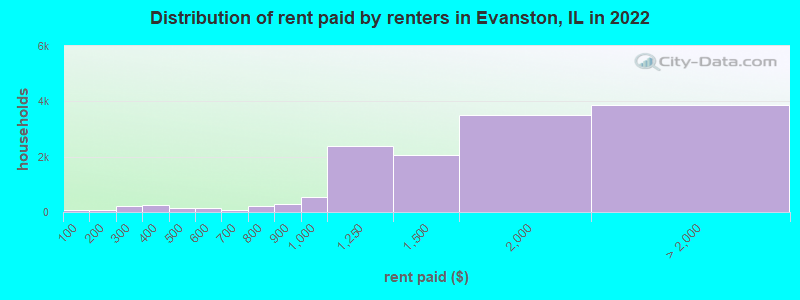
Home value of owner - occupied houses in 2022 in Evanston, IL 313 Less than $10,00039 $25,000 to $29,9995 $30,000 to $34,99915 $50,000 to $59,99931 $60,000 to $69,99914 $70,000 to $79,99971 $80,000 to $89,99947 $90,000 to $99,999414 $100,000 to $124,999248 $125,000 to $149,999563 $150,000 to $174,999347 $175,000 to $199,9991,324 $200,000 to $249,9991,453 $250,000 to $299,9992,825 $300,000 to $399,9992,250 $400,000 to $499,9993,498 $500,000 to $749,9992,729 $750,000 to $999,9991,080 $1,000,000 to $1,499,999308 $1,500,000 to $1,999,999202 $2,000,000 or moreRent paid by renters in 2022 in Evanston, IL 57 Less than $10066 $100 to $14910 $150 to $199123 $200 to $24991 $250 to $299109 $300 to $349138 $350 to $399119 $400 to $44924 $450 to $49979 $500 to $54966 $550 to $59950 $600 to $64922 $650 to $69961 $700 to $749150 $750 to $799278 $800 to $899559 $900 to $9992,376 $1,000 to $1,2492,069 $1,250 to $1,4993,489 $1,500 to $1,9991,667 $2,000 to $2,499716 $2,500 to $2,999281 $3,000 to $3,499661 $3,500 or more536 No cash rent
Percentage of workers working in this county: 94.0%Number of people working at home: 11,516 (30.0% of all workers )
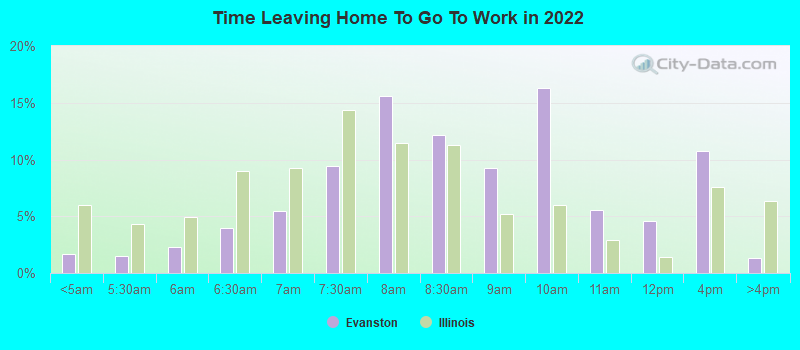
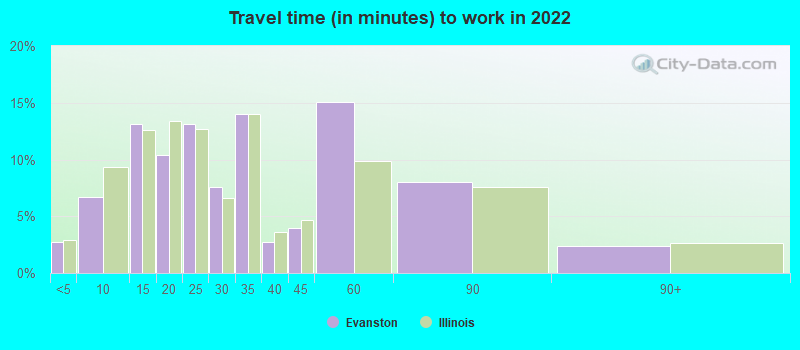
Travel time to work (commute)
Less than 5 minutes: 6005 to 9 minutes: 1,93010 to 14 minutes: 3,43815 to 19 minutes: 4,26720 to 24 minutes: 3,11125 to 29 minutes: 1,46230 to 34 minutes: 3,74635 to 39 minutes: 80140 to 44 minutes: 1,04645 to 59 minutes: 3,57060 to 89 minutes: 2,56990 or more minutes: 322
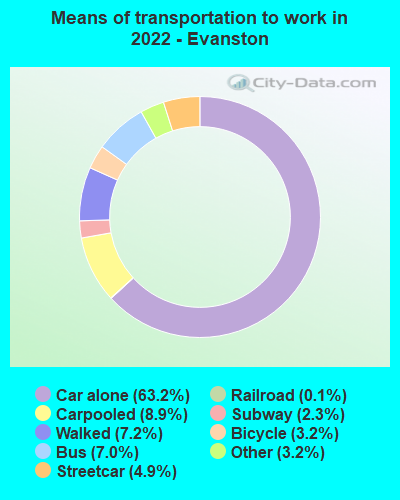
Means of transportation to work:
Drove a car alone: 25,376 (49.1%)Carpooled: 3,559 (6.9%)Bus : 2,817 (5.5%)Subway or elevated rail : 1,974 (3.8%)Long-distance train or commuter rail : 937 (1.8%)Light rail, streetcar or trolley : 60 (0.1%)Taxi: 1,272 (2.5%)Bicycle: 1,271 (2.5%)Walked: 2,898 (5.6%)Worked at home: 11,516 (22.3%)
Unemployment by race in 2022
Unemployment rate for White non-Hispanic residents 2.5% Males3.3% FemalesUnemployment rate for Black residents 17.0% Males16.1% FemalesUnemployment rate for American Indian and Alaska Native residents 16.6% FemalesUnemployment rate for Asian residents 1.8% Males1.3% FemalesUnemployment rate for other race residents 5.3% MalesUnemployment rate for two or more race residents 1.9% Males18.5% FemalesUnemployment rate for Hispanic or Latino residents 2.6% Males12.7% Females
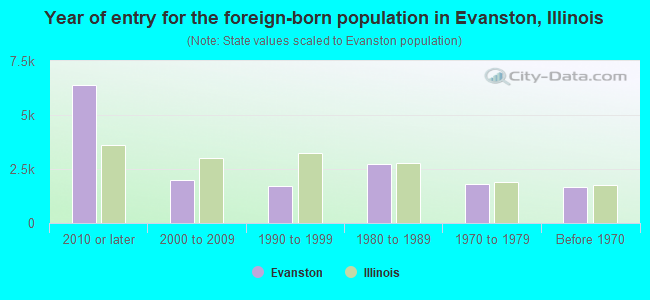
Year of entry for the foreign-born population in Evanston, Illinois
6,380 2010 or later 2,010 2000 to 2009 1,695 1990 to 1999 2,726 1980 to 1989 1,792 1970 to 1979 1,674 Before 1970
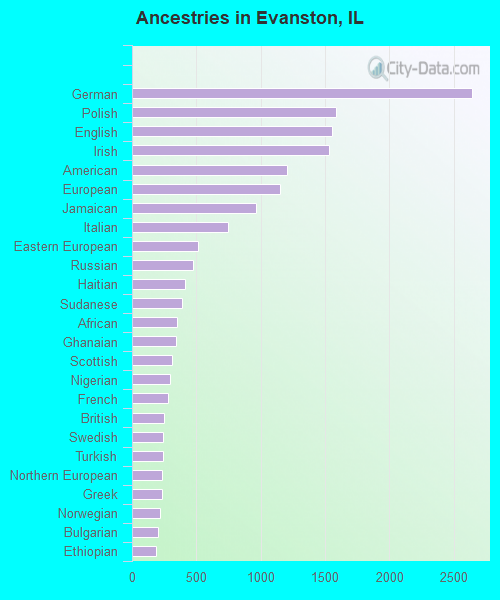
First ancestries reported:
German: 2,643 (7.0%)
Polish: 1,585 (4.2%)
English: 1,553 (4.1%)
Irish: 1,530 (4.1%)
American: 1,208 (3.2%)
European: 1,154 (3.1%)
Jamaican: 965 (2.6%)
Italian: 745 (2.0%)
Eastern European: 513 (1.4%)
Russian: 478 (1.3%)
Haitian: 409 (1.1%)
Sudanese: 386 (1.0%)
African: 346 (0.9%)
Ghanaian: 339 (0.9%)
Scottish: 311 (0.8%)
Nigerian: 292 (0.8%)
French: 279 (0.7%)
British: 247 (0.7%)
Swedish: 241 (0.6%)
Turkish: 240 (0.6%)
Northern European: 236 (0.6%)
Greek: 231 (0.6%)
Norwegian: 219 (0.6%)
Bulgarian: 201 (0.5%)
Ethiopian: 188 (0.5%)
Dutch: 161 (0.4%)
Ukrainian: 158 (0.4%)
Romanian: 154 (0.4%)
Scandinavian: 150 (0.4%)
Sierra Leonean: 139 (0.4%)
Czech: 125 (0.3%)
Lithuanian: 116 (0.3%)
Serbian: 112 (0.3%)
Hungarian: 89 (0.2%)
Iranian: 84 (0.2%)
Croatian: 78 (0.2%)
Austrian: 76 (0.2%)
French Canadian: 71 (0.2%)
Belgian: 61 (0.2%)
Portuguese: 58 (0.2%)
Yugoslavian: 55 (0.1%)
Scotch-Irish: 52 (0.1%)
Arab: 47 (0.1%)
Latvian: 43 (0.1%)
Armenian: 40 (0.1%)
Albanian: 37 (0.10%)
Lebanese: 33 (0.09%)
Swiss: 29 (0.08%)
Australian: 28 (0.07%)
Danish: 26 (0.07%)
Slavic: 24 (0.06%)
Assyrian: 23 (0.06%)
Bahamian: 23 (0.06%)
Guyanese: 22 (0.06%)
West Indian: 21 (0.06%)
Brazilian: 20 (0.05%)
Syrian: 19 (0.05%)
Palestinian: 16 (0.04%)
Belizean: 16 (0.04%)
Israeli: 14 (0.04%)
Luxembourger: 14 (0.04%)
Kenyan: 13 (0.03%)
Welsh: 13 (0.03%)
Canadian: 11 (0.03%)
Iraqi: 11 (0.03%)
Egyptian: 8 (0.02%)
Alsatian: 7 (0.02%)
Finnish: 6 (0.02%)
Czechoslovakian: 5 (0.01%)
Slovak: 4 (0.01%)
Most common places of birth for foreign-born residents (%): China, excluding Hong Kong and Taiwan Evanston:
11.0% (1,371)Illinois:
4.1% (74,364)
Mexico Evanston:
9.2% (1,150)Illinois:
34.7% (626,958)
India Evanston:
7.0% (877)Illinois:
9.2% (166,409)
Jamaica Evanston:
5.6% (695)Illinois:
0.5% (8,168)
Nigeria Evanston:
4.8% (604)Illinois:
1.2% (21,186)
Korea Evanston:
4.4% (552)Illinois:
2.2% (40,393)
Philippines Evanston:
4.2% (522)Illinois:
5.2% (93,003)
Germany Evanston:
2.5% (308)Illinois:
1.0% (18,753)
Russia Evanston:
2.1% (267)Illinois:
0.9% (16,308)
Brazil Evanston:
1.9% (241)Illinois:
0.5% (8,778)
Turkey Evanston:
1.9% (232)Illinois:
0.3% (4,823)
Poland Evanston:
1.8% (226)Illinois:
6.9% (124,474)
Sudan Evanston:
1.7% (214)Illinois:
0.1% (1,047)
Vietnam Evanston:
1.7% (209)Illinois:
1.2% (22,269)
Ghana Evanston:
1.6% (205)Illinois:
0.4% (7,043)
France Evanston:
1.6% (197)Illinois:
0.3% (5,895)
Colombia Evanston:
1.6% (195)Illinois:
0.9% (16,553)
United Kingdom, excluding England and Scotland Evanston:
1.5% (190)Illinois:
0.5% (9,671)
Chile Evanston:
1.5% (188)Illinois:
0.1% (2,291)
Place of birth for U.S.-born residents:
This state: 36,512Other state: 27,106Northeast: 5,517Midwest: 10,866South: 5,219West: 5,504 79.3% of Evanston residents lived in the same house 1 years ago.
Out of people who lived in different houses, 33.9% lived in this county.
Out of people who lived in different counties, 15.6% lived in Illinois.
Evanston:
79.3%State average:
88.3%
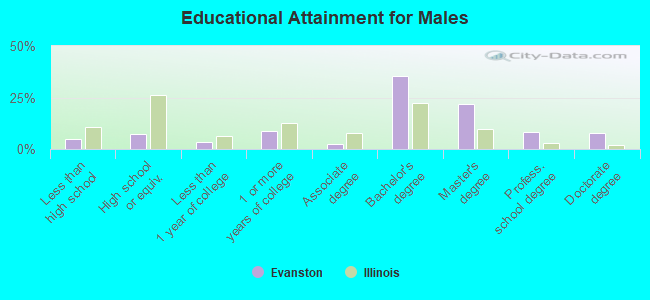
Education attainment for males 25 years and older:
No schooling: 21Nursery to 4th grade: 525th and 6th grade: 4787th and 8th grade: 2149th grade: 7010th grade: 7411th grade: 5412th grade, no diploma: 274High school graduate (or equivalency): 1,741Less than 1 year of college: 838Some college more than 1 year, no degree: 2,096Associate degree: 654Bachelor's degree: 8,726Master's degree: 5,390Professional school degree: 1,985Doctorate degree: 1,943
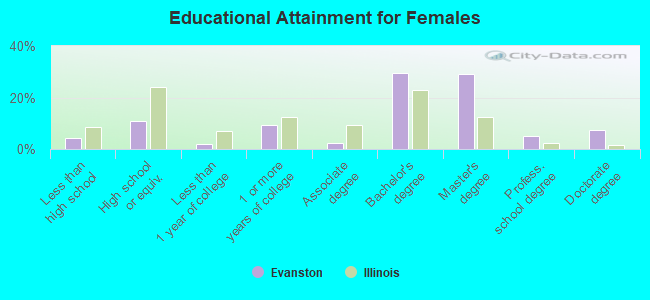
Education attainment for females 25 years and older:
No schooling: 243Nursery to 4th grade: 05th and 6th grade: 457th and 8th grade: 729th grade: 4910th grade: 29911th grade: 4412th grade, no diploma: 380High school graduate (or equivalency): 2,864Less than 1 year of college: 532Some college more than 1 year, no degree: 2,437Associate degree: 588Bachelor's degree: 7,617Master's degree: 7,544Professional school degree: 1,300Doctorate degree: 1,930
Housing units in structures:
One, detached: 11,039One, attached: 2,097Two: 2,2653 or 4: 1,5855 to 9: 5,06310 to 19: 3,10620 to 49: 4,26550 or more: 6,509Housing units lacking complete plumbing facilities in 2022: 0.5%Housing units lacking complete kitchen facilities in 2022: 1.4%House/condo owner moved in on average 12 years ago
Renter moved in on average 1 years ago
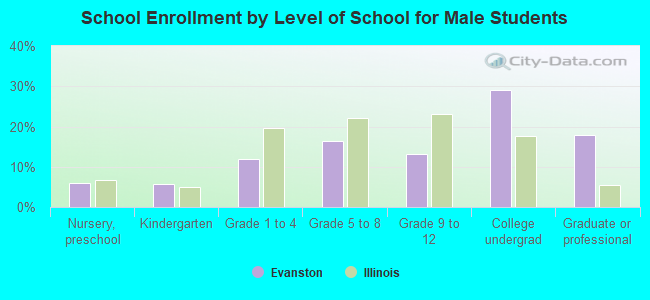
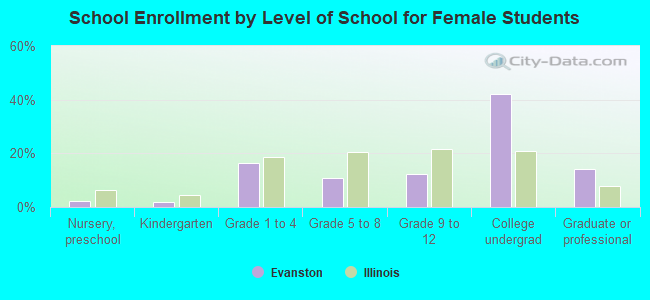
Private vs. public school enrollment:
Students in private schools in grades 1 to 8 (elementary and middle school): 1,512 Students in private schools in grades 9 to 12 (high school): 203 Students in private undergraduate colleges: 7,357