Evergreen Park, IL (Illinois) Houses and Residents
| Evergreen Park: | $250,397 |
| Illinois: | $251,600 |
Mean price in 2022:
Detached houses: $262,705
Here: $262,705 State: $310,164 Townhouses or other attached units: $265,767
Here: $265,767 State: $286,230 In 2-unit structures: $274,905
Here: $274,905 State: $299,638 In 5-or-more-unit structures: $151,082
Here: $151,082 State: $318,887
Total population: 19,935 (All urban)
Houses: 7,854 (7,480 occupied: 6,347 owner occupied, 1,261 renter occupied)
| % of renters here: | 17% |
| State: | 33% |
Housing density: 2,475 houses/condos per square mile
Median price asked for vacant for-sale houses and condos in 2022 in this county: $235,866.
Median contract rent in 2022: $1,158 (lower quartile is $994, upper quartile is $1,504)
Median rent asked for vacant for-rent units in 2022: $2,676
Median gross rent in Evergreen Park, IL in 2022: $1,203
Housing units in Evergreen Park with a mortgage: 4,014 (259 second mortgage, 0 home equity loan, 225 both second mortgage and home equity loan)
Houses without a mortgage: 124
Median household income for houses/condos with a mortgage: $107,480
Median household income for apartments without a mortgage: $91,174
Median monthly housing costs: $1,458
Compare current foreclosures in Evergreen Park, IL:
| Photo | Address | Area | Beds / Baths | Price | Details |
|---|---|---|---|---|---|

|
#1
S Springfield Ave
Evergreen Park, IL 60805
|
1,729 sq. feet
|
3 baths 3 beds |
show details | |

|
#2
S Trumbull Ave
Evergreen Park, IL 60805
|
1,224 sq. feet
|
2 baths 4 beds |
show details | |

|
#3
S Albany Ave
Evergreen Park, IL 60805
|
1,000 sq. feet
|
1 baths 3 beds |
show details | |

|
#4
S Lawndale Ave
Evergreen Park, IL 60805
|
995 sq. feet
|
1 baths 2 beds |
show details | |

|
#5
S Lawndale Ave
Evergreen Park, IL 60805
|
995 sq. feet
|
1 baths - beds |
show details | |

|
#6
S Millard Ave
Evergreen Park, IL 60805
|
1,805 sq. feet
|
1 baths - beds |
show details | |

|
#7
S Utica Ave
Evergreen Park, IL 60805
|
765 sq. feet
|
1 baths - beds |
show details | |

|
#8
S Sacramento Ave
Evergreen Park, IL 60805
|
1,898 sq. feet
|
2 baths - beds |
show details | |

|
#9
S Trumbull Ave
Evergreen Park, IL 60805
|
2,173 sq. feet
|
1 baths - beds |
show details | |

|
#10
S Richmond Ave
Evergreen Park, IL 60805
|
1,228 sq. feet
|
1 baths - beds |
show details |
| Photo | Address | Area | Beds / Baths | Price | Details |
|---|---|---|---|---|---|

|
#11
S Utica Ave
Evergreen Park, IL 60805
|
1,242 sq. feet
|
1 baths - beds |
show details | |

|
#12
S California Ave
Evergreen Park, IL 60805
|
764 sq. feet
|
1 baths - beds |
show details | |

|
#13
S Maplewood Ave
Evergreen Park, IL 60805
|
1,060 sq. feet
|
1 baths - beds |
show details | |

|
#14
S Homan Ave
Evergreen Park, IL 60805
|
1,105 sq. feet
|
1 baths - beds |
show details | |

|
#15
S Sacramento Ave
Evergreen Park, IL 60805
|
1,001 sq. feet
|
1 baths - beds |
show details | |

|
#16
S Harding Ave
Evergreen Park, IL 60805
|
2,494 sq. feet
|
2 baths - beds |
show details | |

|
#17
S Utica Ave
Evergreen Park, IL 60805
|
1,417 sq. feet
|
1 baths - beds |
show details | |

|
#18
S Utica Ave
Evergreen Park, IL 60805
|
1,128 sq. feet
|
1 baths - beds |
show details | |

|
#19
S Albany Ave
Evergreen Park, IL 60805
|
1,429 sq. feet
|
2 baths - beds |
show details | |

|
#20
S Spaulding Ave
Evergreen Park, IL 60805
|
1,340 sq. feet
|
1 baths - beds |
show details |
| Photo | Address | Area | Beds / Baths | Price | Details |
|---|---|---|---|---|---|

|
#21
S Utica Ave
Evergreen Park, IL 60805
|
1,056 sq. feet
|
1 baths - beds |
show details | |

|
#22
S Sacramento Ave
Evergreen Park, IL 60805
|
1,008 sq. feet
|
1 baths - beds |
show details | |

|
#23
S Saint Louis Ave
Evergreen Park, IL 60805
|
1,785 sq. feet
|
2 baths - beds |
show details | |

|
#24
S Albany Ave
Evergreen Park, IL 60805
|
1,192 sq. feet
|
1 baths - beds |
show details | |

|
#25
S Ridgeway Ave
Evergreen Park, IL 60805
|
1,273 sq. feet
|
1 baths - beds |
show details | |

|
#26
S Utica Ave # 2
Evergreen Park, IL 60805
|
1,799 sq. feet
|
2 baths - beds |
show details | |

|
#27
S Clifton Park Ave
Evergreen Park, IL 60805
|
1,428 sq. feet
|
1 baths - beds |
show details | |

|
#28
S Francisco Ave
Evergreen Park, IL 60805
|
987 sq. feet
|
2 baths - beds |
show details | |

|
#29
S Fairfield Ave
Evergreen Park, IL 60805
|
1,141 sq. feet
|
1 baths - beds |
show details | |

|
#30
W 88th St Apt 205
Evergreen Park, IL 60805
|
- sq. feet
|
- baths - beds |
show details |
| Photo | Address | Area | Beds / Baths | Price | Details |
|---|---|---|---|---|---|

|
#31
S Sacramento Ave
Evergreen Park, IL 60805
|
1,863 sq. feet
|
2 baths - beds |
show details | |

|
#32
S Utica Ave
Evergreen Park, IL 60805
|
984 sq. feet
|
1 baths - beds |
show details | |

|
#33
S Springfield Ave
Evergreen Park, IL 60805
|
894 sq. feet
|
1 baths - beds |
show details | |

|
#34
S Utica Ave
Evergreen Park, IL 60805
|
1,034 sq. feet
|
1 baths - beds |
show details | |

|
#35
S Utica Ave
Evergreen Park, IL 60805
|
1,414 sq. feet
|
2 baths - beds |
show details | |

|
#36
S Utica Ave
Evergreen Park, IL 60805
|
1,222 sq. feet
|
1 baths - beds |
show details | |

|
#37
S Albany Ave
Evergreen Park, IL 60805
|
1,063 sq. feet
|
1 baths - beds |
show details | |

|
#38
S Turner Ave
Evergreen Park, IL 60805
|
1,067 sq. feet
|
1 baths - beds |
show details | |

|
#39
S Sawyer Ave
Evergreen Park, IL 60805
|
1,200 sq. feet
|
1 baths - beds |
show details | |

|
#40
S Mozart Ave
Evergreen Park, IL 60805
|
1,210 sq. feet
|
2 baths - beds |
show details |
| Photo | Address | Area | Beds / Baths | Price | Details |
|---|---|---|---|---|---|

|
#41
S Spaulding Ave
Evergreen Park, IL 60805
|
1,038 sq. feet
|
1 baths - beds |
show details | |

|
#42
S Sawyer Ave
Evergreen Park, IL 60805
|
925 sq. feet
|
1 baths - beds |
show details | |

|
#43
S Homan Ave
Evergreen Park, IL 60805
|
889 sq. feet
|
2 baths - beds |
show details | |

|
#44
S Utica Ave
Evergreen Park, IL 60805
|
1,799 sq. feet
|
2 baths - beds |
show details | |

|
#45
W 100th St
Evergreen Park, IL 60805
|
- sq. feet
|
- baths - beds |
show details | |

|
#46
S Richmond Ave
Evergreen Park, IL 60805
|
- sq. feet
|
- baths - beds |
show details | |

|
#47
S Pulaski Rd Apt 2s
Evergreen Park, IL 60805
|
- sq. feet
|
- baths - beds |
show details | |

|
#48
W 90th St
Evergreen Park, IL 60805
|
- sq. feet
|
- baths - beds |
show details | |

|
#49
W 93rd Pl
Evergreen Park, IL 60805
|
- sq. feet
|
- baths - beds |
show details | |

|
Check over 1 million property listings on Foreclosure.com!
|
browse all offers | |||


Median year apartment built: 1962
Household type by relationship:
Households: 19,291- Male householders: 3,357 (897 living alone), Female householders: 3,925 (1,275 living alone)
3,664 spouses (3,653 opposite-sex spouses), 334 unmarried partners, (210 opposite-sex unmarried partners), 6,490 children (6,217 natural, 140 adopted, 132 stepchildren), 471 grandchildren, 200 brothers or sisters, 251 parents, 0 foster children, 248 other relatives, 172 non-relatives
- In group quarters: 175
Size of family households: 1,888 2-persons, 1,245 3-persons, 1,143 4-persons, 488 5-persons, 178 6-persons, 64 7-or-more-persons.
Size of nonfamily households: 2,333 1-person, 206 2-persons, 13 3-persons.
2,932 married couples with children.
1,136 single-parent households (288 men, 848 women).
84.5% of residents of Evergreen Park speak English at home.
10.2% of residents speak Spanish at home (73% speak English very well, 16% speak English well, 10% speak English not well, 1% don't speak English at all).
2.6% of residents speak other Indo-European language at home (62% speak English very well, 5% speak English well, 33% speak English not well).
1.3% of residents speak Asian or Pacific Island language at home (89% speak English very well, 3% speak English well, 9% speak English not well).
0.7% of residents speak other language at home (58% speak English very well, 42% speak English well).
Foreign born population: 1,822 (9.4%)
(55.7% of them are naturalized citizens)
| Here: | 6.6 |
| State: | 6.4 |
| Here: | 4.4 |
| State: | 4.1 |

- Bedrooms in owner-occupied houses and condos in Evergreen Park, Illinois
- 0no bedroom
- 131 bedroom
- 1,2112 bedrooms
- 3,5953 bedrooms
- 1,2324 bedrooms
- 2955+ bedrooms

- Bedrooms in renter-occupied apartments in Evergreen Park, Illinois
- 23no bedroom
- 3631 bedroom
- 4652 bedrooms
- 2833 bedrooms
- 924 bedrooms
- 365+ bedrooms

- Cars and other vehicles available in Evergreen Park in owner-occupied houses/condos
- 207no vehicle
- 1,8401 vehicle
- 2,7852 vehicles
- 1,0943 vehicles
- 2704 vehicles
- 1515+ vehicles

- Cars and other vehicles available in Evergreen Park in renter-occupied apartments
- 244no vehicle
- 5221 vehicle
- 3352 vehicles
- 1473 vehicles
- 04 vehicles
- 135+ vehicles

- Rooms in owner-occupied houses in Evergreen Park, Illinois
- 01 room
- 02 rooms
- 673 rooms
- 3424 rooms
- 1,0625 rooms
- 1,5196 rooms
- 1,7347 rooms
- 6678 rooms
- 9559+ rooms

- Rooms in renter-occupied apartments in Evergreen Park, Illinois
- 101 room
- 292 rooms
- 3203 rooms
- 2614 rooms
- 3885 rooms
- 1466 rooms
- 387 rooms
- 698 rooms
- 09+ rooms


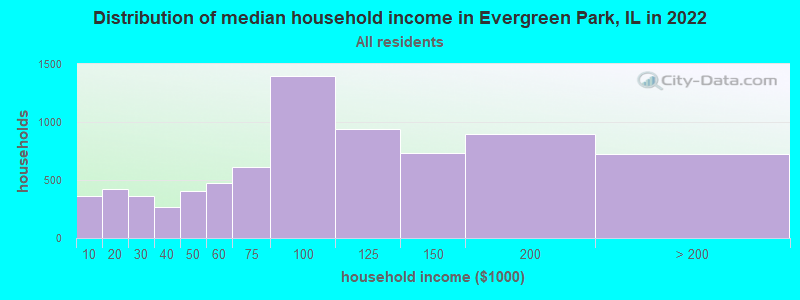
Evergreen Park, IL household income distribution

- 361Less than $10,000
- 421$10,000 to $19,999
- 366$20,000 to $29,999
- 265$30,000 to $39,999
- 405$40,000 to $49,999
- 474$50,000 to $59,999
- 616$60,000 to $74,999
- 1,398$75,000 to $99,999
- 939$100,000 to $124,999
- 731$125,000 to $149,999
- 898$150,000 to $199,999
- 722$200,000 or more
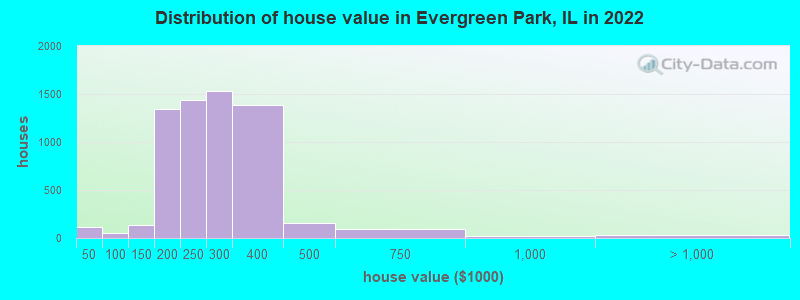
Home value of owner - occupied houses in 2022 in Evergreen Park, IL
-
- 7$15,000 to $19,999
- 89$25,000 to $29,999
- 21$30,000 to $34,999
- 12$50,000 to $59,999
- 25$80,000 to $89,999
- 17$90,000 to $99,999
- 29$100,000 to $124,999
- 104$125,000 to $149,999
- 528$150,000 to $174,999
- 815$175,000 to $199,999
- 1,441$200,000 to $249,999
- 1,535$250,000 to $299,999
- 1,385$300,000 to $399,999
- 160$400,000 to $499,999
- 89$500,000 to $749,999
- 23$750,000 to $999,999
- 2$1,000,000 to $1,499,999
- 29$2,000,000 or more
Rent paid by renters in 2022 in Evergreen Park, IL
-
- 29$450 to $499
- 5$550 to $599
- 14$650 to $699
- 11$750 to $799
- 222$800 to $899
- 30$900 to $999
- 460$1,000 to $1,249
- 140$1,250 to $1,499
- 243$1,500 to $1,999
- 68$2,000 to $2,499
- 56No cash rent


Percentage of workers working in this county: 90.9%
Number of people working at home: 1,474 (15.2% of all workers)
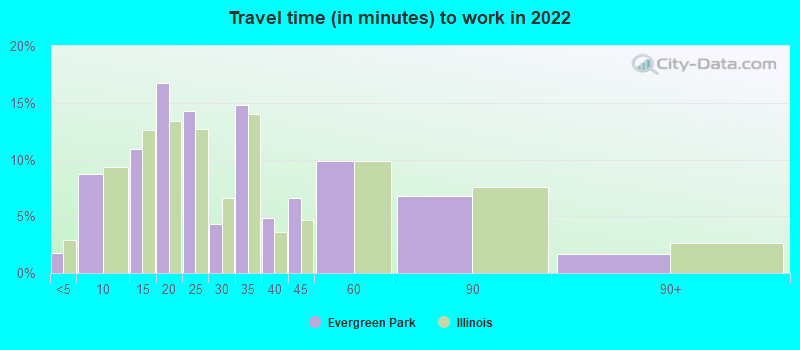
Travel time to work (commute)
- Less than 5 minutes: 91
- 5 to 9 minutes: 775
- 10 to 14 minutes: 1,010
- 15 to 19 minutes: 895
- 20 to 24 minutes: 734
- 25 to 29 minutes: 277
- 30 to 34 minutes: 1,071
- 35 to 39 minutes: 445
- 40 to 44 minutes: 722
- 45 to 59 minutes: 1,156
- 60 to 89 minutes: 803
- 90 or more minutes: 156
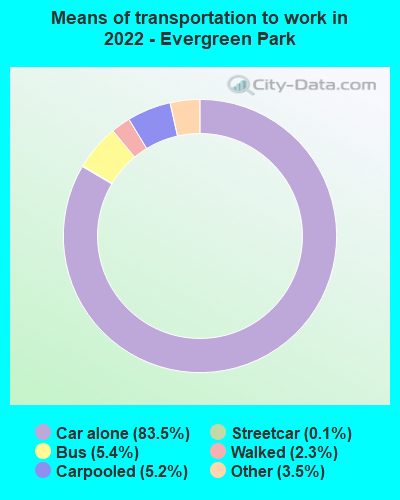
Means of transportation to work:
- Drove a car alone: 6,454 (71.1%)
- Carpooled: 432 (4.8%)
- Bus: 388 (4.3%)
- Subway or elevated rail: 7 (0.1%)
- Taxi: 269 (3.0%)
- Walked: 185 (2.0%)
- Worked at home: 1,474 (16.2%)

- Unemployment by race in 2022
- Unemployment rate for White non-Hispanic residents
- 2.9%Males
- 3.1%Females
- Unemployment rate for Black residents
- 2.5%Males
- 3.3%Females
- Unemployment rate for other race residents
- 11.1%Males
- Unemployment rate for two or more race residents
- 3.2%Males
- Unemployment rate for Hispanic or Latino residents
- 5.8%Males
- 0.6%Females

- Year of entry for the foreign-born population in Evergreen Park, Illinois
- 3962010 or later
- 4012000 to 2009
- 4611990 to 1999
- 1151980 to 1989
- 1511970 to 1979
- 341Before 1970

First ancestries reported:
- Irish: 2,043 (21.3%)
- German: 472 (4.9%)
- Polish: 445 (4.6%)
- Italian: 364 (3.8%)
- American: 152 (1.6%)
- Lithuanian: 143 (1.5%)
- European: 120 (1.3%)
- Ukrainian: 111 (1.2%)
- Dutch: 100 (1.0%)
- English: 82 (0.9%)
- African: 61 (0.6%)
- Greek: 52 (0.5%)
- Swedish: 40 (0.4%)
- Scandinavian: 36 (0.4%)
- Serbian: 29 (0.3%)
- Croatian: 27 (0.3%)
- Norwegian: 25 (0.3%)
- Belizean: 23 (0.2%)
- Nigerian: 14 (0.1%)
- Ghanaian: 13 (0.1%)
- Hungarian: 12 (0.1%)
- Czech: 10 (0.1%)
- Slovak: 9 (0.09%)
- Eastern European: 8 (0.08%)
- Jordanian: 7 (0.07%)
- Canadian: 5 (0.05%)
- British: 4 (0.04%)
- Scotch-Irish: 3 (0.03%)
Most common places of birth for foreign-born residents (%):
| Evergreen Park: | 43.1% (786) |
| Illinois: | 34.7% (626,958) |
| Evergreen Park: | 10.5% (192) |
| Illinois: | 5.2% (93,003) |
| Evergreen Park: | 8.7% (159) |
| Illinois: | 9.2% (166,409) |
| Evergreen Park: | 6.3% (114) |
| Illinois: | 0.9% (16,553) |
| Evergreen Park: | 4.8% (88) |
| Illinois: | 1.6% (29,316) |
| Evergreen Park: | 3.5% (64) |
| Illinois: | 6.9% (124,474) |
| Evergreen Park: | 3.1% (56) |
| Illinois: | 0.9% (15,679) |
| Evergreen Park: | 3.0% (54) |
| Illinois: | 1.0% (18,753) |
| Evergreen Park: | 2.7% (50) |
| Illinois: | 0.4% (7,043) |
| Evergreen Park: | 2.7% (49) |
| Illinois: | 0.6% (10,249) |
| Evergreen Park: | 2.3% (42) |
| Illinois: | 0.4% (6,611) |
| Evergreen Park: | 1.7% (31) |
| Illinois: | 1.2% (21,186) |
Place of birth for U.S.-born residents:
- This state: 15,679
- Other state: 1,600
- Northeast: 170
- Midwest: 578
- South: 577
- West: 261
93.8% of Evergreen Park residents lived in the same house 1 years ago.
Out of people who lived in different houses, 47.9% lived in this county.
Out of people who lived in different counties, 64.0% lived in Illinois.
| Evergreen Park: | 93.8% |
| State average: | 88.3% |
Education attainment for males 25 years and older:
- No schooling: 202
- Nursery to 4th grade: 0
- 5th and 6th grade: 48
- 7th and 8th grade: 13
- 9th grade: 19
- 10th grade: 56
- 11th grade: 34
- 12th grade, no diploma: 120
- High school graduate (or equivalency): 1,122
- Less than 1 year of college: 412
- Some college more than 1 year, no degree: 1,017
- Associate degree: 566
- Bachelor's degree: 1,665
- Master's degree: 604
- Professional school degree: 79
- Doctorate degree: 73

Education attainment for females 25 years and older:
- No schooling: 68
- Nursery to 4th grade: 0
- 5th and 6th grade: 30
- 7th and 8th grade: 30
- 9th grade: 4
- 10th grade: 89
- 11th grade: 0
- 12th grade, no diploma: 132
- High school graduate (or equivalency): 1,271
- Less than 1 year of college: 464
- Some college more than 1 year, no degree: 956
- Associate degree: 806
- Bachelor's degree: 2,007
- Master's degree: 1,231
- Professional school degree: 87
- Doctorate degree: 41


Housing units in structures:
- One, detached: 6,722
- One, attached: 81
- Two: 85
- 3 or 4: 51
- 5 to 9: 580
- 10 to 19: 198
- 20 to 49: 100
- 50 or more: 34
Housing units lacking complete kitchen facilities in 2022: 1.1%
House/condo owner moved in on average 16 years ago
Renter moved in on average 5 years ago

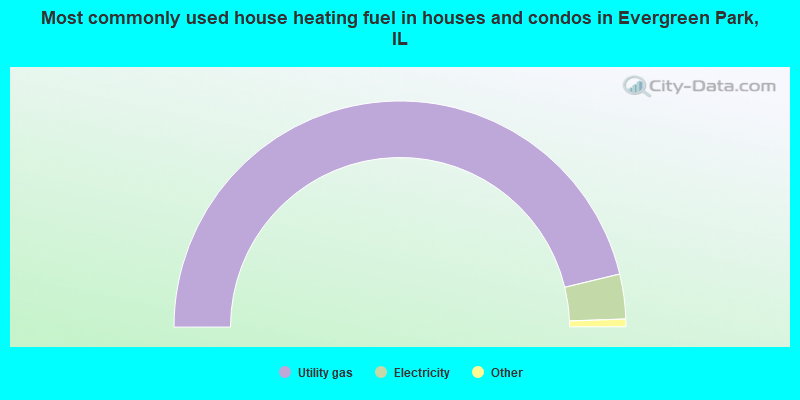
- 92.5%Utility gas
- 6.4%Electricity
- 0.5%Bottled, tank, or LP gas
- 0.4%Other fuel
- 0.1%No fuel used
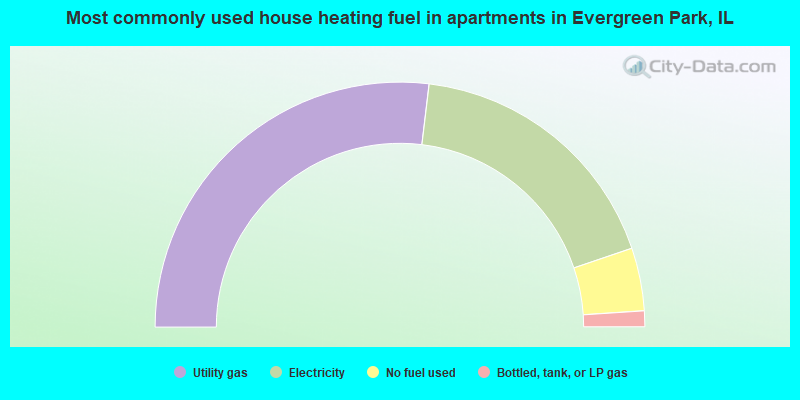
- 53.8%Utility gas
- 35.8%Electricity
- 8.3%No fuel used
- 2.1%Bottled, tank, or LP gas
Private vs. public school enrollment:
| Here: | 18.9% |
| Illinois: | 13.3% |
| Here: | 21.4% |
| Illinois: | 9.9% |
| Here: | 30.6% |
| Illinois: | 27.4% |


