Fall River, MA (Massachusetts) Houses and Residents
| Fall River: | $360,900 |
| Massachusetts: | $534,700 |
Mean price in 2022:
Detached houses: $372,273
Here: $372,273 State: $651,570 Townhouses or other attached units: $353,745
Here: $353,745 State: $617,749 In 2-unit structures: $320,065
Here: $320,065 State: $594,808 In 3-to-4-unit structures: $427,675
Here: $427,675 State: $601,912 In 5-or-more-unit structures: $280,761
Here: $280,761 State: $555,768 Mobile homes: $435,017
Here: $435,017 State: $170,209
Total population: 88,712 (All urban)
Houses: 44,303 (41,612 occupied: 15,560 owner occupied, 26,052 renter occupied)
| % of renters here: | 63% |
| State: | 38% |
Housing density: 1,428 houses/condos per square mile
Median price asked for vacant for-sale houses and condos in 2022: $551,658.
Median contract rent in 2022: $815 (lower quartile is $562, upper quartile is $1,081)
Median rent asked for vacant for-rent units in 2022: $902
Median gross rent in Fall River, MA in 2022: $982
Housing units in Fall River with a mortgage: 9,853 (1,003 second mortgage, 70 home equity loan, 933 both second mortgage and home equity loan)
Houses without a mortgage: 645
Median household income for houses/condos with a mortgage: $106,636
Median household income for apartments without a mortgage: $62,344
Median monthly housing costs: $1,068
Compare current foreclosures in Fall River, MA:
| Photo | Address | Area | Beds / Baths | Price | Details |
|---|---|---|---|---|---|

|
#1
Melville St
Fall River, MA 02724
|
2,733 sq. feet
|
3 baths 6 beds |
show details | |

|
#2
Bay St
Fall River, MA 02724
|
1,848 sq. feet
|
1 baths 3 beds |
show details | |

|
#3
Pokross St
Fall River, MA 02724
|
960 sq. feet
|
1 baths 3 beds |
show details | |

|
#4
Pokross St
Fall River, MA 02724
|
1,482 sq. feet
|
2 baths 4 beds |
show details | |

|
#5
Morton St # 2
Fall River, MA 02720
|
1,994 sq. feet
|
3 baths 6 beds |
show details | |

|
#6
June St Unit 3s
Fall River, MA 02720
|
635 sq. feet
|
1 baths 2 beds |
show details | |

|
#7
President Ave
Fall River, MA 02720
|
4,418 sq. feet
|
4 baths 10 beds |
show details | |

|
#8
California St
Fall River, MA 02723
|
1,670 sq. feet
|
2 baths 4 beds |
show details | |

|
#9
New Boston Rd # 1
Fall River, MA 02720
|
4,036 sq. feet
|
2 baths 6 beds |
show details | |

|
#10
Davol St Unit 614
Fall River, MA 02720
|
625 sq. feet
|
1 baths 1 beds |
show details |
| Photo | Address | Area | Beds / Baths | Price | Details |
|---|---|---|---|---|---|

|
#11
Morton St # 1
Fall River, MA 02720
|
2,970 sq. feet
|
2 baths 6 beds |
show details | |

|
#12
Albany St
Fall River, MA 02720
|
1,315 sq. feet
|
1 baths 2 beds |
show details | |

|
#13
Warner St
Fall River, MA 02720
|
1,678 sq. feet
|
2 baths 3 beds |
show details | |

|
#14
Bay St # 2
Fall River, MA 02721
|
2,257 sq. feet
|
2 baths 3 beds |
show details | |

|
#15
Haskell St
Fall River, MA 02720
|
1,898 sq. feet
|
2 baths 5 beds |
show details | |

|
#16
Barnaby St
Fall River, MA 02720
|
1,542 sq. feet
|
1 baths 4 beds |
show details | |

|
#17
Shore Dr Unit 611
Fall River, MA 02721
|
1,902 sq. feet
|
3 baths 3 beds |
show details | |

|
#18
Joseph Dr
Fall River, MA 02720
|
1,048 sq. feet
|
1 baths 2 beds |
show details | |

|
#19
Eddy St
Fall River, MA 02723
|
936 sq. feet
|
1 baths 4 beds |
show details | |

|
#20
Orswell St
Fall River, MA 02721
|
1,976 sq. feet
|
1 baths 4 beds |
show details |
| Photo | Address | Area | Beds / Baths | Price | Details |
|---|---|---|---|---|---|

|
#21
Highland Ave
Fall River, MA 02720
|
3,613 sq. feet
|
3 baths 4 beds |
show details | |

|
#22
Colfax St
Fall River, MA 02720
|
1,200 sq. feet
|
1 baths 3 beds |
show details | |

|
#23
Charles St
Fall River, MA 02724
|
2,412 sq. feet
|
2 baths 6 beds |
show details | |

|
#24
Ray St
Fall River, MA 02720
|
1,456 sq. feet
|
1 baths 3 beds |
show details | |

|
#25
Wood St
Fall River, MA 02721
|
1,064 sq. feet
|
1 baths 3 beds |
show details | |

|
#26
Plymouth Ave
Fall River, MA 02721
|
2,726 sq. feet
|
2 baths 2 beds |
show details | |

|
#27
Laurel St
Fall River, MA 02724
|
2,958 sq. feet
|
2 baths 2 beds |
show details | |

|
#28
Reney St
Fall River, MA 02723
|
1,146 sq. feet
|
1 baths 4 beds |
show details | |

|
#29
Wingold St
Fall River, MA 02720
|
1,028 sq. feet
|
1 baths 2 beds |
show details | |

|
#30
Tecumseh St
Fall River, MA 02721
|
2,575 sq. feet
|
3 baths 9 beds |
show details |
| Photo | Address | Area | Beds / Baths | Price | Details |
|---|---|---|---|---|---|

|
#31
County St
Fall River, MA 02723
|
1,469 sq. feet
|
2 baths 3 beds |
show details | |

|
#32
S Beach St
Fall River, MA 02724
|
1,941 sq. feet
|
1 baths 4 beds |
show details | |

|
#33
Rodman St
Fall River, MA 02721
|
1,938 sq. feet
|
1 baths 3 beds |
show details | |

|
#34
Appleton St
Fall River, MA 02724
|
662 sq. feet
|
1 baths 3 beds |
show details | |

|
#35
Hutton St
Fall River, MA 02720
|
1,740 sq. feet
|
1 baths 3 beds |
show details | |

|
#36
Mccloskey St
Fall River, MA 02723
|
1,040 sq. feet
|
2 baths 3 beds |
show details | |

|
#37
N Main St # 6
Fall River, MA 02720
|
872 sq. feet
|
1 baths 2 beds |
show details | |

|
#38
Cambridge St
Fall River, MA 02721
|
1,172 sq. feet
|
1 baths 3 beds |
show details | |

|
#39
Stevens St
Fall River, MA 02721
|
2,153 sq. feet
|
2 baths 3 beds |
show details | |

|
#40
Watson Way
Fall River, MA 02721
|
2,244 sq. feet
|
1 baths 3 beds |
show details |
| Photo | Address | Area | Beds / Baths | Price | Details |
|---|---|---|---|---|---|

|
#41
Brown St
Fall River, MA 02724
|
2,092 sq. feet
|
2 baths 4 beds |
show details | |

|
#42
Newbury St
Fall River, MA 02720
|
2,333 sq. feet
|
2 baths 4 beds |
show details | |

|
#43
Wade St
Fall River, MA 02721
|
2,407 sq. feet
|
6 baths 6 beds |
show details | |

|
#44
Stevens St
Fall River, MA 02721
|
1,602 sq. feet
|
1 baths 3 beds |
show details | |

|
#45
Townsend St
Fall River, MA 02724
|
1,040 sq. feet
|
1 baths 3 beds |
show details | |

|
#46
Walnut St
Fall River, MA 02720
|
4,600 sq. feet
|
4 baths 4 beds |
show details | |

|
#47
Wheeler St
Fall River, MA 02724
|
960 sq. feet
|
1 baths 2 beds |
show details | |

|
#48
Pitman St
Fall River, MA 02723
|
873 sq. feet
|
1 baths 4 beds |
show details | |

|
#49
Rodman St
Fall River, MA 02721
|
1,709 sq. feet
|
1 baths 3 beds |
show details | |

|
Check over 1 million property listings on Foreclosure.com!
|
browse all offers | |||


 | How Much Massachusetts Households Make Per Year: Census Data (37 replies) |
| 2023 Real Estate Observations (5278 replies) |
| More Fall River shootings (52 replies) |
| Seeking nice, safe place to rent apartment, condo or townhome near Taunton (10 replies) |
| 2021 Real Estate Observations (1729 replies) |
| What is going on in the Fall River/New Bedford area??? (111 replies) |

Median year apartment built: 1949
Household type by relationship:
Households: 93,689- Male householders: 17,362 (6,256 living alone), Female householders: 24,250 (9,454 living alone)
10,594 spouses (10,320 opposite-sex spouses), 4,087 unmarried partners, (3,910 opposite-sex unmarried partners), 24,357 children (23,412 natural, 492 adopted, 453 stepchildren), 2,597 grandchildren, 754 brothers or sisters, 1,303 parents, 92 foster children, 3,406 other relatives, 3,266 non-relatives
- In group quarters: 1,621
Size of family households: 9,532 2-persons, 5,548 3-persons, 3,600 4-persons, 1,630 5-persons, 367 6-persons, 937 7-or-more-persons.
Size of nonfamily households: 15,710 1-person, 3,866 2-persons, 299 3-persons, 123 4-persons.
5,890 married couples with children.
10,302 single-parent households (715 men, 9,587 women).
62.7% of residents of Fall River speak English at home.
9.7% of residents speak Spanish at home (58% speak English very well, 9% speak English well, 9% speak English not well, 23% don't speak English at all).
25.0% of residents speak other Indo-European language at home (57% speak English very well, 19% speak English well, 14% speak English not well, 10% don't speak English at all).
1.9% of residents speak Asian or Pacific Island language at home (54% speak English very well, 6% speak English well, 33% speak English not well, 7% don't speak English at all).
0.3% of residents speak other language at home (72% speak English very well, 22% speak English well, 6% don't speak English at all).
Foreign born population: 19,013 (20.3%)
(53.5% of them are naturalized citizens)
| Here: | 6.0 |
| State: | 6.5 |
| Here: | 4.4 |
| State: | 4.0 |

- Bedrooms in owner-occupied houses and condos in Fall River, Massachusetts
- 102no bedroom
- 2691 bedroom
- 3,9232 bedrooms
- 7,7583 bedrooms
- 3,0294 bedrooms
- 4795+ bedrooms

- Bedrooms in renter-occupied apartments in Fall River, Massachusetts
- 815no bedroom
- 8,2751 bedroom
- 9,9882 bedrooms
- 6,4683 bedrooms
- 3544 bedrooms
- 1525+ bedrooms

- Cars and other vehicles available in Fall River in owner-occupied houses/condos
- 609no vehicle
- 5,1051 vehicle
- 5,6772 vehicles
- 2,4153 vehicles
- 1,3324 vehicles
- 4225+ vehicles

- Cars and other vehicles available in Fall River in renter-occupied apartments
- 6,631no vehicle
- 13,8121 vehicle
- 4,9162 vehicles
- 6933 vehicles
- 04 vehicles
- 05+ vehicles

- Rooms in owner-occupied houses in Fall River, Massachusetts
- 441 room
- 582 rooms
- 2333 rooms
- 1,6684 rooms
- 3,7485 rooms
- 4,0366 rooms
- 2,2397 rooms
- 1,7048 rooms
- 1,8309+ rooms

- Rooms in renter-occupied apartments in Fall River, Massachusetts
- 8151 room
- 1,9782 rooms
- 4,0613 rooms
- 7,2434 rooms
- 6,1615 rooms
- 3,7016 rooms
- 1,0037 rooms
- 7728 rooms
- 3189+ rooms


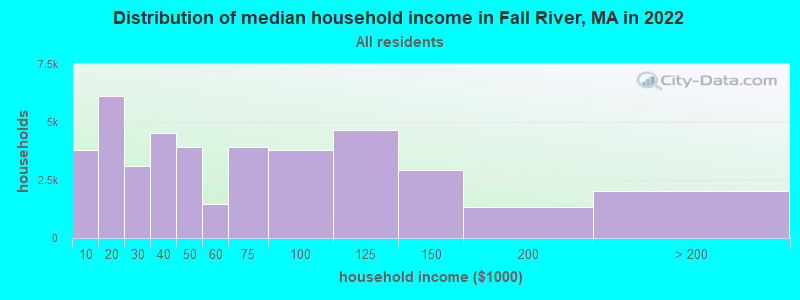
Fall River, MA household income distribution

- 3,786Less than $10,000
- 6,132$10,000 to $19,999
- 3,089$20,000 to $29,999
- 4,536$30,000 to $39,999
- 3,914$40,000 to $49,999
- 1,483$50,000 to $59,999
- 3,940$60,000 to $74,999
- 3,795$75,000 to $99,999
- 4,644$100,000 to $124,999
- 2,915$125,000 to $149,999
- 1,357$150,000 to $199,999
- 2,021$200,000 or more
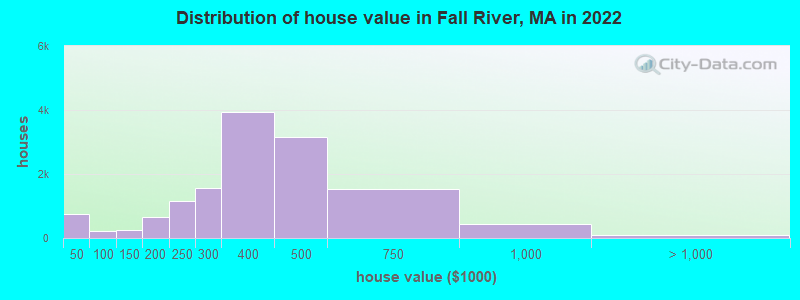
Home value of owner - occupied houses in 2022 in Fall River, MA
-
- 527Less than $10,000
- 58$10,000 to $14,999
- 10$15,000 to $19,999
- 38$20,000 to $24,999
- 22$25,000 to $29,999
- 40$30,000 to $34,999
- 52$35,000 to $39,999
- 11$40,000 to $49,999
- 11$50,000 to $59,999
- 18$60,000 to $69,999
- 4$70,000 to $79,999
- 9$80,000 to $89,999
- 166$90,000 to $99,999
- 118$100,000 to $124,999
- 132$125,000 to $149,999
- 436$150,000 to $174,999
- 225$175,000 to $199,999
- 1,154$200,000 to $249,999
- 1,572$250,000 to $299,999
- 3,949$300,000 to $399,999
- 3,147$400,000 to $499,999
- 1,516$500,000 to $749,999
- 425$750,000 to $999,999
- 9$1,000,000 to $1,499,999
- 20$1,500,000 to $1,999,999
- 53$2,000,000 or more
Rent paid by renters in 2022 in Fall River, MA
-
- 209Less than $100
- 424$100 to $149
- 366$150 to $199
- 703$200 to $249
- 2,090$250 to $299
- 292$300 to $349
- 661$350 to $399
- 413$400 to $449
- 317$450 to $499
- 633$500 to $549
- 991$550 to $599
- 793$600 to $649
- 891$650 to $699
- 2,000$700 to $749
- 1,368$750 to $799
- 3,497$800 to $899
- 2,277$900 to $999
- 3,385$1,000 to $1,249
- 1,567$1,250 to $1,499
- 1,971$1,500 to $1,999
- 510$2,000 to $2,499
- 694No cash rent


Percentage of workers working in this county: 74.3%
Number of people working at home: 3,394 (7.8% of all workers)
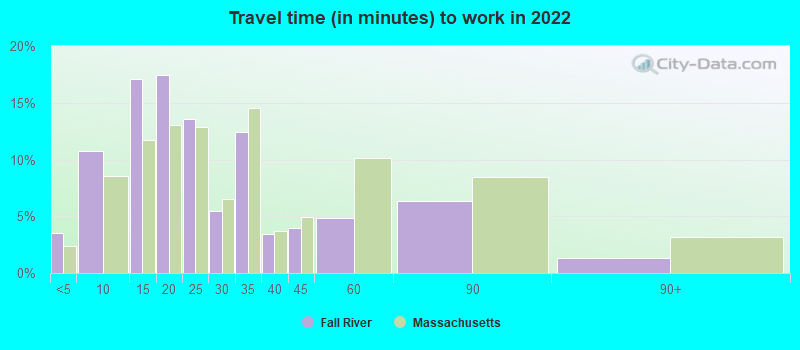
Travel time to work (commute)
- Less than 5 minutes: 1,329
- 5 to 9 minutes: 4,074
- 10 to 14 minutes: 5,742
- 15 to 19 minutes: 6,517
- 20 to 24 minutes: 4,517
- 25 to 29 minutes: 1,346
- 30 to 34 minutes: 5,796
- 35 to 39 minutes: 1,728
- 40 to 44 minutes: 1,342
- 45 to 59 minutes: 3,042
- 60 to 89 minutes: 3,093
- 90 or more minutes: 675
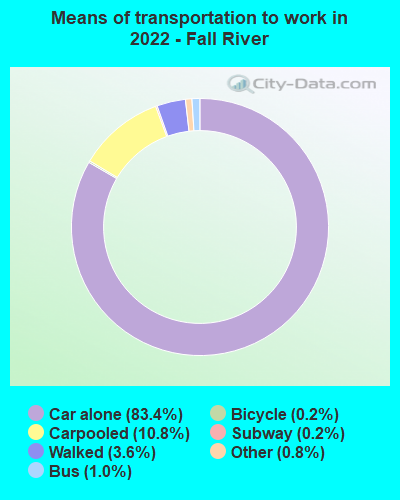
Means of transportation to work:
- Drove a car alone: 31,994 (75.2%)
- Carpooled: 4,590 (10.8%)
- Bus: 333 (0.8%)
- Long-distance train or commuter rail: 172 (0.4%)
- Taxi: 339 (0.8%)
- Bicycle: 55 (0.1%)
- Walked: 983 (2.3%)
- Worked at home: 3,394 (8.0%)

- Unemployment by race in 2022
- Unemployment rate for White non-Hispanic residents
- 9.8%Males
- 6.5%Females
- Unemployment rate for Black residents
- 4.2%Males
- 6.8%Females
- Unemployment rate for Asian residents
- 3.4%Males
- 4.4%Females
- Unemployment rate for other race residents
- 5.0%Males
- 4.9%Females
- Unemployment rate for two or more race residents
- 12.8%Males
- 8.4%Females
- Unemployment rate for Hispanic or Latino residents
- 4.3%Males
- 10.2%Females

- Year of entry for the foreign-born population in Fall River, Massachusetts
- 6,5482010 or later
- 2,8702000 to 2009
- 2,6321990 to 1999
- 4,1191980 to 1989
- 5,7931970 to 1979
- 5,824Before 1970

First ancestries reported:
- Portuguese: 23,141 (44.8%)
- Brazilian: 2,236 (4.3%)
- Irish: 2,205 (4.3%)
- English: 2,097 (4.1%)
- Cape Verdean: 1,733 (3.4%)
- American: 1,557 (3.0%)
- French Canadian: 1,353 (2.6%)
- Italian: 1,322 (2.6%)
- French: 1,170 (2.3%)
- Haitian: 571 (1.1%)
- German: 306 (0.6%)
- Polish: 300 (0.6%)
- Nigerian: 295 (0.6%)
- African: 194 (0.4%)
- Jamaican: 173 (0.3%)
- European: 171 (0.3%)
- Trinidadian and Tobagonian: 99 (0.2%)
- Lebanese: 97 (0.2%)
- Russian: 86 (0.2%)
- Belgian: 83 (0.2%)
- Canadian: 81 (0.2%)
- Senegalese: 79 (0.2%)
- Ukrainian: 78 (0.2%)
- Ghanaian: 73 (0.1%)
- Greek: 64 (0.1%)
- West Indian: 61 (0.1%)
- Moroccan: 56 (0.1%)
- Norwegian: 54 (0.1%)
- Lithuanian: 53 (0.1%)
- Eastern European: 49 (0.09%)
- Danish: 48 (0.09%)
- Iranian: 41 (0.08%)
- Swedish: 37 (0.07%)
- Scottish: 31 (0.06%)
- Northern European: 29 (0.06%)
- Dutch: 25 (0.05%)
- Egyptian: 24 (0.05%)
- Albanian: 24 (0.05%)
- British: 20 (0.04%)
- Ugandan: 19 (0.04%)
- Belizean: 19 (0.04%)
- Scotch-Irish: 18 (0.03%)
- Romanian: 11 (0.02%)
- Barbadian: 11 (0.02%)
- Austrian: 7 (0.01%)
- Swiss: 5 (0.01%)
- Czechoslovakian: 5 (0.01%)
- Guyanese: 4 (0.01%)
Most common places of birth for foreign-born residents (%):
| Fall River: | 45.8% (9,719) |
| Massachusetts: | 4.1% (50,360) |
| Fall River: | 18.1% (3,834) |
| Massachusetts: | 7.6% (92,959) |
| Fall River: | 14.9% (3,169) |
| Massachusetts: | 0.9% (10,768) |
| Fall River: | 6.2% (1,322) |
| Massachusetts: | 2.6% (32,354) |
| Fall River: | 3.6% (774) |
| Massachusetts: | 1.0% (11,727) |
| Fall River: | 3.2% (680) |
| Massachusetts: | 1.2% (14,305) |
| Fall River: | 2.6% (543) |
| Massachusetts: | 8.3% (101,767) |
| Fall River: | 2.5% (536) |
| Massachusetts: | 4.9% (60,432) |
Place of birth for U.S.-born residents:
- This state: 58,927
- Other state: 12,948
- Northeast: 7,247
- Midwest: 480
- South: 4,181
- West: 1,040
88.0% of Fall River residents lived in the same house 1 years ago.
Out of people who lived in different houses, 40.9% lived in this county.
Out of people who lived in different counties, 58.8% lived in Massachusetts.
| Fall River: | 88.0% |
| State average: | 87.7% |
Education attainment for males 25 years and older:
- No schooling: 1,541
- Nursery to 4th grade: 842
- 5th and 6th grade: 776
- 7th and 8th grade: 902
- 9th grade: 635
- 10th grade: 917
- 11th grade: 797
- 12th grade, no diploma: 1,228
- High school graduate (or equivalency): 11,417
- Less than 1 year of college: 2,055
- Some college more than 1 year, no degree: 2,387
- Associate degree: 1,478
- Bachelor's degree: 3,381
- Master's degree: 952
- Professional school degree: 69
- Doctorate degree: 568

Education attainment for females 25 years and older:
- No schooling: 1,138
- Nursery to 4th grade: 979
- 5th and 6th grade: 635
- 7th and 8th grade: 1,886
- 9th grade: 512
- 10th grade: 497
- 11th grade: 832
- 12th grade, no diploma: 824
- High school graduate (or equivalency): 11,893
- Less than 1 year of college: 2,399
- Some college more than 1 year, no degree: 4,779
- Associate degree: 3,668
- Bachelor's degree: 5,480
- Master's degree: 1,490
- Professional school degree: 300
- Doctorate degree: 529


Housing units in structures:
- One, detached: 11,166
- One, attached: 630
- Two: 4,441
- 3 or 4: 13,897
- 5 to 9: 6,499
- 10 to 19: 2,650
- 20 to 49: 1,516
- 50 or more: 3,449
- Mobile homes: 55
Housing units lacking complete kitchen facilities in 2022: 3.4%
House/condo owner moved in on average 15 years ago
Renter moved in on average 5 years ago

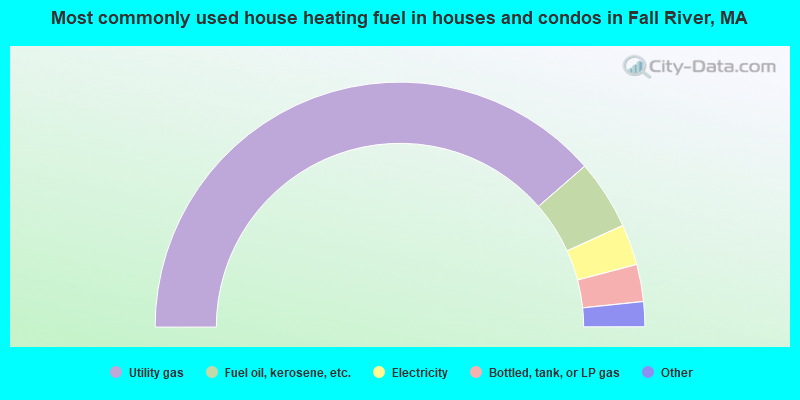
- 77.2%Utility gas
- 9.2%Fuel oil, kerosene, etc.
- 5.4%Electricity
- 4.9%Bottled, tank, or LP gas
- 1.4%Solar energy
- 1.1%Wood
- 0.7%Other fuel
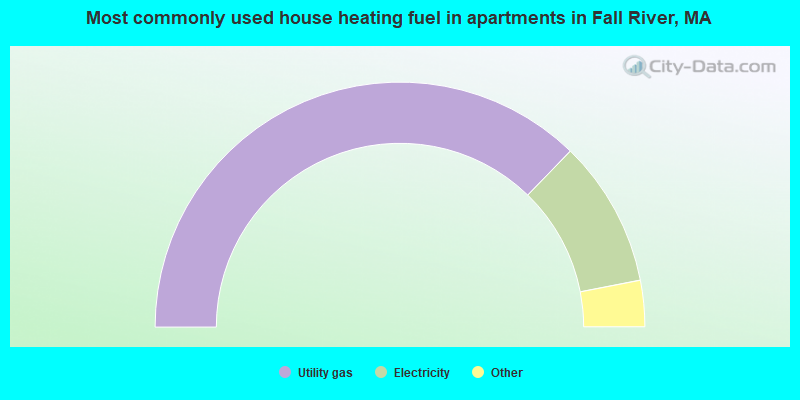
- 74.5%Utility gas
- 19.4%Electricity
- 2.9%Bottled, tank, or LP gas
- 1.8%Fuel oil, kerosene, etc.
- 0.9%Solar energy
- 0.5%Other fuel
Private vs. public school enrollment:
| Here: | 9.0% |
| Massachusetts: | 10.3% |
| Here: | 2.9% |
| Massachusetts: | 12.3% |
| Here: | 33.0% |
| Massachusetts: | 51.2% |


