Farmington Hills, MI (Michigan) Houses and Residents
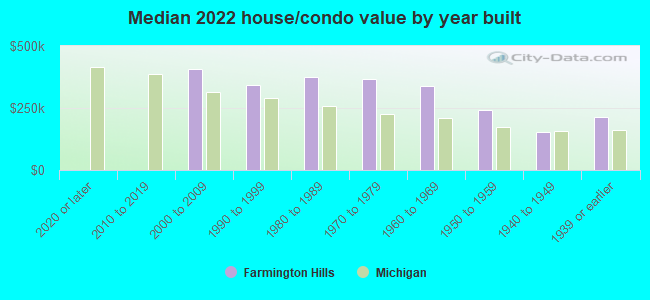
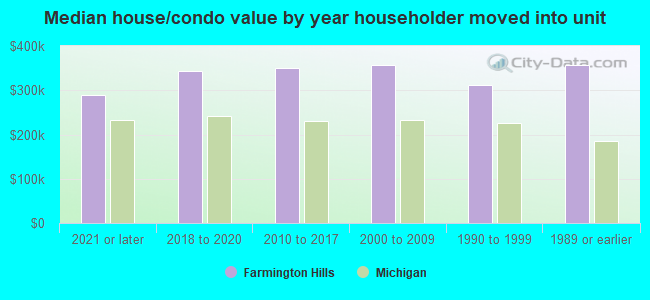
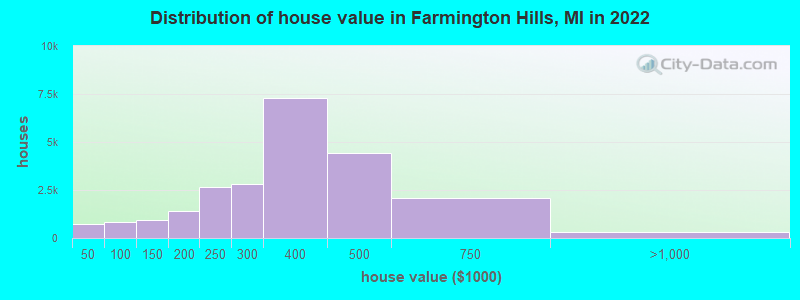
Estimated median house or condo value in 2022: $340,300 (it was $220,400 in 2000 )
Farmington Hills:
$340,300Michigan:
$224,400
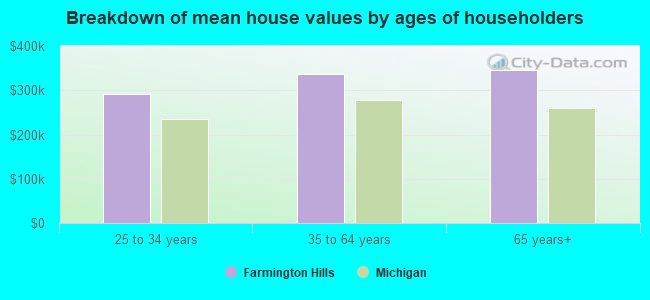
Lower value quartile - upper value quartile: $238,800 - $426,800Mean price in 2022: Detached houses: $343,726 Here:
$343,726State:
$280,038
Townhouses or other attached units: $416,607 Here:
$416,607State:
$239,520
In 3-to-4-unit structures: $220,997 Here:
$220,997State:
$207,067
In 5-or-more-unit structures: $103,637 Here:
$103,637State:
$192,733
Mobile homes: $16,899 Here:
$16,899State:
$72,868
Total population: 81,435 (All urban)
Houses: 37,241 (34,498 occupied: 22,871 owner occupied, 11,627 renter occupied )
% of renters here:
34%State:
27%
Housing density: 1,119 houses/condos per square mile
Median price asked for vacant for-sale houses and condos in 2022: $344,969.
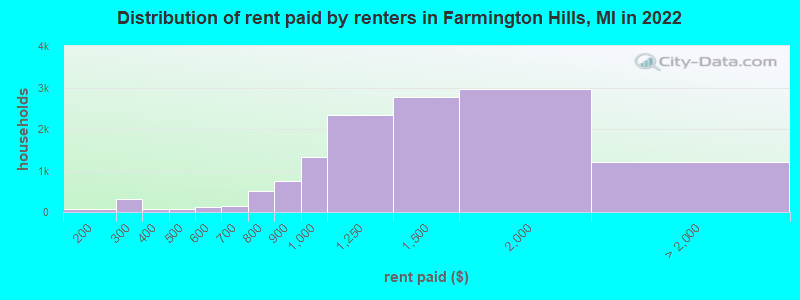
Median contract rent in 2022: $1,324 (lower quartile is $1,012, upper quartile is $1,646)
Median rent asked for vacant for-rent units in 2022: $2,453
Median gross rent in Farmington Hills, MI in 2022: $1,461
Housing units in Farmington Hills with a mortgage: 14,771 (1,241 second mortgage, 0 home equity loan, 1,241 both second mortgage and home equity loan )Houses without a mortgage: 673
Median household income for houses/condos with a mortgage: $137,005
Median household income for apartments without a mortgage: $85,163
Median monthly housing costs: $1,461
Data:
Median house or condo value ($)
Median house or condo value ($ change since 2000)
Median house or condo value ($) - White
Median house or condo value ($) - Black or African American
Median house or condo value ($) - Asian
Median house or condo value ($) - Hispanic or Latino
Median house or condo value ($) - American Indian and Alaska Native
Median house or condo value ($) - Multirace
Median house or condo value ($) - Other Race
Median price asked for mobile homes ($)
Household density (households per square mile)
Mean house or condo value by units in structure - 1, detached ($)
Mean house or condo value by units in structure - 1, attached ($)
Mean house or condo value by units in structure - 2 ($)
Mean house or condo value by units in structure by units in structure - 3 or 4 ($)
Mean house or condo value by units in structure - 5 or more ($)
Mean house or condo value by units in structure - Boat, RV, van, etc. ($)
Mean house or condo value by units in structure - Mobile home ($)
Median contract rent ($)
Median contract rent - Lower quartile ($)
Median contract rent - Upper quartile ($)
Median gross rent ($)
Urban houses (%)
Rural houses (%)
Houses occupied (%)
Houses occupied (% change since 2000)
Houses owner occupied (%)
Houses owner occupied (% change since 2000)
Houses renter occupied (%)
Houses renter occupied (% change since 2000)
Vacant housing units - For rent (%)
Vacant housing units - For rent (% change since 2000)
Vacant housing units - For sale only (%)
Vacant housing units - For sale only (% change since 2000)
Vacant housing units - Rented or sold, not occupied (%)
Vacant housing units - Rented or sold, not occupied (% change since 2000)
Vacant housing units - For seasonal, recreational, or occasional use (%)
Vacant housing units - For seasonal, recreational, or occasional use (% change since 2000)
Vacant housing units - For migrant workers (%)
Vacant housing units - For migrant workers (% change since 2000)
Vacant housing units - Other vacant (%)
Vacant housing units - Other vacant (% change since 2000)
Median monthly housing costs ($)
Median household income for houses/condos with a mortgage ($)
Median household income for houses/condos without a mortgage ($)
Median household income ($)
Median household income ($) - White
Median household income ($) - Black or African American
Median household income ($) - Asian
Median household income ($) - Hispanic or Latino
Median household income ($) - American Indian and Alaska Native
Median household income ($) - Multirace
Median household income ($) - Other Race
Mortgage status - with mortgage (%)
Mortgage status - with second mortgage (%)
Mortgage status - with home equity loan (%)
Mortgage status - with both second mortgage and home equity loan (%)
Mortgage status - without a mortgage (%)
Median year house/condo built
Median year apartment built
Household type by relationship - Male householder living alone (%)
Household type by relationship - Male householder not living alone (%)
Household type by relationship - Female householder living alone (%)
Household type by relationship - Female householder not living alone (%)
Household type by relationship - Opposite-Sex spouse (%)
Household type by relationship - Same-Sex spouse (%)
Household type by relationship - Opposite-Sex unmarried partner (%)
Household type by relationship - Same-Sex unmarried partner (%)
Household type by relationship - In group quarters (%)
Size of family households - 2-person household (%)
Size of family households - 3-person household (%)
Size of family households - 4-person household (%)
Size of family households - 5-person household (%)
Size of family households - 6-person household (%)
Size of family households - 7-or-more-person household (%)
Size of nonfamily households - 1-person household (%)
Size of nonfamily households - 2-person household (%)
Size of nonfamily households - 3-person household (%)
Size of nonfamily households - 4-person household (%)
Size of nonfamily households - 5-person household (%)
Size of nonfamily households - 6-person household (%)
Size of nonfamily households - 7-or-moreperson household (%)
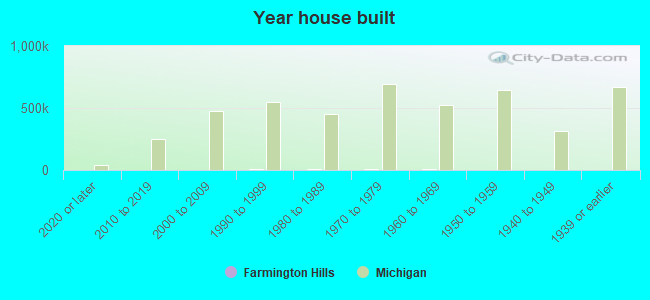
Year house built - Built 2010 or later (%)
Year house built - Built 2000 to 2009 (%)
Year house built - Built 1990 to 1999 (%)
Year house built - Built 1980 to 1989 (%)
Year house built - Built 1970 to 1979 (%)
Year house built - Built 1960 to 1969 (%)
Year house built - Built 1950 to 1959 (%)
Year house built - Built 1940 to 1949 (%)
Year house built - Built 1939 or earlier (%)
Median number of rooms in houses and condos
Median number of rooms in apartments
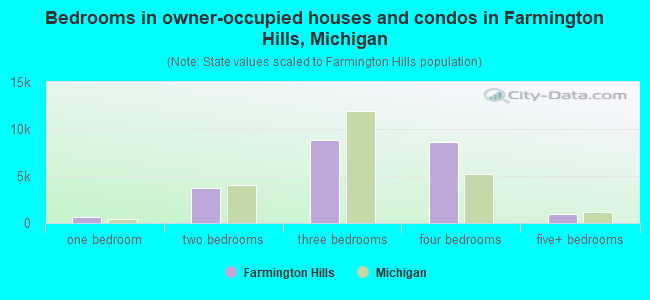
Median number of bedrooms in owner occupied houses
Mean number of bedrooms in owner occupied houses
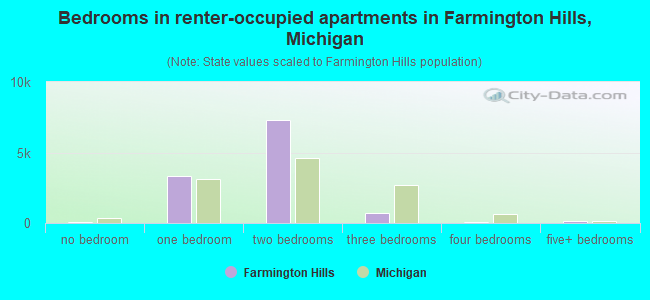
Median number of bedrooms in renter occupied houses
Mean number of bedrooms in renter occupied houses
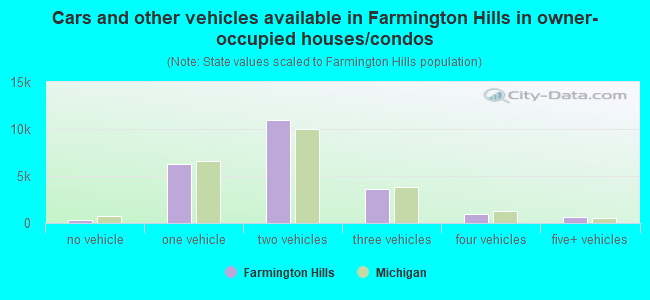
Median number of vehichles in owner occupied houses
Mean number of vehichles in owner occupied houses
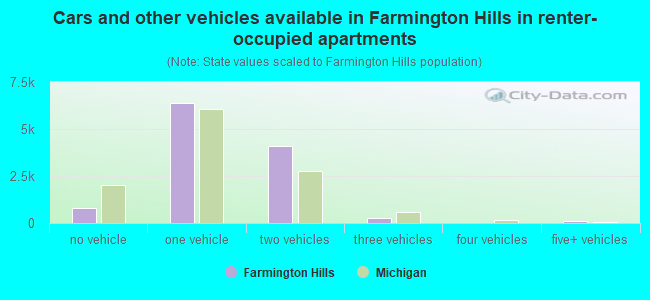
Median number of vehichles in renter occupied houses
Mean number of vehichles in renter occupied houses
Rooms in owner-occupied houses - 1 room (%)
Rooms in owner-occupied houses - 2 rooms (%)
Rooms in owner-occupied houses - 3 rooms (%)
Rooms in owner-occupied houses - 4 rooms (%)
Rooms in owner-occupied houses - 5 rooms (%)
Rooms in owner-occupied houses - 6 rooms (%)
Rooms in owner-occupied houses - 7 rooms (%)
Rooms in owner-occupied houses - 8 rooms (%)
Rooms in owner-occupied houses - 9+ rooms (%)
Rooms in renter-occupied houses - 1 room (%)
Rooms in renter-occupied houses - 2 rooms (%)
Rooms in renter-occupied houses - 3 rooms (%)
Rooms in renter-occupied houses - 4 rooms (%)
Rooms in renter-occupied houses - 5 rooms (%)
Rooms in renter-occupied houses - 6 rooms (%)
Rooms in renter-occupied houses - 7 rooms (%)
Rooms in renter-occupied houses - 8 rooms (%)
Rooms in renter-occupied houses - 9+ rooms (%)
Bedrooms in owner-occupied houses - no bedrooms (%)
Bedrooms in owner-occupied houses - 1 bedroom (%)
Bedrooms in owner-occupied houses - 2 bedrooms (%)
Bedrooms in owner-occupied houses - 3 bedrooms (%)
Bedrooms in owner-occupied houses - 4 bedrooms (%)
Bedrooms in owner-occupied houses - 5+ bedrooms (%)
Bedrooms in renter-occupied houses - no bedrooms (%)
Bedrooms in renter-occupied houses - 1 bedroom (%)
Bedrooms in renter-occupied houses - 2 bedrooms (%)
Bedrooms in renter-occupied houses - 3 bedrooms (%)
Bedrooms in renter-occupied houses - 4 bedrooms (%)
Bedrooms in renter-occupied houses - 5+ bedrooms (%)
Vehicles available in owner-occupied houses - no vehicle available (%)
Vehicles available in owner-occupied houses - 1 vehicle available(%)
Vehicles available in owner-occupied houses - 2 Vehicles available (%)
Vehicles available in owner-occupied houses - 3 Vehicles available (%)
Vehicles available in owner-occupied houses - 4 Vehicles available (%)
Vehicles available in owner-occupied houses - 5+ Vehicles available (%)
Vehicles available in renter-occupied houses - no vehicle available (%)
Vehicles available in renter-occupied houses - 1 vehicle available (%)
Vehicles available in renter-occupied houses - 2 Vehicles available (%)
Vehicles available in renter-occupied houses - 3 Vehicles available (%)
Vehicles available in renter-occupied houses - 4 Vehicles available (%)
Vehicles available in renter-occupied houses - 5+ Vehicles available (%)
Housing units in structures - 1, detached (%)
Housing units in structures - 1, attached (%)
Housing units in structures - 2 (%)
Housing units in structures - 3 or 4 (%)
Housing units in structures - 5 to 9 (%)
Housing units in structures - 10 to 19 (%)
Housing units in structures - 20 to 49 (%)
Housing units in structures - 50 or more (%)
Housing units in structures - Mobile home (%)
Housing units in structures - Boat, RV, van, etc. (%)
Housing units in structures - Owners - 1, detached (%)
Housing units in structures - Owners - 1, attached (%)
Housing units in structures - Owners - 2 (%)
Housing units in structures - Owners - 3 or 4 (%)
Housing units in structures - Owners - 5 to 9 (%)
Housing units in structures - Owners - 10 to 19 (%)
Housing units in structures - Owners - 20 to 49 (%)
Housing units in structures - Owners - 50 or more (%)
Housing units in structures - Owners - Mobile home (%)
Housing units in structures - Owners - Boat, RV, van, etc. (%)
Housing units in structures - Renters - 1, detached (%)
Housing units in structures - Renters - 1, attached (%)
Housing units in structures - Renters - 2 (%)
Housing units in structures - Renters - 3 or 4 (%)
Housing units in structures - Renters - 5 to 9 (%)
Housing units in structures - Renters - 10 to 19 (%)
Housing units in structures - Renters - 20 to 49 (%)
Housing units in structures - Renters - 50 or more (%)
Housing units in structures - Renters - Mobile home (%)
Housing units in structures - Renters - Boat, RV, van, etc. (%)
House/condo owner moved in on average (years ago)
Renter moved in on average (years ago)
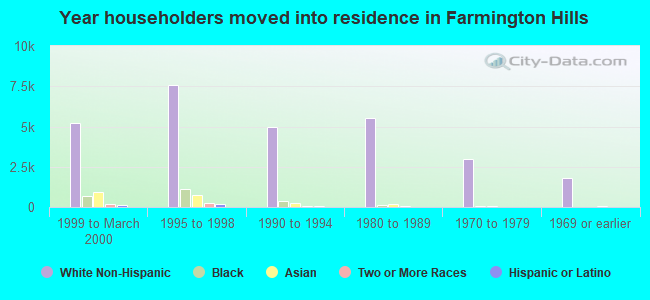
Year householder moved into unit - Moved in 1999 to March 2000 (%)
Year householder moved into unit - Moved in 1999 to March 2000 (%) - White
Year householder moved into unit - Moved in 1999 to March 2000 (%) - Black or African American
Year householder moved into unit - Moved in 1999 to March 2000 (%) - Asian
Year householder moved into unit - Moved in 1999 to March 2000 (%) - Hispanic or Latino
Year householder moved into unit - Moved in 1999 to March 2000 (%) - American Indian and Alaska Native
Year householder moved into unit - Moved in 1999 to March 2000 (%) - Multirace
Year householder moved into unit - Moved in 1999 to March 2000 (%) - Other Race
Year householder moved into unit - Moved in 1995 to 1998 (%)
Year householder moved into unit - Moved in 1995 to 1998 (%) - White
Year householder moved into unit - Moved in 1995 to 1998 (%) - Black or African American
Year householder moved into unit - Moved in 1995 to 1998 (%) - Asian
Year householder moved into unit - Moved in 1995 to 1998 (%) - Hispanic or Latino
Year householder moved into unit - Moved in 1995 to 1998 (%) - American Indian and Alaska Native
Year householder moved into unit - Moved in 1995 to 1998 (%) - Multirace
Year householder moved into unit - Moved in 1995 to 1998 (%) - Other Race
Year householder moved into unit - Moved in 1990 to 1994 (%)
Year householder moved into unit - Moved in 1990 to 1994 (%) - White
Year householder moved into unit - Moved in 1990 to 1994 (%) - Black or African American
Year householder moved into unit - Moved in 1990 to 1994 (%) - Asian
Year householder moved into unit - Moved in 1990 to 1994 (%) - Hispanic or Latino
Year householder moved into unit - Moved in 1990 to 1994 (%) - American Indian and Alaska Native
Year householder moved into unit - Moved in 1990 to 1994 (%) - Multirace
Year householder moved into unit - Moved in 1990 to 1994 (%) - Other Race
Year householder moved into unit - Moved in 1980 to 1989 (%)
Year householder moved into unit - Moved in 1980 to 1989 (%) - White
Year householder moved into unit - Moved in 1980 to 1989 (%) - Black or African American
Year householder moved into unit - Moved in 1980 to 1989 (%) - Asian
Year householder moved into unit - Moved in 1980 to 1989 (%) - Hispanic or Latino
Year householder moved into unit - Moved in 1980 to 1989 (%) - American Indian and Alaska Native
Year householder moved into unit - Moved in 1980 to 1989 (%) - Multirace
Year householder moved into unit - Moved in 1980 to 1989 (%) - Other Race
Year householder moved into unit - Moved in 1970 to 1979 (%)
Year householder moved into unit - Moved in 1970 to 1979 (%) - White
Year householder moved into unit - Moved in 1970 to 1979 (%) - Black or African American
Year householder moved into unit - Moved in 1970 to 1979 (%) - Asian
Year householder moved into unit - Moved in 1970 to 1979 (%) - Hispanic or Latino
Year householder moved into unit - Moved in 1970 to 1979 (%) - American Indian and Alaska Native
Year householder moved into unit - Moved in 1970 to 1979 (%) - Multirace
Year householder moved into unit - Moved in 1970 to 1979 (%) - Other Race
Year householder moved into unit - Moved in 1969 or earlier (%)
Year householder moved into unit - Moved in 1969 or earlier (%) - White
Year householder moved into unit - Moved in 1969 or earlier (%) - Black or African American
Year householder moved into unit - Moved in 1969 or earlier (%) - Asian
Year householder moved into unit - Moved in 1969 or earlier (%) - Hispanic or Latino
Year householder moved into unit - Moved in 1969 or earlier (%) - American Indian and Alaska Native
Year householder moved into unit - Moved in 1969 or earlier (%) - Multirace
Year householder moved into unit - Moved in 1969 or earlier (%) - Other Race
Housing units lacking complete plumbing facilities (%)
Housing units lacking complete kitchen facilities (%)
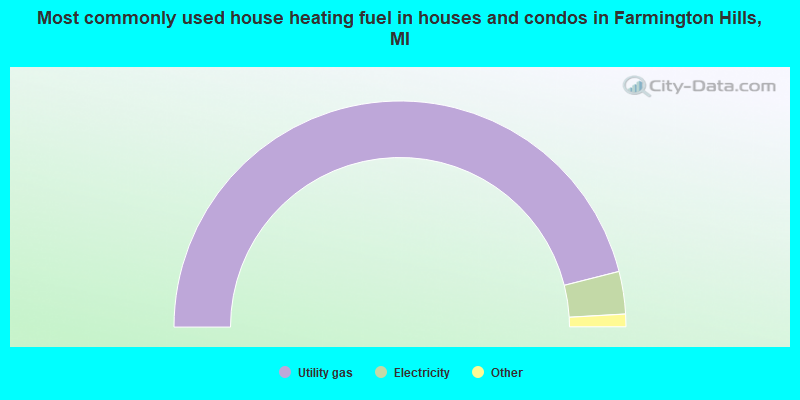
House heating fuel used in houses and condos - Utility gas (%)
House heating fuel used in houses and condos - Bottled, tank, or LP gas (%)
House heating fuel used in houses and condos - Electricity (%)
House heating fuel used in houses and condos - Fuel oil, kerosene, etc. (%)
House heating fuel used in houses and condos - Coal or coke (%)
House heating fuel used in houses and condos - Wood (%)
House heating fuel used in houses and condos - Solar energy (%)
House heating fuel used in houses and condos - Other fuel (%)
House heating fuel used in houses and condos - No fuel used (%)
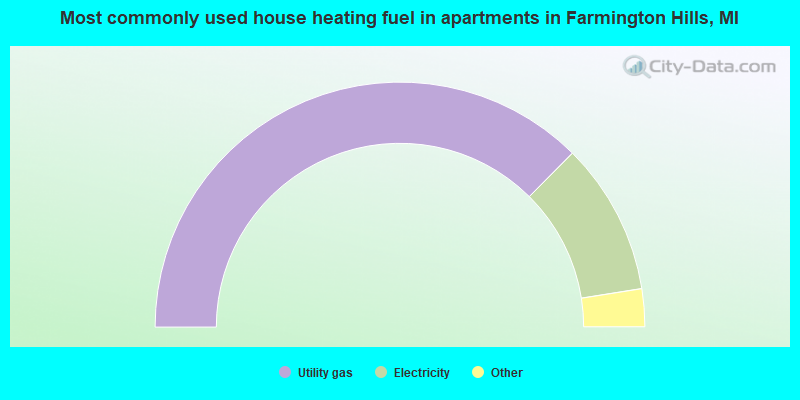
House heating fuel used in apartments - Utility gas (%)
House heating fuel used in apartments - Bottled, tank, or LP gas (%)
House heating fuel used in apartments - Electricity (%)
House heating fuel used in apartments - Fuel oil, kerosene, etc. (%)
House heating fuel used in apartments - Coal or coke (%)
House heating fuel used in apartments - Wood (%)
House heating fuel used in apartments - Solar energy (%)
House heating fuel used in apartments - Other fuel (%)
House heating fuel used in apartments - No fuel used (%)
Median year house/condo built: 1976Median year apartment built: 1981Household type by relationship:
Households: 82,738
Male householders: 19,295 (5,126 living alone ), Female householders: 15,203 (4,429 living alone )17,273 spouses (17,189 opposite-sex spouses ), 1,989 unmarried partners , (1,956 opposite-sex unmarried partners ), 22,036 children (20,745 natural , 536 adopted , 755 stepchildren ), 1,118 grandchildren , 346 brothers or sisters , 1,292 parents , 96 foster children , 1,201 other relatives , 1,979 non-relatives In group quarters: 910
Size of family households: 11,002 2-persons , 6,176 3-persons , 3,095 4-persons , 1,362 5-persons , 727 6-persons , 73 7-or-more-persons .
Size of nonfamily households: 9,555 1-person , 2,286 2-persons , 140 3-persons , 82 7-or-more-persons .
10,695 married couples with children. single-parent households (561 men , 2,366 women ).
76.4% of residents of Farmington Hills speak English at home. of residents speak Spanish at home (65% speak English very well , 8% speak English well , 2% speak English not well , 25% don't speak English at all ).of residents speak other Indo-European language at home (81% speak English very well , 12% speak English well , 5% speak English not well , 2% don't speak English at all ).of residents speak Asian or Pacific Island language at home (68% speak English very well , 27% speak English well , 5% speak English not well ).of residents speak other language at home (71% speak English very well , 17% speak English well , 10% speak English not well , 2% don't speak English at all ).
Foreign born population: 17,540 (21.2%)of them are naturalized citizens )
Median number of rooms in houses and condos:
Median number of rooms in apartments
Owner-occupied Renter-occupied
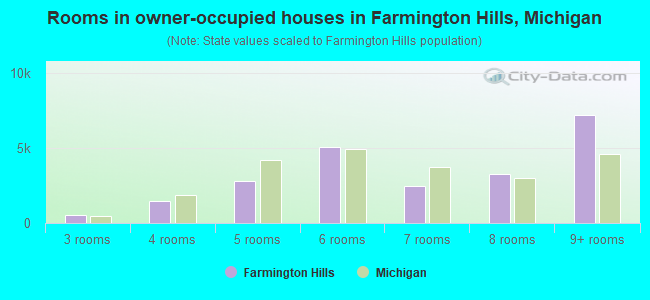
Rooms in owner-occupied houses in Farmington Hills, Michigan
0 1 room 0 2 rooms 562 3 rooms 1,445 4 rooms 2,795 5 rooms 5,080 6 rooms 2,466 7 rooms 3,303 8 rooms 7,220 9+ rooms
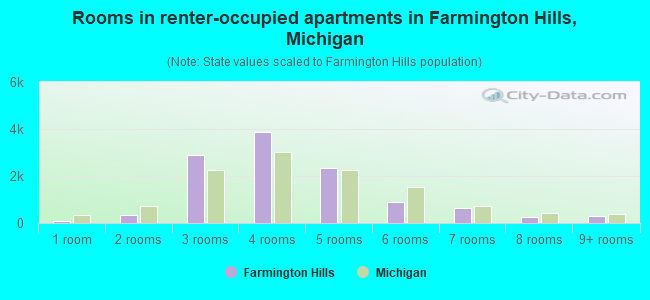
Rooms in renter-occupied apartments in Farmington Hills, Michigan
90 1 room 345 2 rooms 2,873 3 rooms 3,885 4 rooms 2,350 5 rooms 911 6 rooms 632 7 rooms 248 8 rooms 293 9+ rooms
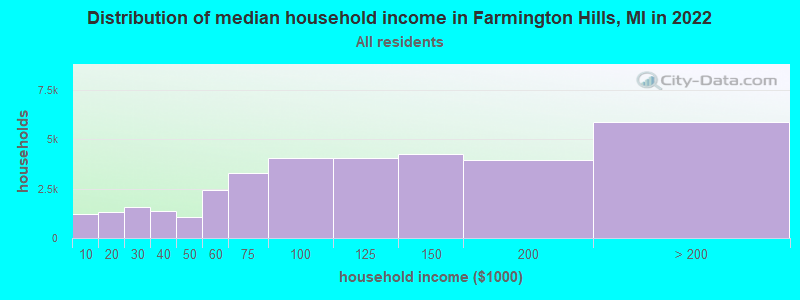
Farmington Hills, MI household income distribution 1,236 Less than $10,0001,321 $10,000 to $19,9991,562 $20,000 to $29,9991,356 $30,000 to $39,9991,075 $40,000 to $49,9992,434 $50,000 to $59,9993,283 $60,000 to $74,9994,045 $75,000 to $99,9994,060 $100,000 to $124,9994,282 $125,000 to $149,9993,964 $150,000 to $199,9995,880 $200,000 or more
Home value of owner - occupied houses in 2022 in Farmington Hills, MI 199 Less than $10,000152 $10,000 to $14,99929 $15,000 to $19,99952 $20,000 to $24,99911 $25,000 to $29,99992 $30,000 to $34,99924 $35,000 to $39,999143 $40,000 to $49,999150 $50,000 to $59,999230 $60,000 to $69,999102 $70,000 to $79,999188 $80,000 to $89,99916 $90,000 to $99,999439 $100,000 to $124,999503 $125,000 to $149,999734 $150,000 to $174,999659 $175,000 to $199,9992,656 $200,000 to $249,9992,788 $250,000 to $299,9997,309 $300,000 to $399,9994,426 $400,000 to $499,9992,098 $500,000 to $749,999176 $750,000 to $999,99961 $1,000,000 to $1,499,99916 $1,500,000 to $1,999,99949 $2,000,000 or moreRent paid by renters in 2022 in Farmington Hills, MI 54 $100 to $14925 $150 to $199236 $200 to $24972 $250 to $29957 $300 to $34912 $350 to $39943 $400 to $44929 $450 to $49962 $500 to $54965 $550 to $59990 $600 to $64947 $650 to $699139 $700 to $749360 $750 to $799740 $800 to $8991,330 $900 to $9992,345 $1,000 to $1,2492,773 $1,250 to $1,4992,964 $1,500 to $1,999278 $2,000 to $2,499385 $2,500 to $2,99964 $3,000 to $3,49958 $3,500 or more414 No cash rent
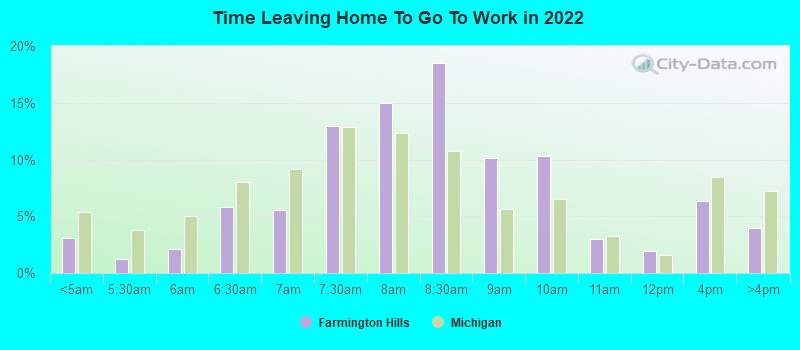
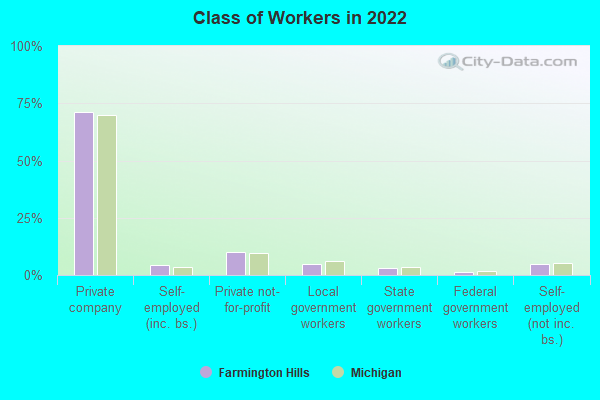
Percentage of workers working in this county: 69.3%Number of people working at home: 10,803 (23.7% of all workers )
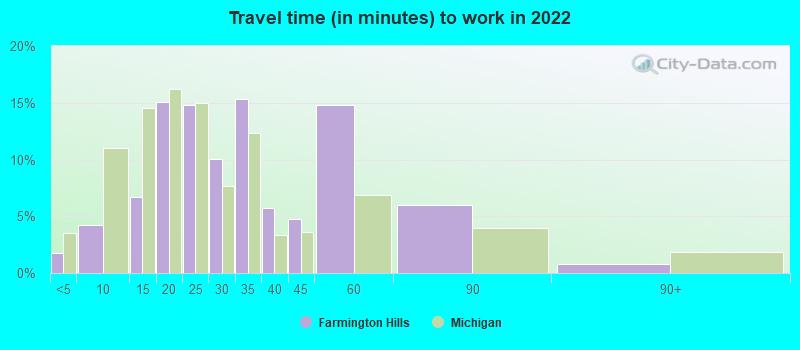
Travel time to work (commute)
Less than 5 minutes: 5585 to 9 minutes: 2,45510 to 14 minutes: 3,11215 to 19 minutes: 5,19920 to 24 minutes: 4,68025 to 29 minutes: 2,78030 to 34 minutes: 5,89235 to 39 minutes: 1,07140 to 44 minutes: 1,69045 to 59 minutes: 1,42260 to 89 minutes: 98990 or more minutes: 833
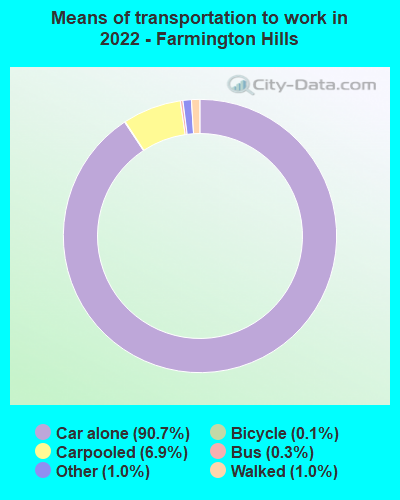
Means of transportation to work:
Drove a car alone: 37,807 (72.3%)Carpooled: 2,773 (5.3%)Bus : 64 (0.1%)Subway or elevated rail : 7 (0.0%)Taxi: 534 (1.0%)Bicycle: 81 (0.2%)Walked: 501 (1.0%)Worked at home: 10,803 (20.7%)
Unemployment by race in 2022
Unemployment rate for White non-Hispanic residents 4.4% Males2.1% FemalesUnemployment rate for Black residents 7.6% Males6.2% FemalesUnemployment rate for American Indian and Alaska Native residents 2.9% MalesUnemployment rate for Asian residents 0.6% Males7.4% FemalesUnemployment rate for other race residents 17.4% Males16.3% FemalesUnemployment rate for two or more race residents 7.9% Males0.6% FemalesUnemployment rate for Hispanic or Latino residents 4.8% Males7.1% Females
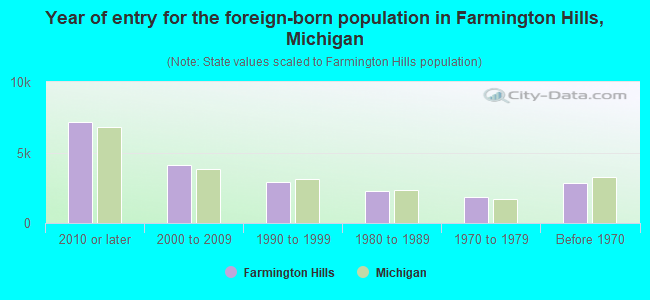
Year of entry for the foreign-born population in Farmington Hills, Michigan
7,177 2010 or later 4,120 2000 to 2009 2,877 1990 to 1999 2,275 1980 to 1989 1,874 1970 to 1979 2,824 Before 1970
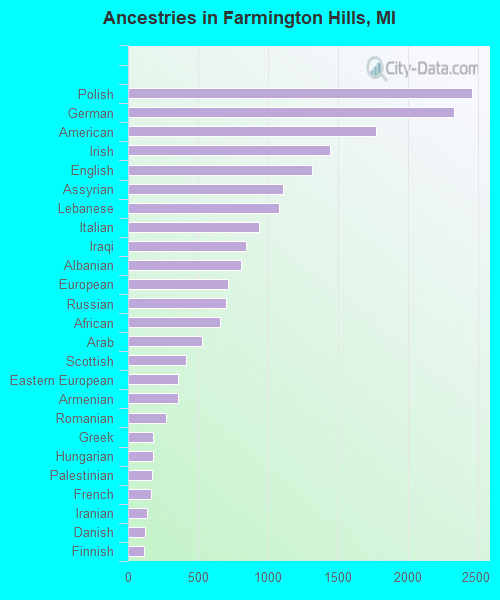
First ancestries reported:
Polish: 2,457 (5.5%)
German: 2,328 (5.2%)
American: 1,773 (3.9%)
Irish: 1,441 (3.2%)
English: 1,318 (2.9%)
Assyrian: 1,108 (2.5%)
Lebanese: 1,082 (2.4%)
Italian: 937 (2.1%)
Iraqi: 841 (1.9%)
Albanian: 810 (1.8%)
European: 717 (1.6%)
Russian: 698 (1.5%)
African: 656 (1.5%)
Arab: 526 (1.2%)
Scottish: 413 (0.9%)
Eastern European: 357 (0.8%)
Armenian: 354 (0.8%)
Romanian: 273 (0.6%)
Greek: 179 (0.4%)
Hungarian: 178 (0.4%)
Palestinian: 170 (0.4%)
French: 161 (0.4%)
Iranian: 137 (0.3%)
Danish: 118 (0.3%)
Finnish: 117 (0.3%)
Dutch: 114 (0.3%)
Yugoslavian: 109 (0.2%)
Canadian: 105 (0.2%)
Czech: 91 (0.2%)
Slovak: 87 (0.2%)
Nigerian: 86 (0.2%)
Ukrainian: 84 (0.2%)
French Canadian: 78 (0.2%)
Macedonian: 72 (0.2%)
Scotch-Irish: 58 (0.1%)
Haitian: 58 (0.1%)
British: 56 (0.1%)
Egyptian: 56 (0.1%)
Syrian: 55 (0.1%)
Austrian: 53 (0.1%)
Moroccan: 50 (0.1%)
Jamaican: 47 (0.1%)
Israeli: 46 (0.1%)
Swedish: 45 (0.10%)
Welsh: 41 (0.09%)
Ugandan: 37 (0.08%)
Northern European: 36 (0.08%)
Brazilian: 33 (0.07%)
Serbian: 33 (0.07%)
Jordanian: 30 (0.07%)
Croatian: 29 (0.06%)
Norwegian: 28 (0.06%)
Lithuanian: 28 (0.06%)
South African: 27 (0.06%)
Trinidadian and Tobagonian: 25 (0.06%)
Maltese: 24 (0.05%)
Scandinavian: 23 (0.05%)
Belgian: 22 (0.05%)
Ethiopian: 20 (0.04%)
Bulgarian: 19 (0.04%)
West Indian: 19 (0.04%)
Slavic: 18 (0.04%)
Turkish: 16 (0.04%)
Sudanese: 11 (0.02%)
Swiss: 10 (0.02%)
Portuguese: 6 (0.01%)
Belizean: 4 (0.01%)
Most common places of birth for foreign-born residents (%): India Farmington Hills:
38.4% (6,574)Michigan:
11.1% (77,240)
Iraq Farmington Hills:
12.0% (2,057)Michigan:
8.1% (55,954)
Lebanon Farmington Hills:
4.8% (827)Michigan:
3.7% (25,634)
Canada Farmington Hills:
3.2% (546)Michigan:
5.0% (35,052)
Japan Farmington Hills:
2.9% (493)Michigan:
1.5% (10,225)
Philippines Farmington Hills:
2.6% (448)Michigan:
2.8% (19,112)
Mexico Farmington Hills:
2.4% (419)Michigan:
10.9% (75,965)
Korea Farmington Hills:
1.9% (332)Michigan:
3.0% (20,884)
Russia Farmington Hills:
1.7% (299)Michigan:
0.9% (6,326)
China, excluding Hong Kong and Taiwan Farmington Hills:
1.7% (289)Michigan:
4.9% (34,295)
Place of birth for U.S.-born residents:
This state: 52,847Other state: 11,255Northeast: 2,113Midwest: 3,653South: 3,626West: 1,863 87.8% of Farmington Hills residents lived in the same house 1 years ago.
Out of people who lived in different houses, 36.5% lived in this county.
Out of people who lived in different counties, 63.4% lived in Michigan.
Farmington Hills:
87.8%State average:
88.4%
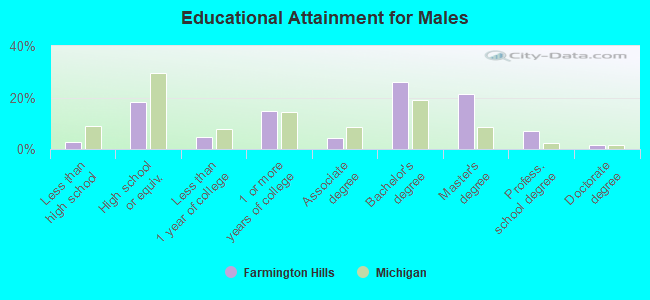
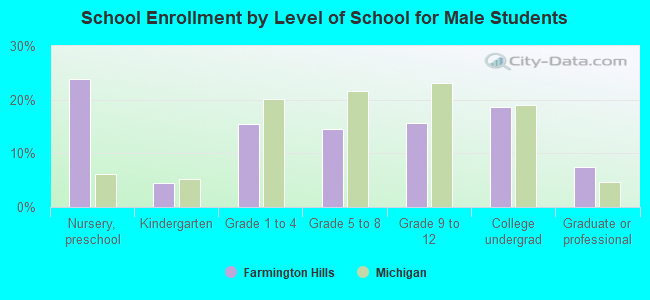
Education attainment for males 25 years and older:
No schooling: 89Nursery to 4th grade: 05th and 6th grade: 2927th and 8th grade: 09th grade: 16910th grade: 10411th grade: 19612th grade, no diploma: 0High school graduate (or equivalency): 5,471Less than 1 year of college: 1,344Some college more than 1 year, no degree: 4,418Associate degree: 1,257Bachelor's degree: 7,831Master's degree: 6,407Professional school degree: 2,076Doctorate degree: 437
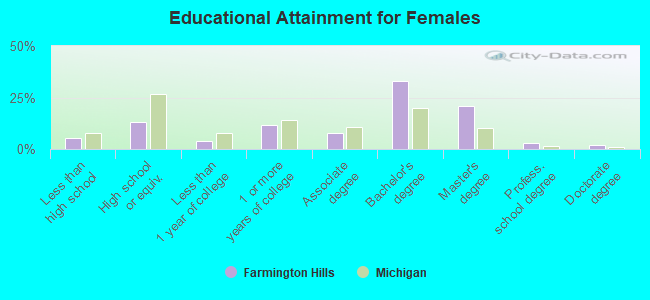
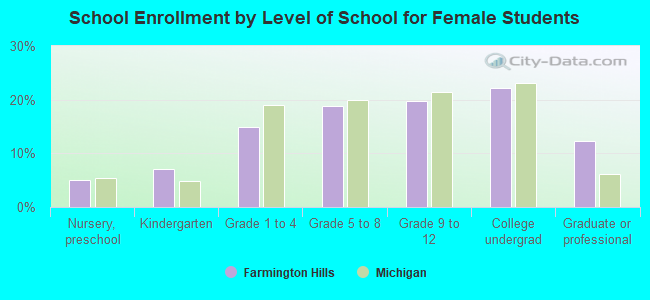
Education attainment for females 25 years and older:
No schooling: 150Nursery to 4th grade: 05th and 6th grade: 07th and 8th grade: 3609th grade: 11410th grade: 25411th grade: 37212th grade, no diploma: 430High school graduate (or equivalency): 4,061Less than 1 year of college: 1,197Some college more than 1 year, no degree: 3,603Associate degree: 2,337Bachelor's degree: 10,229Master's degree: 6,425Professional school degree: 918Doctorate degree: 597
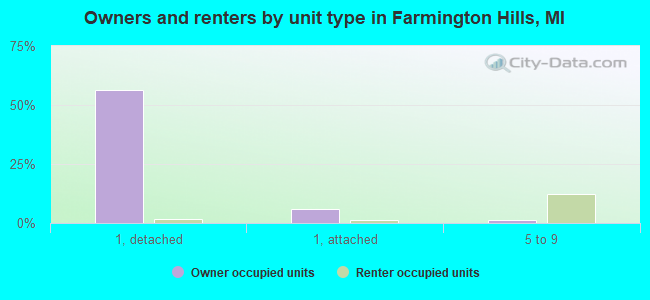
Housing units in structures:
One, detached: 20,862One, attached: 2,752Two: 1,2703 or 4: 1,2565 to 9: 5,07210 to 19: 3,51420 to 49: 58750 or more: 1,504Mobile homes: 424Median worth of mobile homes: $18,500
Housing units lacking complete plumbing facilities in 2022: 0.4%Housing units lacking complete kitchen facilities in 2022: 1.0%House/condo owner moved in on average 14 years ago
Renter moved in on average 2 years ago
Private vs. public school enrollment:
Students in private schools in grades 1 to 8 (elementary and middle school): 1,072 Students in private schools in grades 9 to 12 (high school): 436 Students in private undergraduate colleges: 668