Farmington, UT (Utah) Houses and Residents
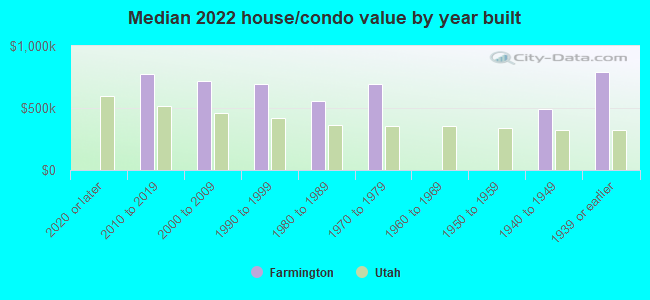
| Farmington: | $699,062 |
| Utah: | $499,500 |
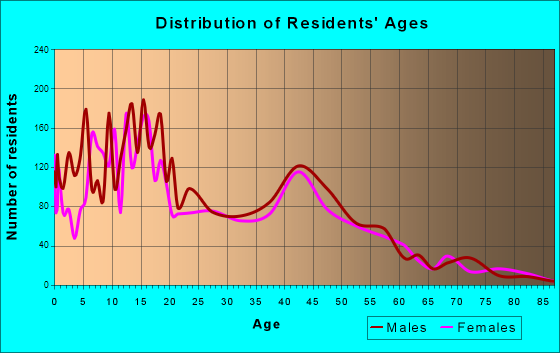
Total population: 22,159 (Urban population: 11,910, Rural population: 295 (all nonfarm))
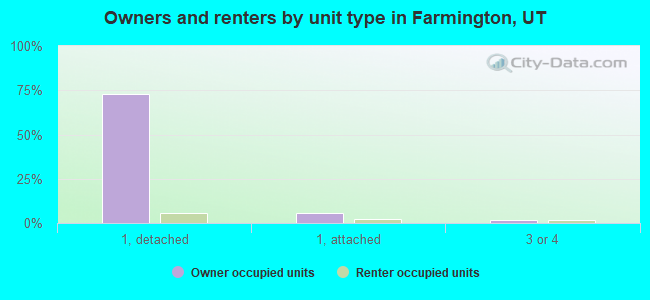
Houses: 7,480 (7,223 occupied: 5,882 owner occupied, 1,287 renter occupied)
| % of renters here: | 18% |
| State: | 29% |
Housing density: 965 houses/condos per square mile
Median price asked for vacant for-sale houses and condos in 2022: $1,127,111.
Median contract rent in 2022: $1,555 (lower quartile is $1,189, upper quartile is over $2,000)
Median rent asked for vacant for-rent units in 2022: $2,134
Median gross rent in Farmington, UT in 2022: $1,619
Housing units in Farmington with a mortgage: 4,243 (600 second mortgage, 58 home equity loan, 475 both second mortgage and home equity loan)
Houses without a mortgage: 106
Median household income for houses/condos with a mortgage: $134,525
Median household income for apartments without a mortgage: $90,103
Median monthly housing costs: $1,854
Compare current foreclosures near Farmington, UT:
| Photo | Address | Area | Beds / Baths | Price | Details |
|---|---|---|---|---|---|

|
#1
E 400 N # B
Farmington, UT 84025
|
1,674 sq. feet
|
- baths - beds |
show details | |

|
#2
W State St, Apt G206
Farmington, UT 84025
|
- sq. feet
|
- baths - beds |
show details | |

|
#3
Secretariat Way
Farmington, UT 84025
|
2,260 sq. feet
|
- baths - beds |
show details | |

|
#4
S Mccall Ln
Farmington, UT 84025
|
- sq. feet
|
- baths - beds |
show details | |

|
#5
N 40 E, Apt 3
Farmington, UT 84025
|
- sq. feet
|
- baths - beds |
show details | |

|
#6
Broadway Apt D307
Farmington, UT 84025
|
- sq. feet
|
- baths - beds |
show details | |

|
#7
Broadway Apt B316
Farmington, UT 84025
|
- sq. feet
|
- baths - beds |
show details | |

|
#8
Broadway Apt D304
Farmington, UT 84025
|
- sq. feet
|
- baths - beds |
show details | |

|
#9
N Jace Ln
Farmington, UT 84025
|
- sq. feet
|
- baths - beds |
show details | |

|
#10
Farmington Xing
Farmington, UT 84025
|
1,496 sq. feet
|
- baths - beds |
show details |
| Photo | Address | Area | Beds / Baths | Price | Details |
|---|---|---|---|---|---|

|
#11
N East Promontory
Farmington, UT 84025
|
- sq. feet
|
- baths - beds |
show details | |

|
#12
Broadway Apt B220
Farmington, UT 84025
|
- sq. feet
|
- baths - beds |
show details | |

|
#13
N 100 E
Farmington, UT 84025
|
1,772 sq. feet
|
- baths - beds |
show details | |

|
#14
W Kenzie Way
Farmington, UT 84025
|
- sq. feet
|
- baths - beds |
show details | |

|
#15
S 75 W
Farmington, UT 84025
|
1,418 sq. feet
|
- baths - beds |
show details | |

|
#16
E 1470 S
Farmington, UT 84025
|
980 sq. feet
|
- baths - beds |
show details | |

|
#17
S 650 W
Farmington, UT 84025
|
- sq. feet
|
- baths - beds |
show details | |

|
#18
N Station Pkwy, Apt G311
Farmington, UT 84025
|
- sq. feet
|
- baths - beds |
show details | |

|
#19
W State St
Farmington, UT 84025
|
1,624 sq. feet
|
- baths - beds |
show details | |

|
#20
Shetland Ln
Farmington, UT 84025
|
1,422 sq. feet
|
- baths - beds |
show details |
| Photo | Address | Area | Beds / Baths | Price | Details |
|---|---|---|---|---|---|

|
#21
S 2900 W
Ogden, UT 84401
|
1,186 sq. feet
|
2 baths 3 beds |
show details | |

|
#22
W 4925 S
Roy, UT 84067
|
3,668 sq. feet
|
1 baths 5 beds |
show details | |

|
#23
N Fairway Dr
North Salt Lake, UT 84054
|
2,929 sq. feet
|
3 baths 4 beds |
show details | |

|
#24
W 300 S
Salt Lake City, UT 84104
|
1,313 sq. feet
|
1 baths 3 beds |
show details | |

|
#25
S 2825 W
Roy, UT 84067
|
979 sq. feet
|
2 baths 5 beds |
show details | |

|
#26
Polk Ave
Ogden, UT 84403
|
1,860 sq. feet
|
1 baths 4 beds |
show details | |

|
#27
W 4275 S
Ogden, UT 84401
|
2,154 sq. feet
|
3 baths 3 beds |
show details | |

|
#28
Foothill Dr
Ogden, UT 84403
|
3,219 sq. feet
|
3 baths 4 beds |
show details | |

|
#29
E Canyon Dr
Ogden, UT 84405
|
1,595 sq. feet
|
2 baths 2 beds |
show details | |

|
#30
N 360 W
Clearfield, UT 84015
|
1,099 sq. feet
|
1 baths 4 beds |
show details |
| Photo | Address | Area | Beds / Baths | Price | Details |
|---|---|---|---|---|---|

|
#31
W 1700 N
Salt Lake City, UT 84116
|
1,404 sq. feet
|
2 baths 2 beds |
show details | |

|
#32
W Springfield Rd
Salt Lake City, UT 84116
|
1,890 sq. feet
|
3 baths 4 beds |
show details | |

|
#33
N Topaz Dr
Salt Lake City, UT 84116
|
1,275 sq. feet
|
2 baths 3 beds |
show details | |

|
#34
W 200 S
Salt Lake City, UT 84104
|
930 sq. feet
|
1 baths 2 beds |
show details | |

|
#35
W 1200 N
Salt Lake City, UT 84116
|
1,683 sq. feet
|
2 baths 3 beds |
show details | |

|
#36
S 700 E Apt 11
Salt Lake City, UT 84102
|
660 sq. feet
|
1 baths 1 beds |
show details | |

|
#37
S Navajo St
Salt Lake City, UT 84104
|
1,107 sq. feet
|
1 baths 3 beds |
show details | |

|
#38
Stallion Ln
Salt Lake City, UT 84116
|
1,412 sq. feet
|
2 baths 4 beds |
show details | |

|
#39
E 700 S
Salt Lake City, UT 84102
|
1,917 sq. feet
|
2 baths 4 beds |
show details | |

|
#40
S 1000 W
Salt Lake City, UT 84104
|
2,457 sq. feet
|
2 baths 4 beds |
show details |
| Photo | Address | Area | Beds / Baths | Price | Details |
|---|---|---|---|---|---|

|
#41
S Pueblo St
Salt Lake City, UT 84104
|
1,606 sq. feet
|
2 baths 3 beds |
show details | |

|
#42
W Springfield Rd
Salt Lake City, UT 84116
|
1,666 sq. feet
|
2 baths 3 beds |
show details | |

|
#43
E 700 S
Salt Lake City, UT 84111
|
2,025 sq. feet
|
1 baths 4 beds |
show details | |

|
#44
S 1000 W
Salt Lake City, UT 84104
|
1,772 sq. feet
|
2 baths 4 beds |
show details | |

|
#45
N Mandalay Rd
Salt Lake City, UT 84116
|
1,805 sq. feet
|
2 baths 3 beds |
show details | |

|
#46
W 600 S
Salt Lake City, UT 84104
|
1,230 sq. feet
|
2 baths 4 beds |
show details | |

|
#47
Chatelain Rd
Ogden, UT 84403
|
- sq. feet
|
2 baths 5 beds |
show details | |

|
#48
W 900 N
Salt Lake City, UT 84116
|
2,661 sq. feet
|
2 baths 4 beds |
show details | |

|
#49
Antilles Dr
Salt Lake City, UT 84116
|
1,358 sq. feet
|
2 baths 3 beds |
show details | |

|
Check over 1 million property listings on Foreclosure.com!
|
browse all offers | |||

Latest news about housing in Farmington, UT collected exclusively by city-data.com from local newspapers, TV, and radio stations

 | Looking for a particular type of homesite in the SLC area (10 replies) |
| Confused about apartments (13 replies) |
| Farmington/Bountiful vs sun crest/South Draper areas (2 replies) |
| Moving to SLC within a month, need renting advice. (6 replies) |
| Good areas with new construction homes? (10 replies) |
| Apartment in good school district (30 replies) |
Median year apartment built: 2003
Household type by relationship:
Households: 24,929- Male householders: 3,773 (565 living alone), Female householders: 3,247 (671 living alone)
5,116 spouses (5,105 opposite-sex spouses), 107 unmarried partners, (107 opposite-sex unmarried partners), 11,160 children (10,428 natural, 179 adopted, 552 stepchildren), 165 grandchildren, 67 brothers or sisters, 116 parents, 0 foster children, 173 other relatives, 310 non-relatives
- In group quarters: 690
Size of family households: 1,824 2-persons, 820 3-persons, 896 4-persons, 1,281 5-persons, 655 6-persons, 348 7-or-more-persons.
Size of nonfamily households: 1,171 1-person, 100 2-persons, 66 3-persons.
7,976 married couples with children.
501 single-parent households (34 men, 467 women).
92.2% of residents of Farmington speak English at home.
4.4% of residents speak Spanish at home (79% speak English very well, 20% speak English well, 1% speak English not well).
1.4% of residents speak other Indo-European language at home (90% speak English very well, 7% speak English well, 3% speak English not well).
1.3% of residents speak Asian or Pacific Island language at home (95% speak English very well, 2% speak English well, 4% speak English not well).
Foreign born population: 906 (3.6%)
(76.0% of them are naturalized citizens)
| Here: | 10.0 |
| State: | 7.6 |
| Here: | 4.3 |
| State: | 4.3 |
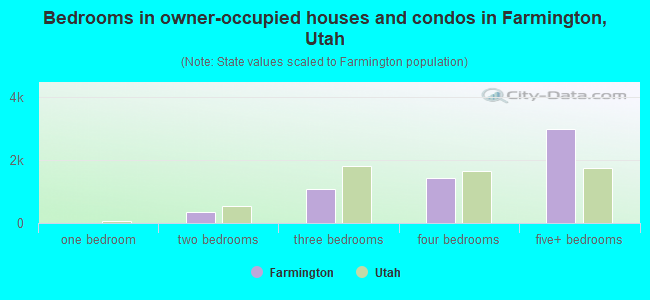
- Bedrooms in owner-occupied houses and condos in Farmington, Utah
- 0no bedroom
- 81 bedroom
- 3482 bedrooms
- 1,0933 bedrooms
- 1,4394 bedrooms
- 2,9955+ bedrooms
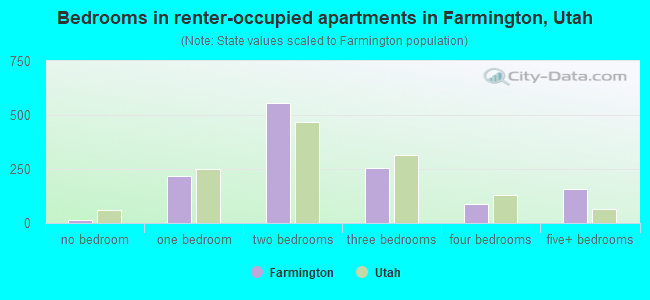
- Bedrooms in renter-occupied apartments in Farmington, Utah
- 15no bedroom
- 2171 bedroom
- 5562 bedrooms
- 2543 bedrooms
- 894 bedrooms
- 1565+ bedrooms
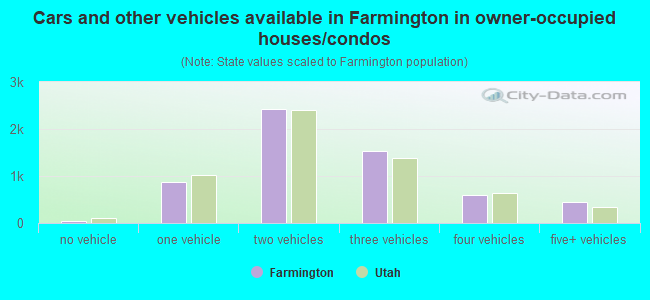
- Cars and other vehicles available in Farmington in owner-occupied houses/condos
- 42no vehicle
- 8691 vehicle
- 2,4172 vehicles
- 1,5223 vehicles
- 5944 vehicles
- 4385+ vehicles
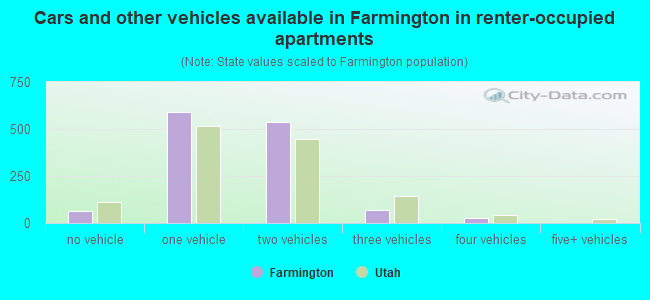
- Cars and other vehicles available in Farmington in renter-occupied apartments
- 62no vehicle
- 5921 vehicle
- 5362 vehicles
- 693 vehicles
- 284 vehicles
- 05+ vehicles
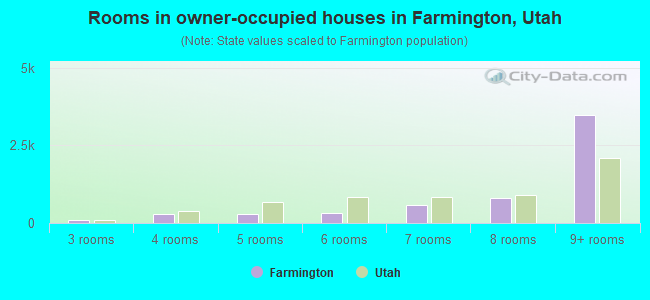
- Rooms in owner-occupied houses in Farmington, Utah
- 01 room
- 02 rooms
- 953 rooms
- 2994 rooms
- 2795 rooms
- 3296 rooms
- 5817 rooms
- 8198 rooms
- 3,4829+ rooms
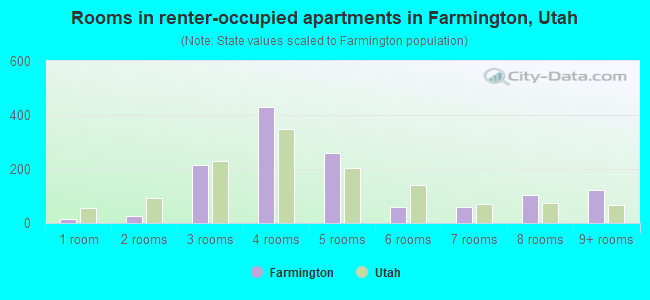
- Rooms in renter-occupied apartments in Farmington, Utah
- 151 room
- 252 rooms
- 2163 rooms
- 4284 rooms
- 2615 rooms
- 586 rooms
- 607 rooms
- 1028 rooms
- 1229+ rooms
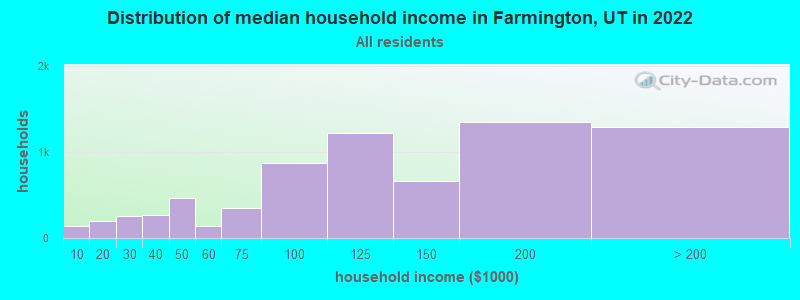
Farmington, UT household income distribution

- 142Less than $10,000
- 197$10,000 to $19,999
- 257$20,000 to $29,999
- 269$30,000 to $39,999
- 463$40,000 to $49,999
- 144$50,000 to $59,999
- 345$60,000 to $74,999
- 867$75,000 to $99,999
- 1,222$100,000 to $124,999
- 662$125,000 to $149,999
- 1,347$150,000 to $199,999
- 1,294$200,000 or more
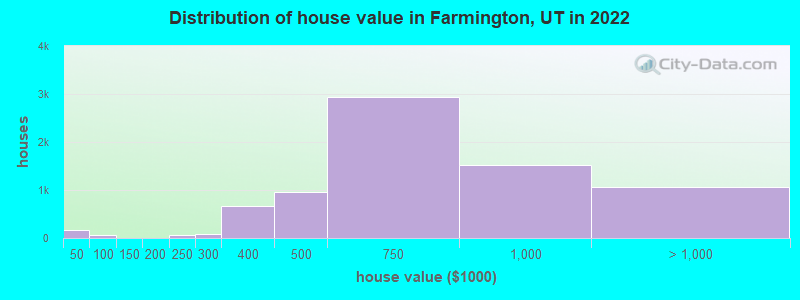
Home value of owner - occupied houses in 2022 in Farmington, UT
-
- 131Less than $10,000
- 30$40,000 to $49,999
- 7$50,000 to $59,999
- 26$60,000 to $69,999
- 5$90,000 to $99,999
- 5$150,000 to $174,999
- 5$175,000 to $199,999
- 55$200,000 to $249,999
- 73$250,000 to $299,999
- 661$300,000 to $399,999
- 952$400,000 to $499,999
- 2,941$500,000 to $749,999
- 1,529$750,000 to $999,999
- 916$1,000,000 to $1,499,999
- 27$1,500,000 to $1,999,999
- 110$2,000,000 or more
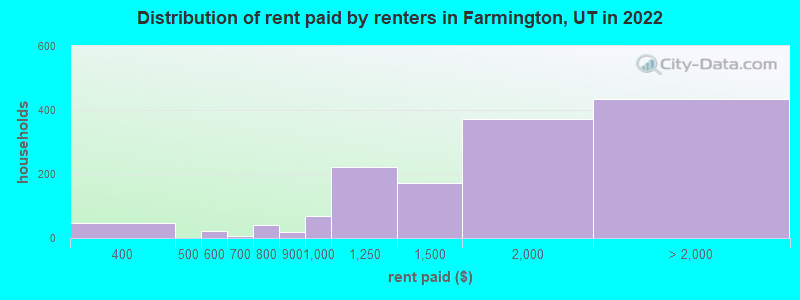
Rent paid by renters in 2022 in Farmington, UT
-
- 48$350 to $399
- 21$550 to $599
- 5$650 to $699
- 40$750 to $799
- 20$800 to $899
- 69$900 to $999
- 222$1,000 to $1,249
- 171$1,250 to $1,499
- 371$1,500 to $1,999
- 267$2,000 to $2,499
- 34$2,500 to $2,999
- 130No cash rent
Percentage of workers working in this county: 68.9%
Number of people working at home: 2,907 (26.6% of all workers)
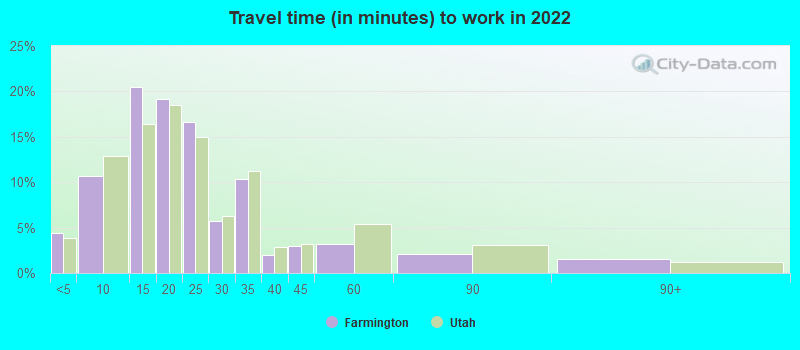
Travel time to work (commute)
- Less than 5 minutes: 232
- 5 to 9 minutes: 895
- 10 to 14 minutes: 1,134
- 15 to 19 minutes: 1,739
- 20 to 24 minutes: 1,250
- 25 to 29 minutes: 566
- 30 to 34 minutes: 1,237
- 35 to 39 minutes: 324
- 40 to 44 minutes: 422
- 45 to 59 minutes: 302
- 60 to 89 minutes: 80
- 90 or more minutes: 50
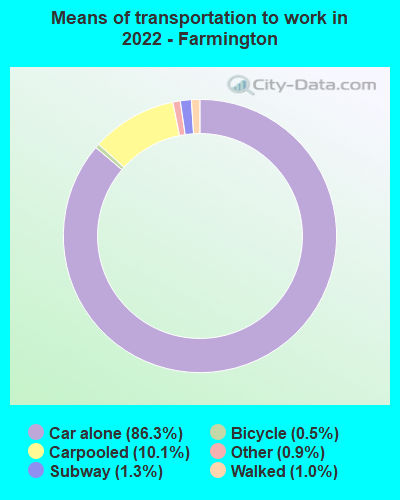
Means of transportation to work:
- Drove a car alone: 7,450 (63.3%)
- Carpooled: 1,099 (9.3%)
- Long-distance train or commuter rail: 114 (1.0%)
- Taxi: 103 (0.9%)
- Bicycle: 40 (0.3%)
- Walked: 84 (0.7%)
- Worked at home: 2,907 (24.7%)
- Unemployment by race in 2022
- Unemployment rate for White non-Hispanic residents
- 1.4%Males
- 2.0%Females
- Unemployment rate for Black residents
- 16.8%Males
- Unemployment rate for two or more race residents
- 13.9%Males
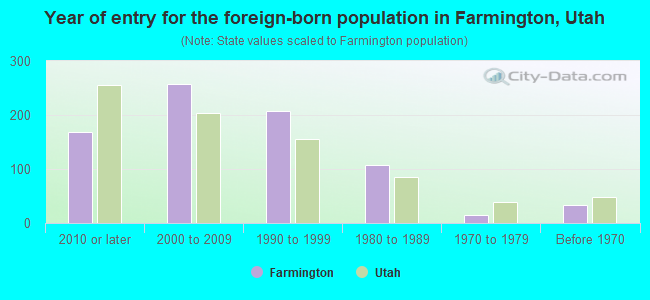
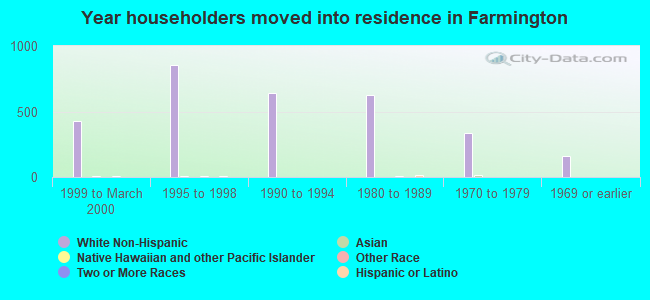
- Year of entry for the foreign-born population in Farmington, Utah
- 1682010 or later
- 2582000 to 2009
- 2081990 to 1999
- 1071980 to 1989
- 141970 to 1979
- 33Before 1970
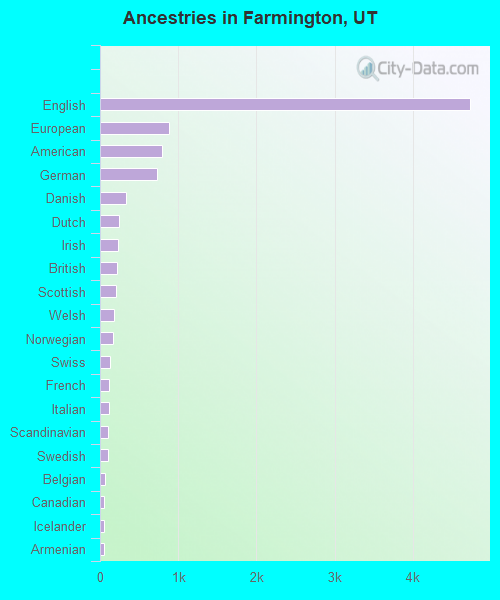
First ancestries reported:
- English: 4,738 (40.1%)
- European: 884 (7.5%)
- American: 793 (6.7%)
- German: 724 (6.1%)
- Danish: 333 (2.8%)
- Dutch: 243 (2.1%)
- Irish: 225 (1.9%)
- British: 217 (1.8%)
- Scottish: 207 (1.8%)
- Welsh: 179 (1.5%)
- Norwegian: 163 (1.4%)
- Swiss: 129 (1.1%)
- French: 121 (1.0%)
- Italian: 110 (0.9%)
- Scandinavian: 99 (0.8%)
- Swedish: 97 (0.8%)
- Belgian: 58 (0.5%)
- Canadian: 52 (0.4%)
- Icelander: 49 (0.4%)
- Armenian: 45 (0.4%)
- French Canadian: 35 (0.3%)
- Polish: 19 (0.2%)
- Northern European: 17 (0.1%)
- Iranian: 16 (0.1%)
- Greek: 8 (0.07%)
- Australian: 6 (0.05%)
- Eastern European: 3 (0.03%)
- Croatian: 1 (0.01%)
Most common places of birth for foreign-born residents (%):
| Farmington: | 13.4% (157) |
| Utah: | 2.7% (7,472) |
| Farmington: | 12.8% (150) |
| Utah: | 1.5% (4,247) |
| Farmington: | 9.8% (115) |
| Utah: | 36.1% (99,740) |
| Farmington: | 9.2% (108) |
| Utah: | 2.3% (6,468) |
| Farmington: | 8.1% (95) |
| Utah: | 3.0% (8,341) |
| Farmington: | 5.9% (69) |
| Utah: | 0.3% (896) |
| Farmington: | 5.6% (65) |
| Utah: | 0.6% (1,529) |
| Farmington: | 4.9% (57) |
| Utah: | 2.9% (8,017) |
| Farmington: | 3.9% (46) |
| Utah: | 0.5% (1,315) |
| Farmington: | 2.7% (32) |
| Utah: | 2.8% (7,644) |
| Farmington: | 2.5% (29) |
| Utah: | 2.6% (7,211) |
| Farmington: | 2.5% (29) |
| Utah: | 1.3% (3,570) |
| Farmington: | 2.2% (26) |
| Utah: | 2.1% (5,902) |
| Farmington: | 1.8% (21) |
| Utah: | 2.6% (7,062) |
Place of birth for U.S.-born residents:
- This state: 17,264
- Other state: 6,510
- Northeast: 510
- Midwest: 1,252
- South: 720
- West: 4,088
88.5% of Farmington residents lived in the same house 1 years ago.
Out of people who lived in different houses, 41.3% lived in this county.
Out of people who lived in different counties, 60.0% lived in Utah.
| Farmington: | 88.5% |
| State average: | 85.7% |
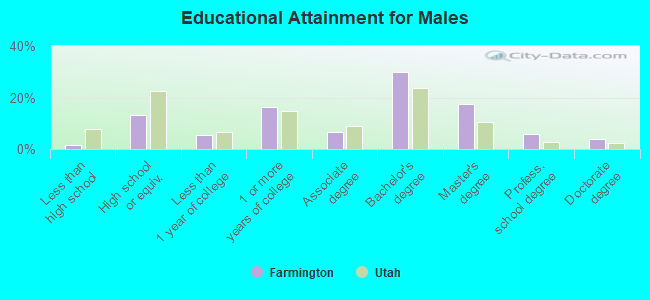
Education attainment for males 25 years and older:
- No schooling: 52
- Nursery to 4th grade: 0
- 5th and 6th grade: 0
- 7th and 8th grade: 7
- 9th grade: 7
- 10th grade: 7
- 11th grade: 28
- 12th grade, no diploma: 16
- High school graduate (or equivalency): 939
- Less than 1 year of college: 374
- Some college more than 1 year, no degree: 1,156
- Associate degree: 468
- Bachelor's degree: 2,099
- Master's degree: 1,224
- Professional school degree: 415
- Doctorate degree: 270
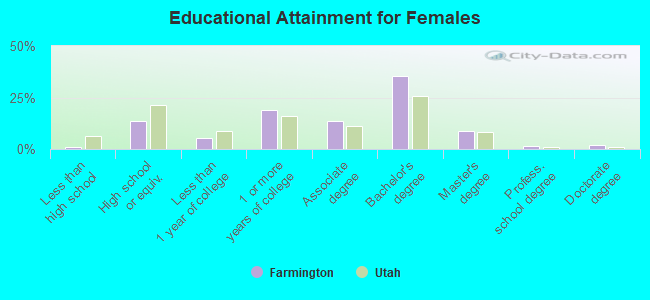
Education attainment for females 25 years and older:
- No schooling: 1
- Nursery to 4th grade: 0
- 5th and 6th grade: 8
- 7th and 8th grade: 8
- 9th grade: 0
- 10th grade: 0
- 11th grade: 22
- 12th grade, no diploma: 28
- High school graduate (or equivalency): 962
- Less than 1 year of college: 394
- Some college more than 1 year, no degree: 1,333
- Associate degree: 979
- Bachelor's degree: 2,531
- Master's degree: 623
- Professional school degree: 108
- Doctorate degree: 129
Housing units in structures:
- One, detached: 5,920
- One, attached: 491
- Two: 61
- 3 or 4: 235
- 5 to 9: 122
- 10 to 19: 94
- 20 to 49: 221
- 50 or more: 278
- Mobile homes: 53
Housing units lacking complete kitchen facilities in 2022: 1.5%
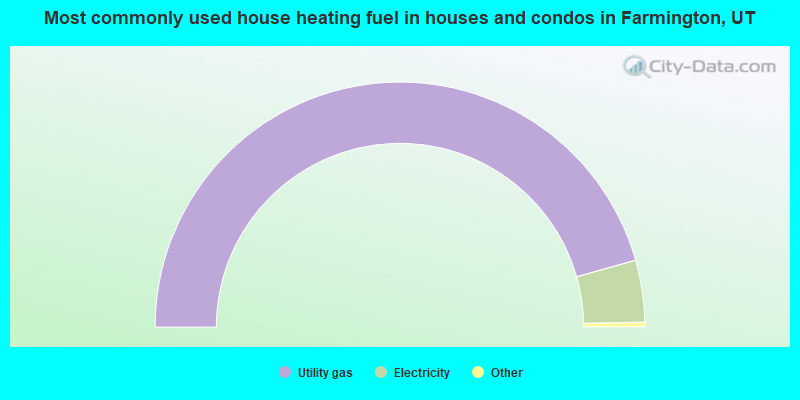
- 91.2%Utility gas
- 8.2%Electricity
- 0.4%Bottled, tank, or LP gas
- 0.1%Solar energy
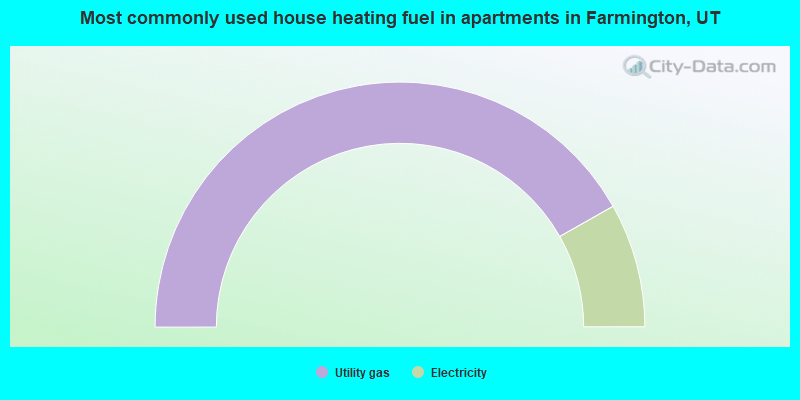
- 83.6%Utility gas
- 16.4%Electricity
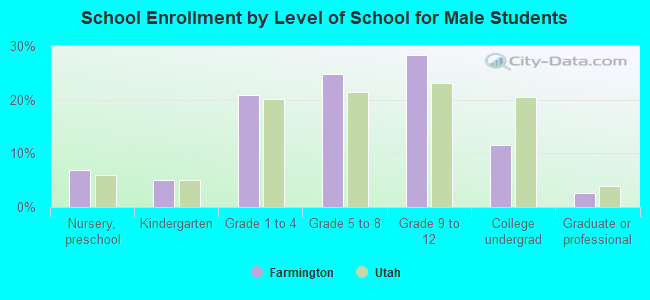
Private vs. public school enrollment:
| Here: | 5.7% |
| Utah: | 7.2% |
| Here: | 2.6% |
| Utah: | 5.3% |
| Here: | 23.6% |
| Utah: | 26.7% |