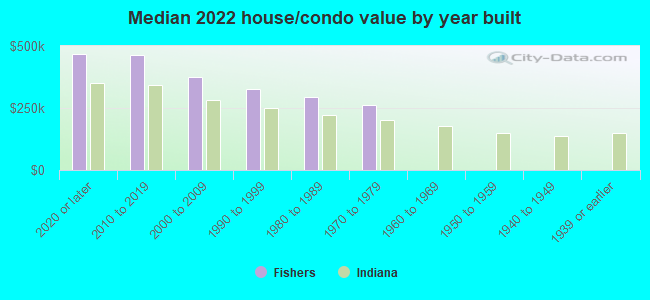
Fishers, IN (Indiana) Houses and Residents
| Fishers: | $368,600 |
| Indiana: | $208,700 |
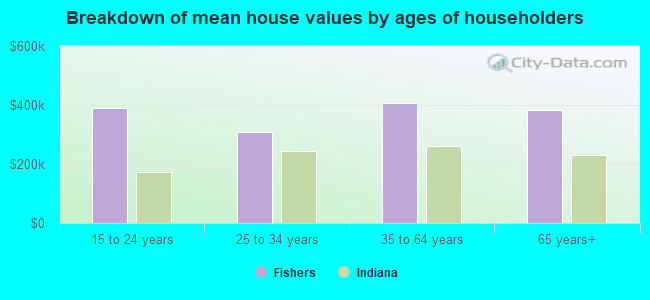
Mean price in 2022:
Detached houses: $425,193
Here: $425,193 State: $257,916 Townhouses or other attached units: $246,561
Here: $246,561 State: $224,114 In 3-to-4-unit structures: $187,737
Here: $187,737 State: $151,116 In 5-or-more-unit structures: $194,279
Here: $194,279 State: $200,844
Total population: 86,325 (Urban population: 38,310, Rural population: 627 (29 farm, 598 nonfarm))
Houses: 39,898 (38,086 occupied: 28,882 owner occupied, 9,204 renter occupied)
| % of renters here: | 24% |
| State: | 29% |
Housing density: 1,839 houses/condos per square mile
Median price asked for vacant for-sale houses and condos in 2022: $595,953.
Median contract rent in 2022: $1,305 (lower quartile is $1,109, upper quartile is $1,680)
Median rent asked for vacant for-rent units in 2022: $1,145
Median gross rent in Fishers, IN in 2022: $1,440
Housing units in Fishers with a mortgage: 22,986 (2,978 second mortgage, 78 home equity loan, 2,188 both second mortgage and home equity loan)
Houses without a mortgage: 275
Median household income for houses/condos with a mortgage: $156,027
Median household income for apartments without a mortgage: $100,960
Median monthly housing costs: $1,568
Compare current foreclosures in Fishers, IN:
| Photo | Address | Area | Beds / Baths | Price | Details |
|---|---|---|---|---|---|

|
#1
Aspen Dr
Fishers, IN 46037
|
1,872 sq. feet
|
3 baths 3 beds |
show details | |

|
#2
Golden Ash Ct
Fishers, IN 46038
|
1,290 sq. feet
|
2 baths 3 beds |
show details | |

|
#3
Exeter Ct
Fishers, IN 46038
|
1,644 sq. feet
|
2 baths 3 beds |
show details | |

|
#4
Eddington Pl
Fishers, IN 46037
|
2,138 sq. feet
|
2 baths 3 beds |
show details | |

|
#5
Mercer Dr
Fishers, IN 46038
|
1,862 sq. feet
|
2 baths 3 beds |
show details | |

|
#6
Juniper Breeze Dr
Fishers, IN 46038
|
3,167 sq. feet
|
2 baths 3 beds |
show details | |

|
#7
Roundtree Rd
Fishers, IN 46037
|
2,280 sq. feet
|
2 baths 3 beds |
show details | |

|
#8
Schoolhouse Rd
Fishers, IN 46037
|
3,008 sq. feet
|
2 baths 3 beds |
show details | |

|
#9
Roxbury Dr
Fishers, IN 46038
|
992 sq. feet
|
2 baths 3 beds |
show details | |

|
#10
Indigo Ln
Fishers, IN 46038
|
1,726 sq. feet
|
2 baths 3 beds |
show details |
| Photo | Address | Area | Beds / Baths | Price | Details |
|---|---|---|---|---|---|

|
#11
Stratford Dr S
Fishers, IN 46038
|
1,542 sq. feet
|
2 baths 3 beds |
show details | |

|
#12
Wadsworth Ct
Fishers, IN 46037
|
1,648 sq. feet
|
2 baths 3 beds |
show details | |

|
#13
Hartford Ln
Fishers, IN 46038
|
1,958 sq. feet
|
2 baths 4 beds |
show details | |

|
#14
Covington Blvd
Fishers, IN 46037
|
2,276 sq. feet
|
2 baths 3 beds |
show details | |

|
#15
Ashton Dr
Fishers, IN 46038
|
2,018 sq. feet
|
2 baths 4 beds |
show details | |

|
#16
Stelor Ct
Fishers, IN 46037
|
3,286 sq. feet
|
2 baths 4 beds |
show details | |

|
#17
Wildwood Dr
Fishers, IN 46037
|
1,671 sq. feet
|
1 baths 3 beds |
show details | |

|
#18
Walrond Rd
Fishers, IN 46037
|
2,896 sq. feet
|
2 baths 3 beds |
show details | |

|
#19
Conner Knoll Pkwy
Fishers, IN 46038
|
1,647 sq. feet
|
2 baths 4 beds |
show details | |

|
#20
Jasmine Ct
Fishers, IN 46038
|
1,950 sq. feet
|
2 baths 3 beds |
show details |
| Photo | Address | Area | Beds / Baths | Price | Details |
|---|---|---|---|---|---|

|
#21
Juniper Breeze Dr
Fishers, IN 46038
|
3,024 sq. feet
|
2 baths 3 beds |
show details | |

|
#22
Hatherley Way
Fishers, IN 46037
|
2,506 sq. feet
|
2 baths 3 beds |
show details | |

|
#23
Avery Row
Fishers, IN 46038
|
2,077 sq. feet
|
2 baths 4 beds |
show details | |

|
#24
Chancery Ln
Fishers, IN 46037
|
2,030 sq. feet
|
1 baths 3 beds |
show details | |

|
#25
Avalon Blvd
Fishers, IN 46037
|
2,104 sq. feet
|
2 baths 3 beds |
show details | |

|
#26
Moonlight Path
Fishers, IN 46038
|
3,026 sq. feet
|
2 baths 3 beds |
show details | |

|
#27
Lee Stewart Ln
Fishers, IN 46038
|
2,806 sq. feet
|
2 baths 3 beds |
show details | |

|
#28
Cedar Dr
Fishers, IN 46037
|
1,658 sq. feet
|
2 baths 3 beds |
show details | |

|
#29
Alyssa Way
Fishers, IN 46037
|
2,304 sq. feet
|
2 baths 4 beds |
show details | |

|
#30
Radnor Way
Fishers, IN 46038
|
3,224 sq. feet
|
3 baths 3 beds |
show details |
| Photo | Address | Area | Beds / Baths | Price | Details |
|---|---|---|---|---|---|

|
#31
Schoolhouse Rd
Fishers, IN 46037
|
2,389 sq. feet
|
2 baths 3 beds |
show details | |

|
#32
Brandamore Ln
Fishers, IN 46037
|
5,158 sq. feet
|
5 baths 3 beds |
show details | |

|
#33
E 126th St
Fishers, IN 46038
|
1,500 sq. feet
|
2 baths 4 beds |
show details | |

|
#34
Torberg Pl
Fishers, IN 46038
|
1,706 sq. feet
|
2 baths 3 beds |
show details | |

|
#35
Meadow Lake Dr
Fishers, IN 46038
|
2,940 sq. feet
|
2 baths 4 beds |
show details | |

|
#36
Pointer Pl
Fishers, IN 46038
|
2,122 sq. feet
|
2 baths 4 beds |
show details | |

|
#37
Woodlark Dr
Fishers, IN 46038
|
1,986 sq. feet
|
2 baths 3 beds |
show details | |

|
#38
Waterton Pl
Fishers, IN 46038
|
2,822 sq. feet
|
2 baths 4 beds |
show details | |

|
#39
Steelers Blvd
Fishers, IN 46037
|
1,589 sq. feet
|
2 baths 4 beds |
show details | |

|
#40
Claymore Dr
Fishers, IN 46038
|
1,468 sq. feet
|
2 baths 3 beds |
show details |
| Photo | Address | Area | Beds / Baths | Price | Details |
|---|---|---|---|---|---|

|
#41
Red Tail Dr
Fishers, IN 46037
|
2,266 sq. feet
|
2 baths 4 beds |
show details | |

|
#42
Timberlake Ln
Fishers, IN 46038
|
1,668 sq. feet
|
2 baths 3 beds |
show details | |

|
#43
Cressida Way
Fishers, IN 46037
|
2,442 sq. feet
|
2 baths 3 beds |
show details | |

|
#44
Prairieview Dr
Fishers, IN 46038
|
1,846 sq. feet
|
2 baths 3 beds |
show details | |

|
#45
Cool Winds Way
Fishers, IN 46037
|
2,540 sq. feet
|
2 baths 3 beds |
show details | |

|
#46
Brightwater Dr
Fishers, IN 46038
|
2,094 sq. feet
|
2 baths 4 beds |
show details | |

|
#47
Madden Dr
Fishers, IN 46038
|
1,482 sq. feet
|
2 baths 3 beds |
show details | |

|
#48
Sweet Creek Trl
Fishers, IN 46037
|
1,580 sq. feet
|
2 baths 4 beds |
show details | |

|
#49
Roundtree Rd
Fishers, IN 46037
|
2,350 sq. feet
|
2 baths 3 beds |
show details | |

|
Check over 1 million property listings on Foreclosure.com!
|
browse all offers | |||

Latest news about housing in Fishers, IN collected exclusively by city-data.com from local newspapers, TV, and radio stations

 | Looking at renting a House in Fishers (1 reply) |
| Carmel Woods apartments/townhomes (3 replies) |
| Apartments between Walkerton & Fishers (5 replies) |
| Sunblest apartments (17 replies) |
| New homes in the Noblesville/Fishers area in the $200k range without vinyl? (15 replies) |
| Why pay a premium to live in Carmel vs Fishers? (21 replies) |
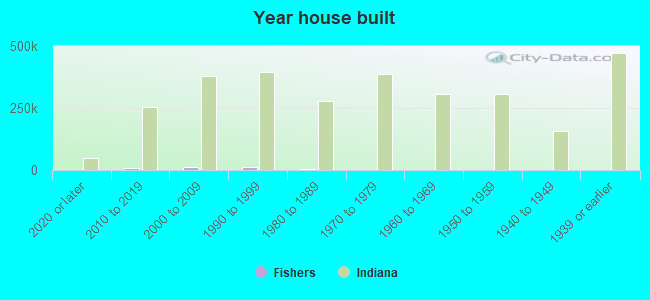
Median year apartment built: 2004
Household type by relationship:
Households: 102,152- Male householders: 21,827 (3,767 living alone), Female householders: 16,259 (5,847 living alone)
22,552 spouses (22,486 opposite-sex spouses), 2,104 unmarried partners, (2,010 opposite-sex unmarried partners), 36,575 children (34,200 natural, 776 adopted, 1,599 stepchildren), 220 grandchildren, 303 brothers or sisters, 1,475 parents, 0 foster children, 0 other relatives, 215 non-relatives
- In group quarters: 622
Size of family households: 10,636 2-persons, 6,738 3-persons, 5,207 4-persons, 3,215 5-persons, 858 6-persons, 619 7-or-more-persons.
Size of nonfamily households: 9,614 1-person, 1,199 2-persons.
23,610 married couples with children.
4,162 single-parent households (901 men, 3,261 women).
87.6% of residents of Fishers speak English at home.
2.0% of residents speak Spanish at home (75% speak English very well, 14% speak English well, 10% speak English not well, 1% don't speak English at all).
4.7% of residents speak other Indo-European language at home (70% speak English very well, 23% speak English well, 4% speak English not well, 3% don't speak English at all).
3.6% of residents speak Asian or Pacific Island language at home (75% speak English very well, 19% speak English well, 5% speak English not well).
2.4% of residents speak other language at home (33% speak English very well, 33% speak English well, 33% speak English not well).
Foreign born population: 11,923 (11.7%)
(46.7% of them are naturalized citizens)
| Here: | 7.6 |
| State: | 6.6 |
| Here: | 4.4 |
| State: | 4.3 |
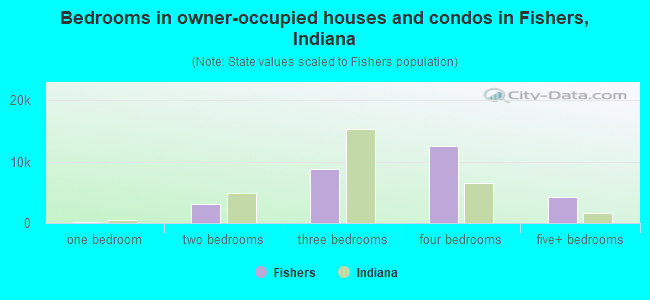
- Bedrooms in owner-occupied houses and condos in Fishers, Indiana
- 0no bedroom
- 1831 bedroom
- 3,1042 bedrooms
- 8,8093 bedrooms
- 12,5174 bedrooms
- 4,2695+ bedrooms
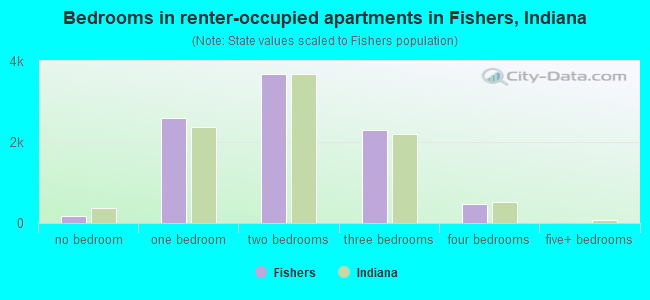
- Bedrooms in renter-occupied apartments in Fishers, Indiana
- 164no bedroom
- 2,6021 bedroom
- 3,6862 bedrooms
- 2,2933 bedrooms
- 4594 bedrooms
- 05+ bedrooms
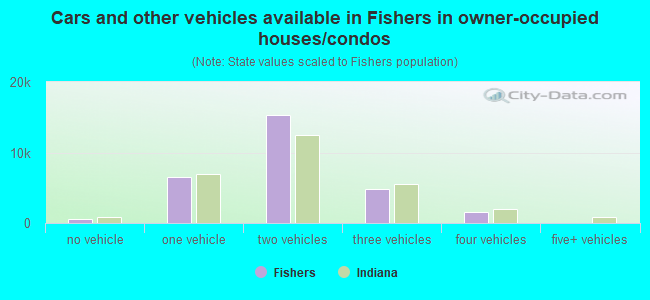
- Cars and other vehicles available in Fishers in owner-occupied houses/condos
- 506no vehicle
- 6,5481 vehicle
- 15,3362 vehicles
- 4,8813 vehicles
- 1,6114 vehicles
- 05+ vehicles
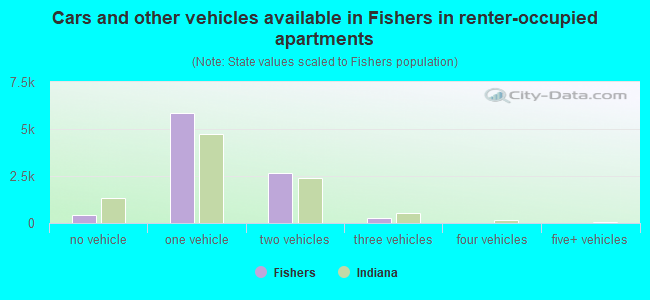
- Cars and other vehicles available in Fishers in renter-occupied apartments
- 436no vehicle
- 5,8681 vehicle
- 2,6432 vehicles
- 2573 vehicles
- 04 vehicles
- 05+ vehicles
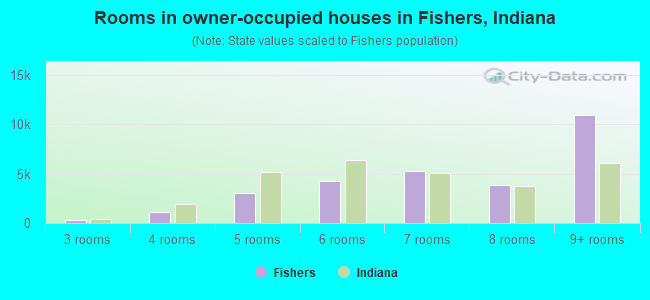
- Rooms in owner-occupied houses in Fishers, Indiana
- 01 room
- 02 rooms
- 3143 rooms
- 1,1484 rooms
- 3,0595 rooms
- 4,2576 rooms
- 5,3037 rooms
- 3,8498 rooms
- 10,9529+ rooms
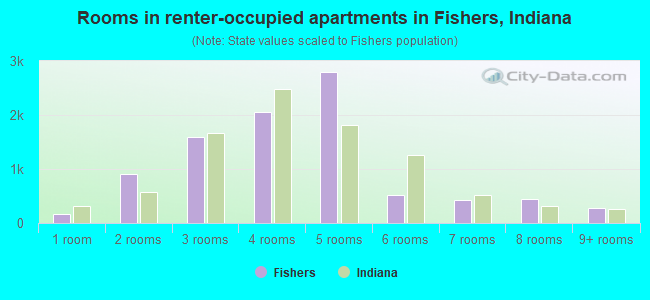
- Rooms in renter-occupied apartments in Fishers, Indiana
- 1641 room
- 9032 rooms
- 1,5993 rooms
- 2,0614 rooms
- 2,7925 rooms
- 5246 rooms
- 4337 rooms
- 4528 rooms
- 2769+ rooms
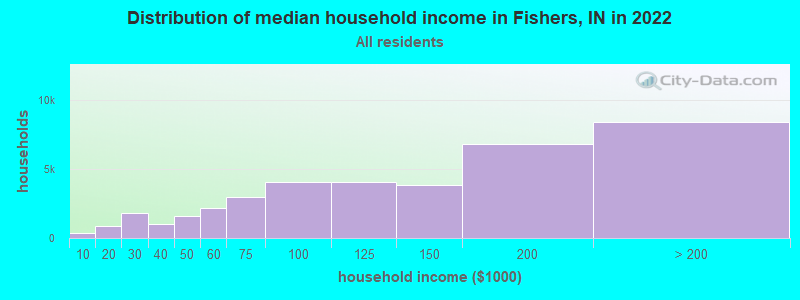
Fishers, IN household income distribution

- 399Less than $10,000
- 886$10,000 to $19,999
- 1,834$20,000 to $29,999
- 1,002$30,000 to $39,999
- 1,609$40,000 to $49,999
- 2,198$50,000 to $59,999
- 2,955$60,000 to $74,999
- 4,044$75,000 to $99,999
- 4,095$100,000 to $124,999
- 3,823$125,000 to $149,999
- 6,816$150,000 to $199,999
- 8,425$200,000 or more
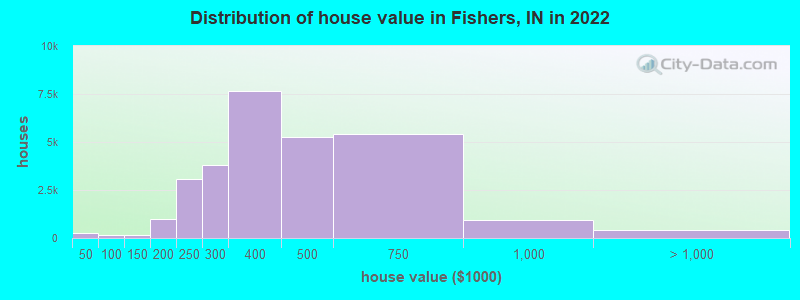
Home value of owner - occupied houses in 2022 in Fishers, IN
-
- 130Less than $10,000
- 6$15,000 to $19,999
- 15$20,000 to $24,999
- 18$30,000 to $34,999
- 94$40,000 to $49,999
- 37$70,000 to $79,999
- 18$90,000 to $99,999
- 61$100,000 to $124,999
- 94$125,000 to $149,999
- 354$150,000 to $174,999
- 641$175,000 to $199,999
- 3,069$200,000 to $249,999
- 3,806$250,000 to $299,999
- 7,679$300,000 to $399,999
- 5,268$400,000 to $499,999
- 5,432$500,000 to $749,999
- 945$750,000 to $999,999
- 152$1,000,000 to $1,499,999
- 256$1,500,000 to $1,999,999
- 30$2,000,000 or more
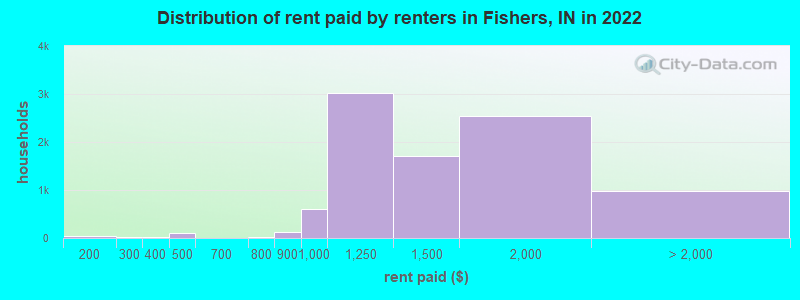
Rent paid by renters in 2022 in Fishers, IN
-
- 34$100 to $149
- 11$250 to $299
- 11$300 to $349
- 39$400 to $449
- 73$450 to $499
- 14$750 to $799
- 128$800 to $899
- 609$900 to $999
- 3,020$1,000 to $1,249
- 1,717$1,250 to $1,499
- 2,545$1,500 to $1,999
- 375$2,000 to $2,499
- 346$2,500 to $2,999
- 36$3,000 to $3,499
- 49$3,500 or more
- 179No cash rent
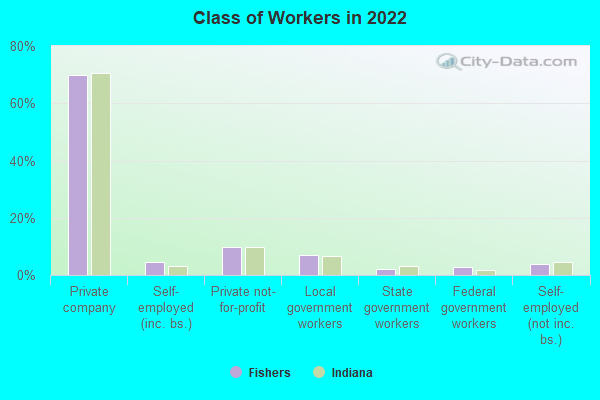
Percentage of workers working in this county: 56.1%
Number of people working at home: 11,426 (20.6% of all workers)
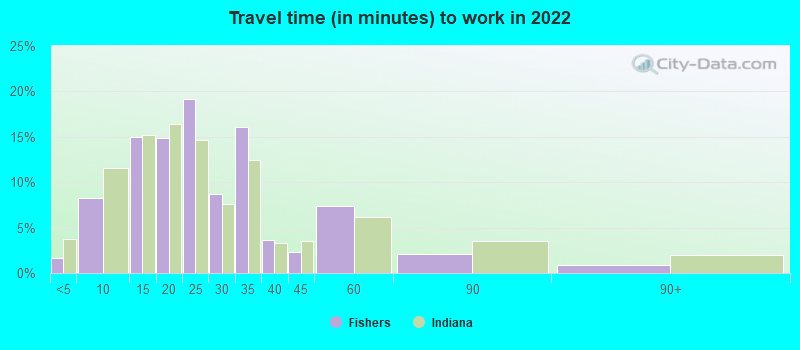
Travel time to work (commute)
- Less than 5 minutes: 545
- 5 to 9 minutes: 2,697
- 10 to 14 minutes: 5,419
- 15 to 19 minutes: 5,720
- 20 to 24 minutes: 4,692
- 25 to 29 minutes: 3,690
- 30 to 34 minutes: 9,064
- 35 to 39 minutes: 1,317
- 40 to 44 minutes: 3,826
- 45 to 59 minutes: 4,762
- 60 to 89 minutes: 734
- 90 or more minutes: 754
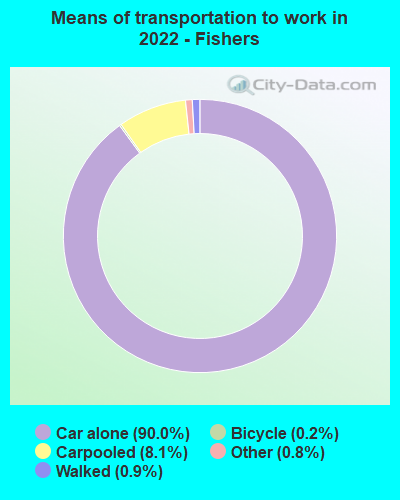
Means of transportation to work:
- Drove a car alone: 26,575 (63.4%)
- Carpooled: 3,360 (8.0%)
- Taxi: 348 (0.8%)
- Bicycle: 125 (0.3%)
- Walked: 240 (0.6%)
- Worked at home: 11,426 (27.3%)
- Unemployment by race in 2022
- Unemployment rate for White non-Hispanic residents
- 0.5%Males
- 1.3%Females
- Unemployment rate for Black residents
- 1.8%Males
- 2.9%Females
- Unemployment rate for Asian residents
- 3.5%Females
- Unemployment rate for other race residents
- 58.7%Females
- Unemployment rate for two or more race residents
- 1.9%Males
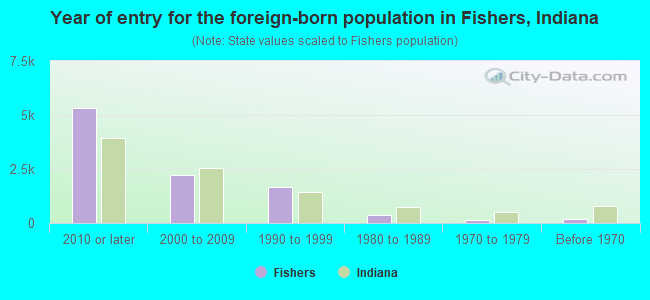
- Year of entry for the foreign-born population in Fishers, Indiana
- 5,3222010 or later
- 2,2372000 to 2009
- 1,6831990 to 1999
- 3801980 to 1989
- 1621970 to 1979
- 185Before 1970
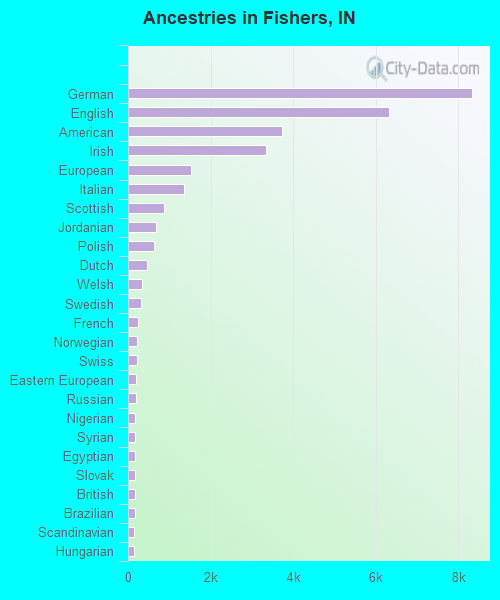
First ancestries reported:
- German: 8,328 (18.4%)
- English: 6,325 (14.0%)
- American: 3,728 (8.2%)
- Irish: 3,332 (7.3%)
- European: 1,525 (3.4%)
- Italian: 1,367 (3.0%)
- Scottish: 872 (1.9%)
- Jordanian: 678 (1.5%)
- Polish: 626 (1.4%)
- Dutch: 469 (1.0%)
- Welsh: 347 (0.8%)
- Swedish: 309 (0.7%)
- French: 252 (0.6%)
- Norwegian: 228 (0.5%)
- Swiss: 216 (0.5%)
- Eastern European: 196 (0.4%)
- Russian: 185 (0.4%)
- Nigerian: 167 (0.4%)
- Syrian: 166 (0.4%)
- Egyptian: 163 (0.4%)
- Slovak: 162 (0.4%)
- British: 160 (0.4%)
- Brazilian: 159 (0.4%)
- Scandinavian: 145 (0.3%)
- Hungarian: 137 (0.3%)
- Czech: 132 (0.3%)
- Romanian: 130 (0.3%)
- African: 127 (0.3%)
- Scotch-Irish: 123 (0.3%)
- Belgian: 92 (0.2%)
- Arab: 91 (0.2%)
- Latvian: 90 (0.2%)
- Portuguese: 67 (0.1%)
- Serbian: 67 (0.1%)
- Lithuanian: 63 (0.1%)
- Yugoslavian: 63 (0.1%)
- Armenian: 54 (0.1%)
- Greek: 50 (0.1%)
- Slovene: 44 (0.10%)
- Ukrainian: 44 (0.10%)
- Austrian: 39 (0.09%)
- Northern European: 39 (0.09%)
- Czechoslovakian: 38 (0.08%)
- Liberian: 35 (0.08%)
- Luxembourger: 25 (0.06%)
- Canadian: 22 (0.05%)
- French Canadian: 21 (0.05%)
- Croatian: 20 (0.04%)
- Celtic: 20 (0.04%)
- Bahamian: 20 (0.04%)
- Iranian: 18 (0.04%)
- Lebanese: 16 (0.04%)
- Jamaican: 15 (0.03%)
- Australian: 10 (0.02%)
Most common places of birth for foreign-born residents (%):
| Fishers: | 26.4% (2,807) |
| Indiana: | 8.5% (32,127) |
| Fishers: | 5.7% (602) |
| Indiana: | 2.1% (7,834) |
| Fishers: | 4.8% (513) |
| Indiana: | 0.9% (3,221) |
| Fishers: | 4.5% (479) |
| Indiana: | 5.3% (19,877) |
| Fishers: | 4.4% (467) |
| Indiana: | 0.7% (2,626) |
| Fishers: | 4.1% (430) |
| Indiana: | 0.4% (1,545) |
| Fishers: | 3.4% (362) |
| Indiana: | 1.8% (6,645) |
| Fishers: | 3.0% (323) |
| Indiana: | 1.8% (6,718) |
| Fishers: | 3.0% (314) |
| Indiana: | 0.1% (450) |
| Fishers: | 2.6% (279) |
| Indiana: | 3.1% (11,851) |
| Fishers: | 2.6% (278) |
| Indiana: | 27.0% (101,996) |
| Fishers: | 2.6% (274) |
| Indiana: | 0.3% (975) |
| Fishers: | 2.3% (242) |
| Indiana: | 2.0% (7,653) |
| Fishers: | 2.2% (238) |
| Indiana: | 0.2% (614) |
| Fishers: | 2.0% (210) |
| Indiana: | 1.2% (4,520) |
| Fishers: | 1.8% (187) |
| Indiana: | 0.8% (2,847) |
| Fishers: | 1.7% (185) |
| Indiana: | 0.6% (2,303) |
Place of birth for U.S.-born residents:
- This state: 58,399
- Other state: 30,335
- Northeast: 3,765
- Midwest: 13,291
- South: 8,414
- West: 4,865
88.2% of Fishers residents lived in the same house 1 years ago.
Out of people who lived in different houses, 34.6% lived in this county.
Out of people who lived in different counties, 57.0% lived in Indiana.
| Fishers: | 88.2% |
| State average: | 87.1% |
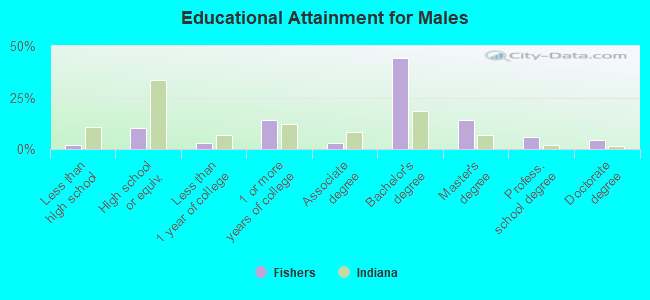
Education attainment for males 25 years and older:
- No schooling: 83
- Nursery to 4th grade: 135
- 5th and 6th grade: 0
- 7th and 8th grade: 0
- 9th grade: 150
- 10th grade: 0
- 11th grade: 67
- 12th grade, no diploma: 110
- High school graduate (or equivalency): 3,223
- Less than 1 year of college: 986
- Some college more than 1 year, no degree: 4,481
- Associate degree: 1,013
- Bachelor's degree: 14,219
- Master's degree: 4,503
- Professional school degree: 1,810
- Doctorate degree: 1,338
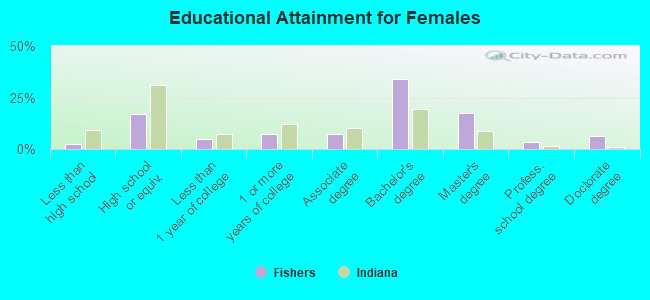
Education attainment for females 25 years and older:
- No schooling: 399
- Nursery to 4th grade: 0
- 5th and 6th grade: 0
- 7th and 8th grade: 88
- 9th grade: 73
- 10th grade: 0
- 11th grade: 96
- 12th grade, no diploma: 162
- High school graduate (or equivalency): 5,953
- Less than 1 year of college: 1,775
- Some college more than 1 year, no degree: 2,575
- Associate degree: 2,550
- Bachelor's degree: 12,102
- Master's degree: 6,271
- Professional school degree: 1,172
- Doctorate degree: 2,210
Housing units in structures:
- One, detached: 28,955
- One, attached: 2,897
- Two: 118
- 3 or 4: 1,548
- 5 to 9: 1,997
- 10 to 19: 1,413
- 20 to 49: 542
- 50 or more: 2,328
- Mobile homes: 100
Housing units lacking complete kitchen facilities in 2022: 1.2%
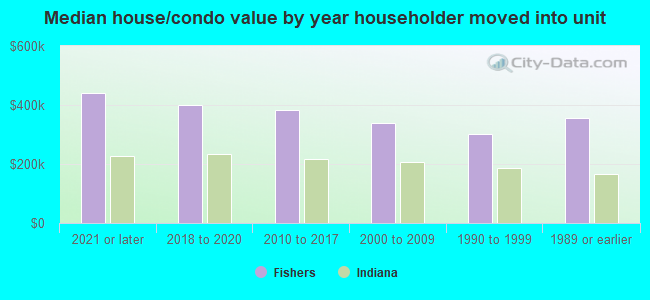
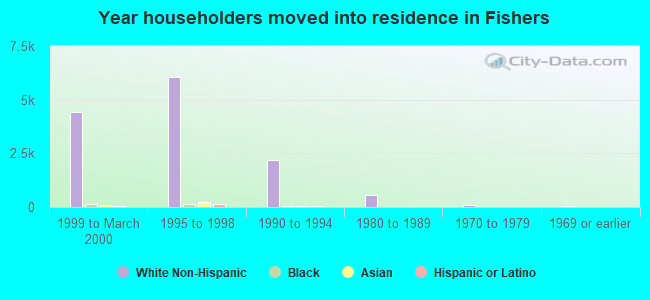
House/condo owner moved in on average 8 years ago
Renter moved in on average 2 years ago
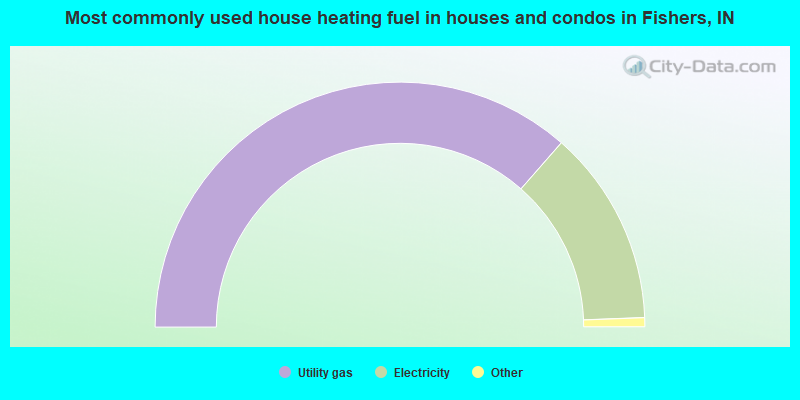
- 72.9%Utility gas
- 25.9%Electricity
- 0.8%Bottled, tank, or LP gas
- 0.5%Other fuel
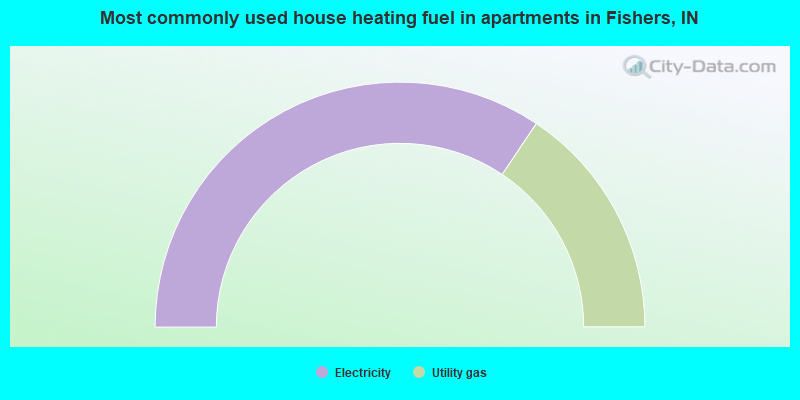
- 68.8%Electricity
- 31.2%Utility gas
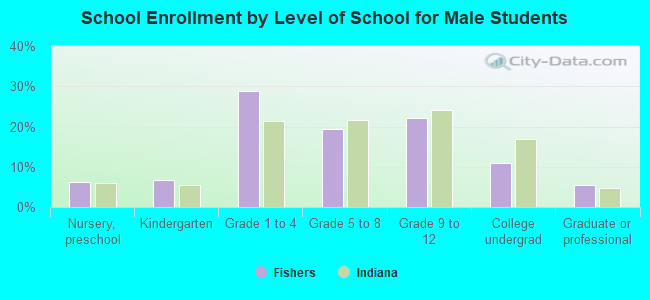
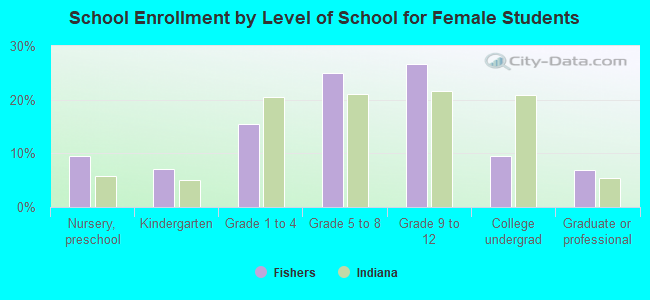
Private vs. public school enrollment:
| Here: | 32.4% |
| Indiana: | 14.9% |
| Here: | 11.7% |
| Indiana: | 11.4% |
| Here: | 4.4% |
| Indiana: | 22.3% |