Fort Lee, VA (Virginia) Houses and Residents
Estimated median house or condo value in 2022: $-741,793,132 (it was $60,000 in 2000 )
Fort Lee : Virginia :
Lower value quartile - upper value quartile: $-745,296,007 - $-717,069,596Total population: 3,393 (All urban)
Houses: 1,656 (1,544 occupied: 30 owner occupied, 1,515 renter occupied )
% of renters here:
98%State:
33%
Housing density: 198 houses/condos per square mile
Median price asked for vacant for-sale houses and condos in 2022 in this county: $232,288.
Median contract rent in 2022: $1,843 (lower quartile is $1,628, upper quartile is over $2,000)
Median rent asked for vacant for-rent units in 2022: $1,677
Median gross rent in Fort Lee, VA in 2022: $1,809
Housing units in Fort Lee with a mortgage: 30 (28 second mortgage, 0 home equity loan, 26 both second mortgage and home equity loan )Houses without a mortgage: 0
Data:
Median house or condo value ($)
Median house or condo value ($ change since 2000)
Median house or condo value ($) - White
Median house or condo value ($) - Black or African American
Median house or condo value ($) - Asian
Median house or condo value ($) - Hispanic or Latino
Median house or condo value ($) - American Indian and Alaska Native
Median house or condo value ($) - Multirace
Median house or condo value ($) - Other Race
Median price asked for mobile homes ($)
Household density (households per square mile)
Mean house or condo value by units in structure - 1, detached ($)
Mean house or condo value by units in structure - 1, attached ($)
Mean house or condo value by units in structure - 2 ($)
Mean house or condo value by units in structure by units in structure - 3 or 4 ($)
Mean house or condo value by units in structure - 5 or more ($)
Mean house or condo value by units in structure - Boat, RV, van, etc. ($)
Mean house or condo value by units in structure - Mobile home ($)
Median contract rent ($)
Median contract rent - Lower quartile ($)
Median contract rent - Upper quartile ($)
Median gross rent ($)
Urban houses (%)
Rural houses (%)
Houses occupied (%)
Houses occupied (% change since 2000)
Houses owner occupied (%)
Houses owner occupied (% change since 2000)
Houses renter occupied (%)
Houses renter occupied (% change since 2000)
Vacant housing units - For rent (%)
Vacant housing units - For rent (% change since 2000)
Vacant housing units - For sale only (%)
Vacant housing units - For sale only (% change since 2000)
Vacant housing units - Rented or sold, not occupied (%)
Vacant housing units - Rented or sold, not occupied (% change since 2000)
Vacant housing units - For seasonal, recreational, or occasional use (%)
Vacant housing units - For seasonal, recreational, or occasional use (% change since 2000)
Vacant housing units - For migrant workers (%)
Vacant housing units - For migrant workers (% change since 2000)
Vacant housing units - Other vacant (%)
Vacant housing units - Other vacant (% change since 2000)
Median monthly housing costs ($)
Median household income for houses/condos with a mortgage ($)
Median household income for houses/condos without a mortgage ($)
Median household income ($)
Median household income ($) - White
Median household income ($) - Black or African American
Median household income ($) - Asian
Median household income ($) - Hispanic or Latino
Median household income ($) - American Indian and Alaska Native
Median household income ($) - Multirace
Median household income ($) - Other Race
Mortgage status - with mortgage (%)
Mortgage status - with second mortgage (%)
Mortgage status - with home equity loan (%)
Mortgage status - with both second mortgage and home equity loan (%)
Mortgage status - without a mortgage (%)
Median year house/condo built
Median year apartment built
Household type by relationship - Male householder living alone (%)
Household type by relationship - Male householder not living alone (%)
Household type by relationship - Female householder living alone (%)
Household type by relationship - Female householder not living alone (%)
Household type by relationship - Opposite-Sex spouse (%)
Household type by relationship - Same-Sex spouse (%)
Household type by relationship - Opposite-Sex unmarried partner (%)
Household type by relationship - Same-Sex unmarried partner (%)
Household type by relationship - In group quarters (%)
Size of family households - 2-person household (%)
Size of family households - 3-person household (%)
Size of family households - 4-person household (%)
Size of family households - 5-person household (%)
Size of family households - 6-person household (%)
Size of family households - 7-or-more-person household (%)
Size of nonfamily households - 1-person household (%)
Size of nonfamily households - 2-person household (%)
Size of nonfamily households - 3-person household (%)
Size of nonfamily households - 4-person household (%)
Size of nonfamily households - 5-person household (%)
Size of nonfamily households - 6-person household (%)
Size of nonfamily households - 7-or-moreperson household (%)
Year house built - Built 2010 or later (%)
Year house built - Built 2000 to 2009 (%)
Year house built - Built 1990 to 1999 (%)
Year house built - Built 1980 to 1989 (%)
Year house built - Built 1970 to 1979 (%)
Year house built - Built 1960 to 1969 (%)
Year house built - Built 1950 to 1959 (%)
Year house built - Built 1940 to 1949 (%)
Year house built - Built 1939 or earlier (%)
Median number of rooms in houses and condos
Median number of rooms in apartments
Median number of bedrooms in owner occupied houses
Mean number of bedrooms in owner occupied houses
Median number of bedrooms in renter occupied houses
Mean number of bedrooms in renter occupied houses
Median number of vehichles in owner occupied houses
Mean number of vehichles in owner occupied houses
Median number of vehichles in renter occupied houses
Mean number of vehichles in renter occupied houses
Rooms in owner-occupied houses - 1 room (%)
Rooms in owner-occupied houses - 2 rooms (%)
Rooms in owner-occupied houses - 3 rooms (%)
Rooms in owner-occupied houses - 4 rooms (%)
Rooms in owner-occupied houses - 5 rooms (%)
Rooms in owner-occupied houses - 6 rooms (%)
Rooms in owner-occupied houses - 7 rooms (%)
Rooms in owner-occupied houses - 8 rooms (%)
Rooms in owner-occupied houses - 9+ rooms (%)
Rooms in renter-occupied houses - 1 room (%)
Rooms in renter-occupied houses - 2 rooms (%)
Rooms in renter-occupied houses - 3 rooms (%)
Rooms in renter-occupied houses - 4 rooms (%)
Rooms in renter-occupied houses - 5 rooms (%)
Rooms in renter-occupied houses - 6 rooms (%)
Rooms in renter-occupied houses - 7 rooms (%)
Rooms in renter-occupied houses - 8 rooms (%)
Rooms in renter-occupied houses - 9+ rooms (%)
Bedrooms in owner-occupied houses - no bedrooms (%)
Bedrooms in owner-occupied houses - 1 bedroom (%)
Bedrooms in owner-occupied houses - 2 bedrooms (%)
Bedrooms in owner-occupied houses - 3 bedrooms (%)
Bedrooms in owner-occupied houses - 4 bedrooms (%)
Bedrooms in owner-occupied houses - 5+ bedrooms (%)
Bedrooms in renter-occupied houses - no bedrooms (%)
Bedrooms in renter-occupied houses - 1 bedroom (%)
Bedrooms in renter-occupied houses - 2 bedrooms (%)
Bedrooms in renter-occupied houses - 3 bedrooms (%)
Bedrooms in renter-occupied houses - 4 bedrooms (%)
Bedrooms in renter-occupied houses - 5+ bedrooms (%)
Vehicles available in owner-occupied houses - no vehicle available (%)
Vehicles available in owner-occupied houses - 1 vehicle available(%)
Vehicles available in owner-occupied houses - 2 Vehicles available (%)
Vehicles available in owner-occupied houses - 3 Vehicles available (%)
Vehicles available in owner-occupied houses - 4 Vehicles available (%)
Vehicles available in owner-occupied houses - 5+ Vehicles available (%)
Vehicles available in renter-occupied houses - no vehicle available (%)
Vehicles available in renter-occupied houses - 1 vehicle available (%)
Vehicles available in renter-occupied houses - 2 Vehicles available (%)
Vehicles available in renter-occupied houses - 3 Vehicles available (%)
Vehicles available in renter-occupied houses - 4 Vehicles available (%)
Vehicles available in renter-occupied houses - 5+ Vehicles available (%)
Housing units in structures - 1, detached (%)
Housing units in structures - 1, attached (%)
Housing units in structures - 2 (%)
Housing units in structures - 3 or 4 (%)
Housing units in structures - 5 to 9 (%)
Housing units in structures - 10 to 19 (%)
Housing units in structures - 20 to 49 (%)
Housing units in structures - 50 or more (%)
Housing units in structures - Mobile home (%)
Housing units in structures - Boat, RV, van, etc. (%)
Housing units in structures - Owners - 1, detached (%)
Housing units in structures - Owners - 1, attached (%)
Housing units in structures - Owners - 2 (%)
Housing units in structures - Owners - 3 or 4 (%)
Housing units in structures - Owners - 5 to 9 (%)
Housing units in structures - Owners - 10 to 19 (%)
Housing units in structures - Owners - 20 to 49 (%)
Housing units in structures - Owners - 50 or more (%)
Housing units in structures - Owners - Mobile home (%)
Housing units in structures - Owners - Boat, RV, van, etc. (%)
Housing units in structures - Renters - 1, detached (%)
Housing units in structures - Renters - 1, attached (%)
Housing units in structures - Renters - 2 (%)
Housing units in structures - Renters - 3 or 4 (%)
Housing units in structures - Renters - 5 to 9 (%)
Housing units in structures - Renters - 10 to 19 (%)
Housing units in structures - Renters - 20 to 49 (%)
Housing units in structures - Renters - 50 or more (%)
Housing units in structures - Renters - Mobile home (%)
Housing units in structures - Renters - Boat, RV, van, etc. (%)
House/condo owner moved in on average (years ago)
Renter moved in on average (years ago)
Year householder moved into unit - Moved in 1999 to March 2000 (%)
Year householder moved into unit - Moved in 1999 to March 2000 (%) - White
Year householder moved into unit - Moved in 1999 to March 2000 (%) - Black or African American
Year householder moved into unit - Moved in 1999 to March 2000 (%) - Asian
Year householder moved into unit - Moved in 1999 to March 2000 (%) - Hispanic or Latino
Year householder moved into unit - Moved in 1999 to March 2000 (%) - American Indian and Alaska Native
Year householder moved into unit - Moved in 1999 to March 2000 (%) - Multirace
Year householder moved into unit - Moved in 1999 to March 2000 (%) - Other Race
Year householder moved into unit - Moved in 1995 to 1998 (%)
Year householder moved into unit - Moved in 1995 to 1998 (%) - White
Year householder moved into unit - Moved in 1995 to 1998 (%) - Black or African American
Year householder moved into unit - Moved in 1995 to 1998 (%) - Asian
Year householder moved into unit - Moved in 1995 to 1998 (%) - Hispanic or Latino
Year householder moved into unit - Moved in 1995 to 1998 (%) - American Indian and Alaska Native
Year householder moved into unit - Moved in 1995 to 1998 (%) - Multirace
Year householder moved into unit - Moved in 1995 to 1998 (%) - Other Race
Year householder moved into unit - Moved in 1990 to 1994 (%)
Year householder moved into unit - Moved in 1990 to 1994 (%) - White
Year householder moved into unit - Moved in 1990 to 1994 (%) - Black or African American
Year householder moved into unit - Moved in 1990 to 1994 (%) - Asian
Year householder moved into unit - Moved in 1990 to 1994 (%) - Hispanic or Latino
Year householder moved into unit - Moved in 1990 to 1994 (%) - American Indian and Alaska Native
Year householder moved into unit - Moved in 1990 to 1994 (%) - Multirace
Year householder moved into unit - Moved in 1990 to 1994 (%) - Other Race
Year householder moved into unit - Moved in 1980 to 1989 (%)
Year householder moved into unit - Moved in 1980 to 1989 (%) - White
Year householder moved into unit - Moved in 1980 to 1989 (%) - Black or African American
Year householder moved into unit - Moved in 1980 to 1989 (%) - Asian
Year householder moved into unit - Moved in 1980 to 1989 (%) - Hispanic or Latino
Year householder moved into unit - Moved in 1980 to 1989 (%) - American Indian and Alaska Native
Year householder moved into unit - Moved in 1980 to 1989 (%) - Multirace
Year householder moved into unit - Moved in 1980 to 1989 (%) - Other Race
Year householder moved into unit - Moved in 1970 to 1979 (%)
Year householder moved into unit - Moved in 1970 to 1979 (%) - White
Year householder moved into unit - Moved in 1970 to 1979 (%) - Black or African American
Year householder moved into unit - Moved in 1970 to 1979 (%) - Asian
Year householder moved into unit - Moved in 1970 to 1979 (%) - Hispanic or Latino
Year householder moved into unit - Moved in 1970 to 1979 (%) - American Indian and Alaska Native
Year householder moved into unit - Moved in 1970 to 1979 (%) - Multirace
Year householder moved into unit - Moved in 1970 to 1979 (%) - Other Race
Year householder moved into unit - Moved in 1969 or earlier (%)
Year householder moved into unit - Moved in 1969 or earlier (%) - White
Year householder moved into unit - Moved in 1969 or earlier (%) - Black or African American
Year householder moved into unit - Moved in 1969 or earlier (%) - Asian
Year householder moved into unit - Moved in 1969 or earlier (%) - Hispanic or Latino
Year householder moved into unit - Moved in 1969 or earlier (%) - American Indian and Alaska Native
Year householder moved into unit - Moved in 1969 or earlier (%) - Multirace
Year householder moved into unit - Moved in 1969 or earlier (%) - Other Race
Housing units lacking complete plumbing facilities (%)
Housing units lacking complete kitchen facilities (%)
House heating fuel used in houses and condos - Utility gas (%)
House heating fuel used in houses and condos - Bottled, tank, or LP gas (%)
House heating fuel used in houses and condos - Electricity (%)
House heating fuel used in houses and condos - Fuel oil, kerosene, etc. (%)
House heating fuel used in houses and condos - Coal or coke (%)
House heating fuel used in houses and condos - Wood (%)
House heating fuel used in houses and condos - Solar energy (%)
House heating fuel used in houses and condos - Other fuel (%)
House heating fuel used in houses and condos - No fuel used (%)
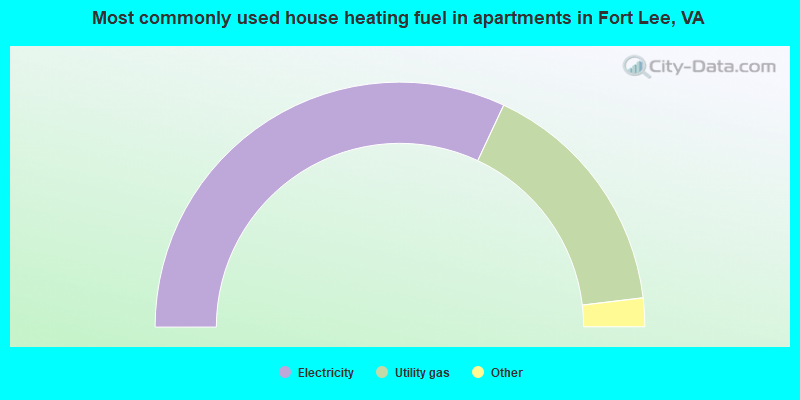
House heating fuel used in apartments - Utility gas (%)
House heating fuel used in apartments - Bottled, tank, or LP gas (%)
House heating fuel used in apartments - Electricity (%)
House heating fuel used in apartments - Fuel oil, kerosene, etc. (%)
House heating fuel used in apartments - Coal or coke (%)
House heating fuel used in apartments - Wood (%)
House heating fuel used in apartments - Solar energy (%)
House heating fuel used in apartments - Other fuel (%)
House heating fuel used in apartments - No fuel used (%)
Median year apartment built: 2008Household type by relationship:
Households: 7,596
Male householders: 1,075 (14 living alone ), Female householders: 437 (25 living alone )1,071 spouses (1,071 opposite-sex spouses ), 325 unmarried partners , (325 opposite-sex unmarried partners ), 2,536 children (2,156 natural , 72 adopted , 307 stepchildren ), 0 grandchildren , 17 brothers or sisters , 103 parents , 0 foster children , 19 other relatives , 10 non-relatives In group quarters: 2,000
Size of family households: 221 2-persons , 384 3-persons , 519 4-persons , 180 5-persons , 173 6-persons , 40 7-or-more-persons .
Size of nonfamily households: 40 1-person .
1,873 married couples with children. single-parent households (18 men , 256 women ).
72.8% of residents of Fort Lee speak English at home. of residents speak Spanish at home (81% speak English very well , 17% speak English well , 2% speak English not well ).of residents speak other Indo-European language at home (94% speak English very well , 6% speak English well ).of residents speak Asian or Pacific Island language at home (86% speak English very well , 12% speak English well , 2% speak English not well ).of residents speak other language at home (77% speak English very well , 23% speak English well ).
Foreign born population: 738 (9.7%)of them are naturalized citizens )
Median number of rooms in houses and condos: Here:
-666666666.0State:
7.0
Median number of rooms in apartments
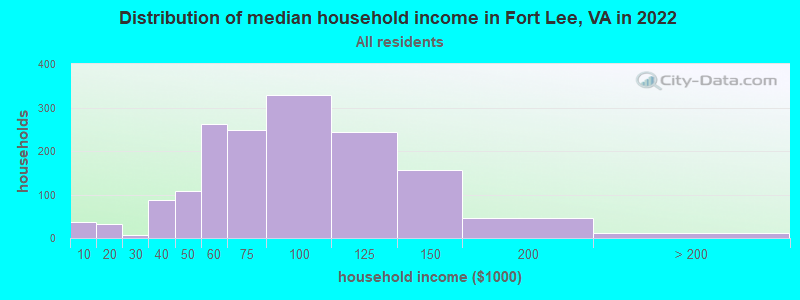
Fort Lee, VA household income distribution 37 Less than $10,00033 $10,000 to $19,9997 $20,000 to $29,99987 $30,000 to $39,999108 $40,000 to $49,999261 $50,000 to $59,999248 $60,000 to $74,999328 $75,000 to $99,999244 $100,000 to $124,999157 $125,000 to $149,99947 $150,000 to $199,99911 $200,000 or more
Rent paid by renters in 2022 in Fort Lee, VA 4 $800 to $8994 $1,000 to $1,24959 $1,250 to $1,4991,494 $1,500 to $1,999352 $2,000 to $2,49988 No cash rent
Percentage of workers working in this county: 90.7%Number of people working at home: 1,247 (30.3% of all workers )
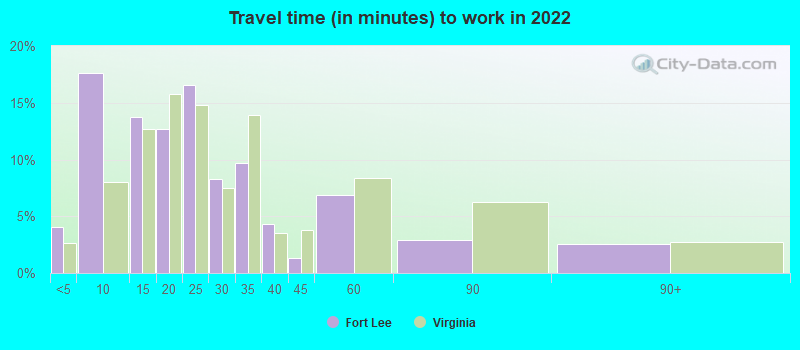
Travel time to work (commute)
Less than 5 minutes: 5055 to 9 minutes: 1,07110 to 14 minutes: 74115 to 19 minutes: 34820 to 24 minutes: 8325 to 29 minutes: 2730 to 34 minutes: 6835 to 39 minutes: 2740 to 44 minutes: 545 to 59 minutes: 3560 to 89 minutes: 4490 or more minutes: 0
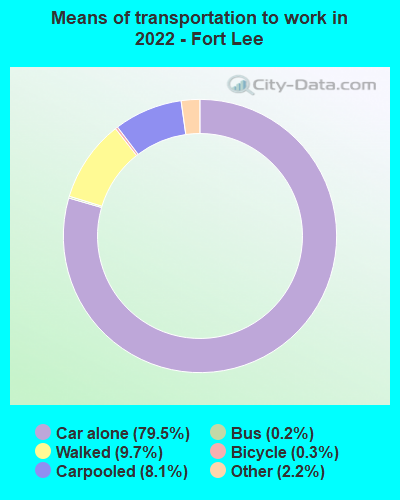
Means of transportation to work:
Drove a car alone: 7,813 (68.0%)Carpooled: 862 (7.5%)Bus : 13 (0.1%)Taxi: 385 (3.4%)Bicycle: 37 (0.3%)Walked: 1,317 (11.5%)Worked at home: 1,247 (10.9%)
Unemployment by race in 2022
Unemployment rate for White non-Hispanic residents 7.0% Males11.0% FemalesUnemployment rate for Black residents 73.9% Males10.7% FemalesUnemployment rate for other race residents 21.9% Males12.4% FemalesUnemployment rate for Hispanic or Latino residents 16.8% Males3.5% Females
Year of entry for the foreign-born population in Fort Lee, Virginia
396 2010 or later 210 2000 to 2009 175 1990 to 1999 143 1980 to 1989 147 1970 to 1979 23 Before 1970
First ancestries reported:
German: 170 (4.4%)
Sierra Leonean: 128 (3.3%)
Irish: 103 (2.7%)
European: 100 (2.6%)
American: 75 (1.9%)
African: 66 (1.7%)
Haitian: 55 (1.4%)
Czech: 41 (1.1%)
Italian: 41 (1.1%)
Scottish: 40 (1.0%)
Trinidadian and Tobagonian: 30 (0.8%)
French: 24 (0.6%)
Brazilian: 21 (0.5%)
English: 20 (0.5%)
Iranian: 20 (0.5%)
Nigerian: 12 (0.3%)
U.S. Virgin Islander: 11 (0.3%)
Norwegian: 9 (0.2%)
British West Indian: 8 (0.2%)
Jamaican: 8 (0.2%)
Iraqi: 4 (0.1%)
Northern European: 3 (0.08%)
Russian: 2 (0.05%)
Kenyan: 2 (0.05%)
Yugoslavian: 2 (0.05%)
Scandinavian: 1 (0.03%) Most common places of birth for foreign-born residents (%): Cameroon Fort Lee:
12.4% (95)Virginia:
0.2% (2,575)
Haiti Fort Lee:
12.1% (93)Virginia:
0.4% (4,246)
Mexico Fort Lee:
10.4% (80)Virginia:
5.3% (57,498)
Sierra Leone Fort Lee:
9.6% (74)Virginia:
0.6% (6,458)
Germany Fort Lee:
8.7% (67)Virginia:
1.7% (18,227)
Nigeria Fort Lee:
7.7% (59)Virginia:
0.6% (6,956)
Philippines Fort Lee:
6.4% (49)Virginia:
4.8% (52,629)
Africa, n.e.c. Fort Lee:
4.4% (34)Virginia:
0.3% (3,275)
Venezuela Fort Lee:
4.2% (32)Virginia:
0.8% (8,186)
Yemen Fort Lee:
4.0% (31)Virginia:
0.1% (1,124)
Korea Fort Lee:
3.3% (25)Virginia:
4.9% (52,857)
Nicaragua Fort Lee:
3.3% (25)Virginia:
0.6% (6,916)
Thailand Fort Lee:
3.0% (23)Virginia:
0.7% (7,672)
Oceania, n.e.c. Fort Lee:
2.2% (17)Virginia:
0.0% (309)
Brazil Fort Lee:
2.1% (16)Virginia:
0.7% (8,081)
Trinidad and Tobago Fort Lee:
1.7% (13)Virginia:
0.4% (4,211)
Place of birth for U.S.-born residents:
This state: 556Other state: 6,029Northeast: 1,027Midwest: 703South: 3,137West: 1,354 48.9% of Fort Lee residents lived in the same house 1 years ago.
Out of people who lived in different houses, 1.5% lived in this county.
Out of people who lived in different counties, 7.3% lived in Virginia.
Fort Lee:
48.9%State average:
86.6%
Education attainment for males 25 years and older:
No schooling: 13Nursery to 4th grade: 05th and 6th grade: 07th and 8th grade: 09th grade: 110th grade: 011th grade: 012th grade, no diploma: 0High school graduate (or equivalency): 138Less than 1 year of college: 194Some college more than 1 year, no degree: 391Associate degree: 361Bachelor's degree: 447Master's degree: 39Professional school degree: 12Doctorate degree: 0
Education attainment for females 25 years and older:
No schooling: 62Nursery to 4th grade: 05th and 6th grade: 07th and 8th grade: 09th grade: 110th grade: 011th grade: 5112th grade, no diploma: 0High school graduate (or equivalency): 234Less than 1 year of college: 119Some college more than 1 year, no degree: 221Associate degree: 203Bachelor's degree: 351Master's degree: 102Professional school degree: 0Doctorate degree: 37
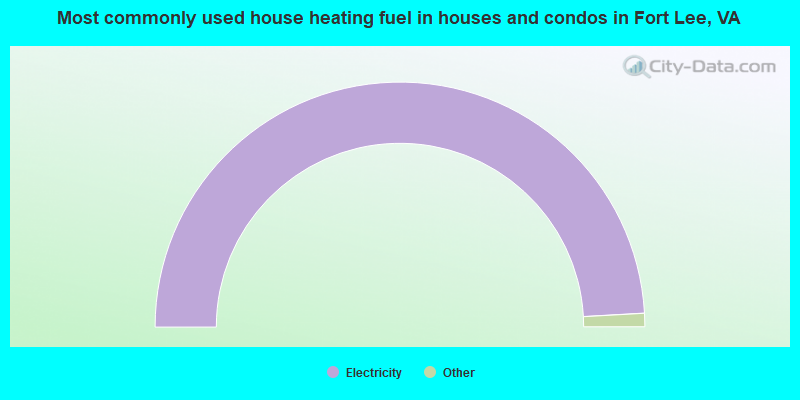
Housing units in structures:
One, detached: 241One, attached: 1,302Two: 111
Houses and condos Apartments
64.0% Electricity 32.3% Utility gas 2.5% No fuel used 0.9% Bottled, tank, or LP gas 0.3% Fuel oil, kerosene, etc.
Private vs. public school enrollment:
Students in private schools in grades 1 to 8 (elementary and middle school): 71 Students in private schools in grades 9 to 12 (high school): 21 Students in private undergraduate colleges: 31