Fort Worth, TX (Texas) Houses and Residents
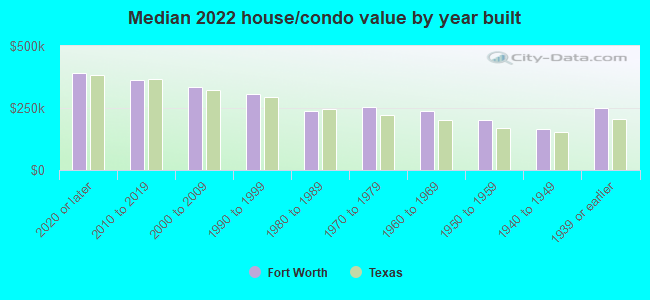
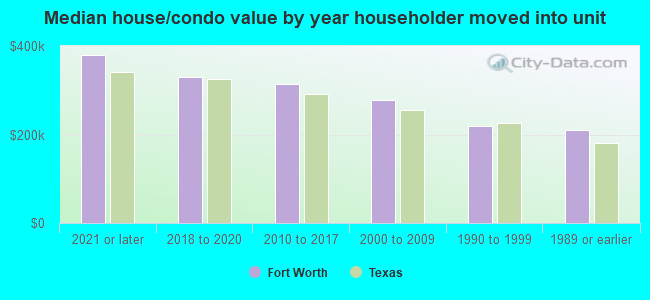
| Fort Worth: | $293,600 |
| Texas: | $275,400 |
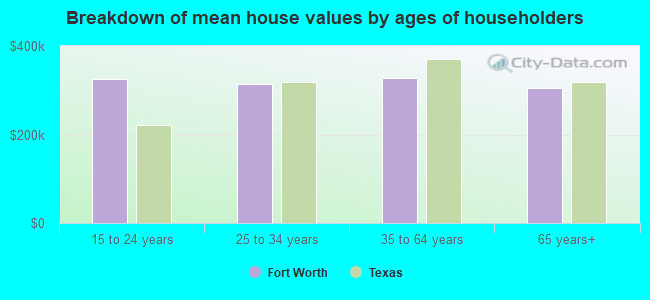
Mean price in 2022:
Detached houses: $327,155
Here: $327,155 State: $369,058 Townhouses or other attached units: $324,077
Here: $324,077 State: $327,631 In 2-unit structures: $1,011,033
Here: $1,011,033 State: $374,947 In 3-to-4-unit structures: $89,595
Here: $89,595 State: $209,652 In 5-or-more-unit structures: $304,470
Here: $304,470 State: $413,944 Mobile homes: $86,180
Here: $86,180 State: $124,413 Occupied boats, RVs, vans, etc.: $9,533
Here: $9,533 State: $73,921
Total population: 812,238 (Urban population: 529,951, Rural population: 5,469 (73 farm, 5,396 nonfarm))
Houses: 373,502 (345,018 occupied: 206,215 owner occupied, 138,803 renter occupied)
| % of renters here: | 40% |
| State: | 38% |
Housing density: 1,277 houses/condos per square mile
Median price asked for vacant for-sale houses and condos in 2022: $254,277.
Median contract rent in 2022: $1,182 (lower quartile is $899, upper quartile is $1,598)
Median rent asked for vacant for-rent units in 2022: $1,522
Median gross rent in Fort Worth, TX in 2022: $1,339
Housing units in Fort Worth with a mortgage: 126,101 (5,136 second mortgage, 293 home equity loan, 4,011 both second mortgage and home equity loan)
Houses without a mortgage: 2,077
Median household income for houses/condos with a mortgage: $111,752
Median household income for apartments without a mortgage: $67,370
Median monthly housing costs: $1,409
Compare current foreclosures in Fort Worth, TX:
| Photo | Address | Area | Beds / Baths | Price | Details |
|---|---|---|---|---|---|

|
#1
Villa Milano Dr
Fort Worth, TX 76126
|
- sq. feet
|
4 baths 4 beds |
$999,900
|
show details |

|
#2
E California Pkwy
Fort Worth, TX 76119
|
2,536 sq. feet
|
3 baths 4 beds |
show details | |

|
#3
Doverglen Dr
Fort Worth, TX 76131
|
- sq. feet
|
2 baths 5 beds |
show details | |

|
#4
Big Horn Way
Fort Worth, TX 76137
|
3,237 sq. feet
|
3 baths 5 beds |
show details | |

|
#5
W 7th St Apt 2512
Fort Worth, TX 76107
|
1,263 sq. feet
|
2 baths 1 beds |
show details | |

|
#6
Norris Valley Dr
Fort Worth, TX 76135
|
1,032 sq. feet
|
2 baths 3 beds |
show details | |

|
#7
Montclair Dr
Fort Worth, TX 76103
|
1,428 sq. feet
|
3 baths 4 beds |
show details | |

|
#8
Plainfield Dr
Fort Worth, TX 76108
|
1,071 sq. feet
|
2 baths 3 beds |
show details | |

|
#9
Chambers Creek Dr
Fort Worth, TX 76140
|
1,833 sq. feet
|
2 baths 3 beds |
show details | |

|
#10
N Park Dr
Fort Worth, TX 76148
|
1,513 sq. feet
|
2 baths 3 beds |
show details |
| Photo | Address | Area | Beds / Baths | Price | Details |
|---|---|---|---|---|---|

|
#11
Shallow Creek Dr
Fort Worth, TX 76179
|
1,736 sq. feet
|
2 baths 3 beds |
show details | |

|
#12
Apalachee Trl
Fort Worth, TX 76179
|
2,564 sq. feet
|
2 baths 3 beds |
show details | |

|
#13
Sweet Flag Lane
Fort Worth, TX 76123
|
2,816 sq. feet
|
2 baths 4 beds |
show details | |

|
#14
Gill St
Fort Worth, TX 76131
|
1,120 sq. feet
|
1 baths 3 beds |
show details | |

|
#15
Milam St
Fort Worth, TX 76112
|
1,193 sq. feet
|
2 baths 3 beds |
show details | |

|
#16
Saddle Trl
Fort Worth, TX 76116
|
1,797 sq. feet
|
2 baths 3 beds |
show details | |

|
#17
Condor Trl
Fort Worth, TX 76131
|
2,560 sq. feet
|
2 baths 3 beds |
show details | |

|
#18
Lilac St
Fort Worth, TX 76110
|
2,000 sq. feet
|
3 baths 3 beds |
show details | |

|
#19
Darla Dr
Fort Worth, TX 76132
|
1,192 sq. feet
|
2 baths 3 beds |
show details | |

|
#20
New Harbor Ln
Fort Worth, TX 76179
|
1,264 sq. feet
|
2 baths 3 beds |
show details |
| Photo | Address | Area | Beds / Baths | Price | Details |
|---|---|---|---|---|---|

|
#21
Roky Ct
Fort Worth, TX 76114
|
2,322 sq. feet
|
4 baths 4 beds |
show details | |

|
#22
Thornberry Dr
Fort Worth, TX 76137
|
3,369 sq. feet
|
3 baths 4 beds |
show details | |

|
#23
Dillon Cir
Fort Worth, TX 76137
|
3,485 sq. feet
|
2 baths 4 beds |
show details | |

|
#24
Lowe St
Fort Worth, TX 76110
|
1,348 sq. feet
|
2 baths 3 beds |
show details | |

|
#25
Saldana Dr
Fort Worth, TX 76133
|
1,853 sq. feet
|
2 baths 3 beds |
show details | |

|
#26
Goldstone Ln
Fort Worth, TX 76131
|
2,717 sq. feet
|
3 baths 6 beds |
show details | |

|
#27
Oakmont Ln N
Fort Worth, TX 76112
|
3,461 sq. feet
|
2 baths 4 beds |
show details | |

|
#28
Delaware Trl
Fort Worth, TX 76135
|
1,177 sq. feet
|
2 baths 3 beds |
show details | |

|
#29
Nighthawk Rd
Fort Worth, TX 76108
|
2,686 sq. feet
|
2 baths 4 beds |
show details | |

|
#30
Nottingham Blvd
Fort Worth, TX 76112
|
1,658 sq. feet
|
2 baths 3 beds |
show details |
| Photo | Address | Area | Beds / Baths | Price | Details |
|---|---|---|---|---|---|

|
#31
Edgefield Rd
Fort Worth, TX 76107
|
2,660 sq. feet
|
3 baths 4 beds |
show details | |

|
#32
Smilax Ave
Fort Worth, TX 76111
|
1,230 sq. feet
|
1 baths 3 beds |
show details | |

|
#33
Chippewa Trl
Fort Worth, TX 76135
|
1,176 sq. feet
|
1 baths 2 beds |
show details | |

|
#34
Stone Lake Dr
Fort Worth, TX 76179
|
1,370 sq. feet
|
2 baths 3 beds |
show details | |

|
#35
Bridal Trl
Fort Worth, TX 76179
|
2,600 sq. feet
|
2 baths 4 beds |
show details | |

|
#36
Haywood Dr
Fort Worth, TX 76126
|
1,911 sq. feet
|
2 baths 4 beds |
show details | |

|
#37
Springdale Ct
Fort Worth, TX 76148
|
2,002 sq. feet
|
2 baths 3 beds |
show details | |

|
#38
Flagstaff Run
Fort Worth, TX 76140
|
1,518 sq. feet
|
2 baths 3 beds |
show details | |

|
#39
Perdido Dr
Fort Worth, TX 76148
|
- sq. feet
|
2 baths 3 beds |
show details | |

|
#40
Mayberry Ln
Fort Worth, TX 76123
|
3,468 sq. feet
|
3 baths 5 beds |
show details |
| Photo | Address | Area | Beds / Baths | Price | Details |
|---|---|---|---|---|---|

|
#41
Madeira Dr
Fort Worth, TX 76112
|
1,423 sq. feet
|
2 baths 3 beds |
show details | |

|
#42
Buck Mountain Pass
Fort Worth, TX 76179
|
1,316 sq. feet
|
2 baths 3 beds |
show details | |

|
#43
E 4th St
Fort Worth, TX 76111
|
1,216 sq. feet
|
1 baths 3 beds |
show details | |

|
#44
Ozark Dr
Fort Worth, TX 76131
|
2,253 sq. feet
|
2 baths 3 beds |
show details | |

|
#45
Westgrove Dr
Fort Worth, TX 76179
|
1,650 sq. feet
|
2 baths 3 beds |
show details | |

|
#46
Portales Dr
Fort Worth, TX 76116
|
1,501 sq. feet
|
2 baths 3 beds |
show details | |

|
#47
Elmdale Dr
Fort Worth, TX 76137
|
2,815 sq. feet
|
2 baths 3 beds |
show details | |

|
#48
Winn Dr
Fort Worth, TX 76134
|
1,505 sq. feet
|
2 baths 3 beds |
show details | |

|
#49
Cherrytree Ln
Fort Worth, TX 76140
|
1,764 sq. feet
|
2 baths 3 beds |
show details | |

|
Check over 1 million property listings on Foreclosure.com!
|
browse all offers | |||


Median year apartment built: 1995
Household type by relationship:
Households: 961,160- Male householders: 173,487 (44,058 living alone), Female householders: 171,531 (50,311 living alone)
165,349 spouses (164,000 opposite-sex spouses), 24,753 unmarried partners, (22,576 opposite-sex unmarried partners), 309,793 children (290,417 natural, 4,152 adopted, 15,224 stepchildren), 26,770 grandchildren, 11,655 brothers or sisters, 14,187 parents, 1,202 foster children, 16,724 other relatives, 27,241 non-relatives
- In group quarters: 18,468
Size of family households: 85,274 2-persons, 48,818 3-persons, 49,916 4-persons, 26,858 5-persons, 11,248 6-persons, 5,647 7-or-more-persons.
Size of nonfamily households: 94,369 1-person, 18,876 2-persons, 2,470 3-persons, 805 4-persons, 247 5-persons, 490 7-or-more-persons.
160,671 married couples with children.
61,594 single-parent households (15,647 men, 45,947 women).
67.2% of residents of Fort Worth speak English at home.
25.0% of residents speak Spanish at home (63% speak English very well, 16% speak English well, 15% speak English not well, 7% don't speak English at all).
3.2% of residents speak other Indo-European language at home (65% speak English very well, 25% speak English well, 8% speak English not well, 2% don't speak English at all).
2.9% of residents speak Asian or Pacific Island language at home (53% speak English very well, 30% speak English well, 13% speak English not well, 5% don't speak English at all).
1.8% of residents speak other language at home (72% speak English very well, 17% speak English well, 11% speak English not well).
Foreign born population: 159,983 (16.6%)
(38.0% of them are naturalized citizens)
| Here: | 6.3 |
| State: | 6.3 |
| Here: | 4.1 |
| State: | 4.0 |
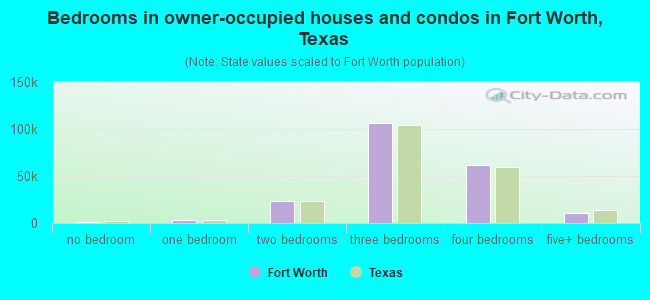
- Bedrooms in owner-occupied houses and condos in Fort Worth, Texas
- 1,456no bedroom
- 2,7641 bedroom
- 23,1592 bedrooms
- 106,8953 bedrooms
- 61,3264 bedrooms
- 10,6155+ bedrooms
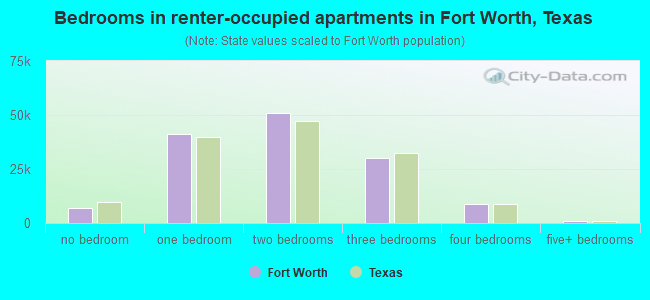
- Bedrooms in renter-occupied apartments in Fort Worth, Texas
- 6,786no bedroom
- 41,1371 bedroom
- 51,0822 bedrooms
- 30,0403 bedrooms
- 8,9794 bedrooms
- 7795+ bedrooms
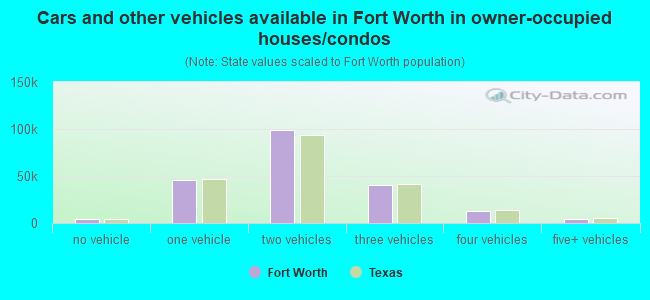
- Cars and other vehicles available in Fort Worth in owner-occupied houses/condos
- 3,960no vehicle
- 46,2031 vehicle
- 99,4112 vehicles
- 40,0243 vehicles
- 12,3134 vehicles
- 4,3045+ vehicles
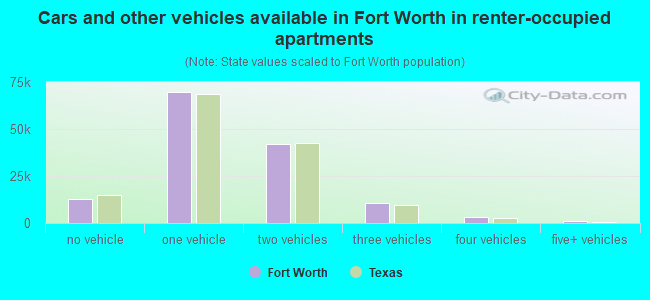
- Cars and other vehicles available in Fort Worth in renter-occupied apartments
- 12,614no vehicle
- 69,7431 vehicle
- 42,2632 vehicles
- 10,3733 vehicles
- 2,9344 vehicles
- 8765+ vehicles
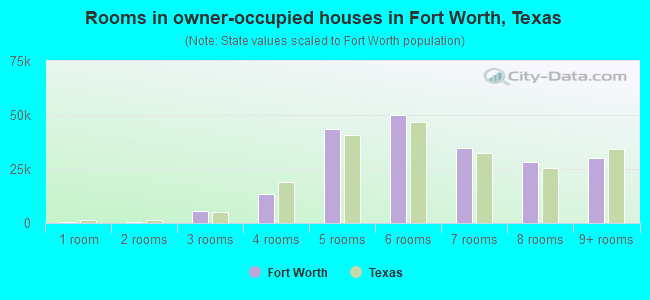
- Rooms in owner-occupied houses in Fort Worth, Texas
- 3881 room
- 5992 rooms
- 5,3703 rooms
- 13,3064 rooms
- 43,5965 rooms
- 49,8676 rooms
- 34,8707 rooms
- 28,3538 rooms
- 29,8669+ rooms
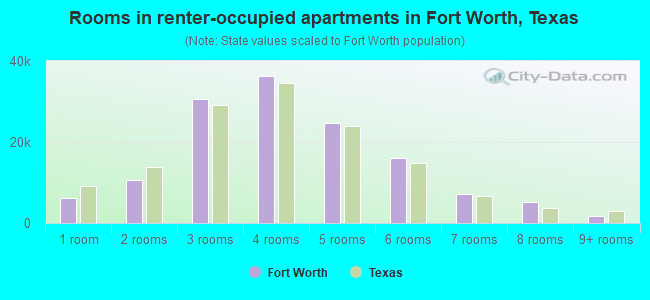
- Rooms in renter-occupied apartments in Fort Worth, Texas
- 6,2191 room
- 10,5142 rooms
- 30,7063 rooms
- 36,2544 rooms
- 24,7715 rooms
- 16,1006 rooms
- 7,2327 rooms
- 5,2238 rooms
- 1,7849+ rooms
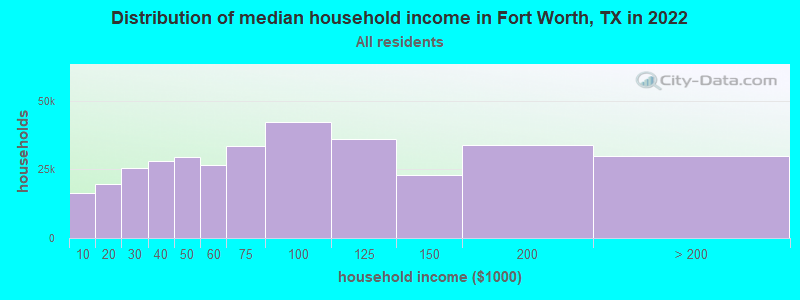
Fort Worth, TX household income distribution

- 16,478Less than $10,000
- 19,776$10,000 to $19,999
- 25,469$20,000 to $29,999
- 28,213$30,000 to $39,999
- 29,607$40,000 to $49,999
- 26,581$50,000 to $59,999
- 33,515$60,000 to $74,999
- 42,318$75,000 to $99,999
- 36,197$100,000 to $124,999
- 22,830$125,000 to $149,999
- 34,054$150,000 to $199,999
- 29,980$200,000 or more
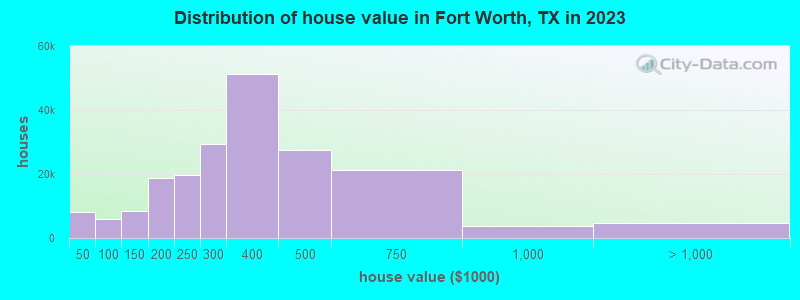
Home value of owner - occupied houses in 2022 in Fort Worth, TX
-
- 2,110Less than $10,000
- 577$10,000 to $14,999
- 904$15,000 to $19,999
- 892$20,000 to $24,999
- 1,016$25,000 to $29,999
- 483$30,000 to $34,999
- 572$35,000 to $39,999
- 1,082$40,000 to $49,999
- 979$50,000 to $59,999
- 1,280$60,000 to $69,999
- 1,220$70,000 to $79,999
- 2,630$80,000 to $89,999
- 2,848$90,000 to $99,999
- 7,541$100,000 to $124,999
- 5,310$125,000 to $149,999
- 8,823$150,000 to $174,999
- 9,654$175,000 to $199,999
- 26,770$200,000 to $249,999
- 32,557$250,000 to $299,999
- 51,319$300,000 to $399,999
- 25,703$400,000 to $499,999
- 13,568$500,000 to $749,999
- 4,690$750,000 to $999,999
- 1,796$1,000,000 to $1,499,999
- 583$1,500,000 to $1,999,999
- 1,308$2,000,000 or more
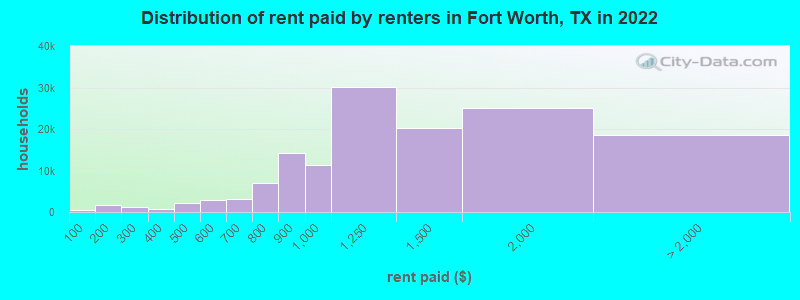
Rent paid by renters in 2022 in Fort Worth, TX
-
- 417Less than $100
- 483$100 to $149
- 1,088$150 to $199
- 337$200 to $249
- 948$250 to $299
- 386$300 to $349
- 291$350 to $399
- 1,235$400 to $449
- 864$450 to $499
- 1,810$500 to $549
- 1,021$550 to $599
- 1,982$600 to $649
- 1,259$650 to $699
- 2,915$700 to $749
- 4,138$750 to $799
- 14,319$800 to $899
- 11,227$900 to $999
- 30,187$1,000 to $1,249
- 20,306$1,250 to $1,499
- 25,148$1,500 to $1,999
- 10,801$2,000 to $2,499
- 1,360$2,500 to $2,999
- 467$3,000 to $3,499
- 501$3,500 or more
- 5,313No cash rent

Percentage of workers working in this county: 84.8%
Number of people working at home: 72,190 (15.3% of all workers)

Travel time to work (commute)
- Less than 5 minutes: 5,716
- 5 to 9 minutes: 22,449
- 10 to 14 minutes: 49,640
- 15 to 19 minutes: 61,406
- 20 to 24 minutes: 67,765
- 25 to 29 minutes: 29,181
- 30 to 34 minutes: 66,917
- 35 to 39 minutes: 13,434
- 40 to 44 minutes: 19,371
- 45 to 59 minutes: 38,804
- 60 to 89 minutes: 21,252
- 90 or more minutes: 5,248

Means of transportation to work:
- Drove a car alone: 400,103 (74.3%)
- Carpooled: 51,968 (9.6%)
- Bus: 1,544 (0.3%)
- Long-distance train or commuter rail: 440 (0.1%)
- Light rail, streetcar or trolley: 62 (0.0%)
- Ferryboat: 48 (0.0%)
- Taxi: 6,341 (1.2%)
- Bicycle: 522 (0.1%)
- Walked: 5,413 (1.0%)
- Worked at home: 72,190 (13.4%)
- Unemployment by race in 2022
- Unemployment rate for White non-Hispanic residents
- 3.2%Males
- 2.9%Females
- Unemployment rate for Black residents
- 6.8%Males
- 7.9%Females
- Unemployment rate for American Indian and Alaska Native residents
- 2.0%Males
- 0.9%Females
- Unemployment rate for Asian residents
- 1.9%Males
- 5.0%Females
- Unemployment rate for other race residents
- 1.0%Males
- 3.9%Females
- Unemployment rate for two or more race residents
- 4.1%Males
- 2.3%Females
- Unemployment rate for Hispanic or Latino residents
- 3.7%Males
- 3.5%Females
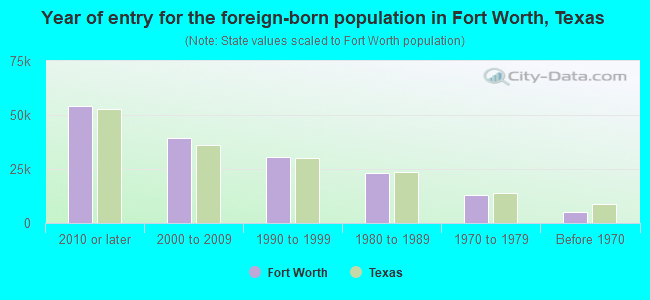
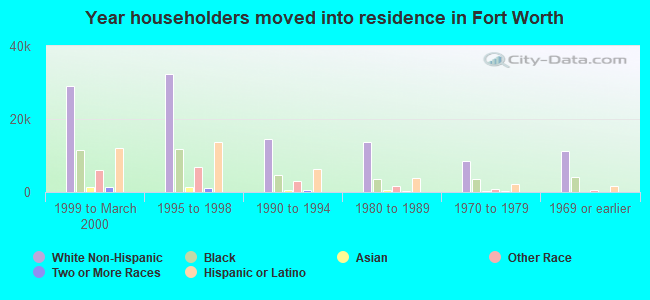
- Year of entry for the foreign-born population in Fort Worth, Texas
- 54,2032010 or later
- 39,5752000 to 2009
- 30,7621990 to 1999
- 23,1571980 to 1989
- 12,7381970 to 1979
- 5,240Before 1970
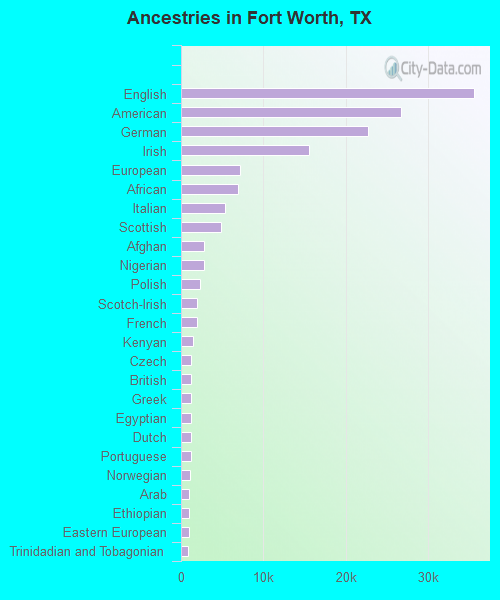
First ancestries reported:
- English: 35,620 (6.4%)
- American: 26,735 (4.8%)
- German: 22,687 (4.1%)
- Irish: 15,505 (2.8%)
- European: 7,137 (1.3%)
- African: 6,888 (1.2%)
- Italian: 5,364 (1.0%)
- Scottish: 4,806 (0.9%)
- Afghan: 2,838 (0.5%)
- Nigerian: 2,763 (0.5%)
- Polish: 2,329 (0.4%)
- Scotch-Irish: 1,963 (0.4%)
- French: 1,954 (0.4%)
- Kenyan: 1,473 (0.3%)
- Czech: 1,273 (0.2%)
- British: 1,252 (0.2%)
- Greek: 1,250 (0.2%)
- Egyptian: 1,234 (0.2%)
- Dutch: 1,210 (0.2%)
- Portuguese: 1,154 (0.2%)
- Norwegian: 1,077 (0.2%)
- Arab: 1,009 (0.2%)
- Ethiopian: 972 (0.2%)
- Eastern European: 927 (0.2%)
- Trinidadian and Tobagonian: 811 (0.1%)
- Jamaican: 804 (0.1%)
- French Canadian: 757 (0.1%)
- Swedish: 628 (0.1%)
- Russian: 540 (0.10%)
- Lebanese: 500 (0.09%)
- Brazilian: 500 (0.09%)
- Somali: 481 (0.09%)
- Sudanese: 474 (0.09%)
- Yugoslavian: 470 (0.08%)
- Ukrainian: 449 (0.08%)
- Welsh: 444 (0.08%)
- Turkish: 414 (0.07%)
- Canadian: 368 (0.07%)
- South African: 368 (0.07%)
- Iraqi: 363 (0.07%)
- Scandinavian: 349 (0.06%)
- Austrian: 328 (0.06%)
- Northern European: 296 (0.05%)
- Haitian: 251 (0.05%)
- Albanian: 250 (0.04%)
- Dutch West Indian: 238 (0.04%)
- Iranian: 237 (0.04%)
- Liberian: 234 (0.04%)
- Slavic: 224 (0.04%)
- British West Indian: 221 (0.04%)
- Swiss: 182 (0.03%)
- Danish: 164 (0.03%)
- West Indian: 157 (0.03%)
- Ghanaian: 141 (0.03%)
- Zimbabwean: 131 (0.02%)
- Hungarian: 126 (0.02%)
- Serbian: 118 (0.02%)
- Barbadian: 118 (0.02%)
- Bahamian: 104 (0.02%)
- Israeli: 102 (0.02%)
- Syrian: 102 (0.02%)
- Jordanian: 99 (0.02%)
- Czechoslovakian: 79 (0.01%)
- Latvian: 79 (0.01%)
- Armenian: 79 (0.01%)
- Belgian: 72 (0.01%)
- Lithuanian: 68 (0.01%)
- German Russian: 67 (0.01%)
- Moroccan: 59 (0.01%)
- Croatian: 58 (0.01%)
- Slovak: 57 (0.01%)
- Guyanese: 53 (0.01%)
- Pennsylvania German: 53 (0.01%)
- Bulgarian: 52 (0.01%)
- Icelander: 44 (0.01%)
- Romanian: 42 (0.01%)
- Cajun: 36 (0.01%)
- Palestinian: 35 (0.01%)
- Cypriot: 29 (0.01%)
- Finnish: 29 (0.01%)
- Ugandan: 29 (0.01%)
Most common places of birth for foreign-born residents (%):
| Fort Worth: | 51.0% (81,269) |
| Texas: | 48.4% (2,411,723) |
| Fort Worth: | 4.0% (6,323) |
| Texas: | 6.1% (306,347) |
| Fort Worth: | 2.9% (4,640) |
| Texas: | 3.7% (184,770) |
| Fort Worth: | 2.7% (4,337) |
| Texas: | 0.6% (27,480) |
| Fort Worth: | 2.7% (4,267) |
| Texas: | 3.0% (147,182) |
| Fort Worth: | 1.9% (3,102) |
| Texas: | 2.1% (103,148) |
| Fort Worth: | 1.8% (2,820) |
| Texas: | 1.2% (60,172) |
| Fort Worth: | 1.7% (2,674) |
| Texas: | 1.9% (96,110) |
| Fort Worth: | 1.6% (2,549) |
| Texas: | 0.3% (13,197) |
Place of birth for U.S.-born residents:
- This state: 528,450
- Other state: 252,237
- Northeast: 24,238
- Midwest: 65,321
- South: 84,588
- West: 78,090
85.8% of Fort Worth residents lived in the same house 1 years ago.
Out of people who lived in different houses, 38.1% lived in this county.
Out of people who lived in different counties, 60.3% lived in Texas.
| Fort Worth: | 85.8% |
| State average: | 85.7% |
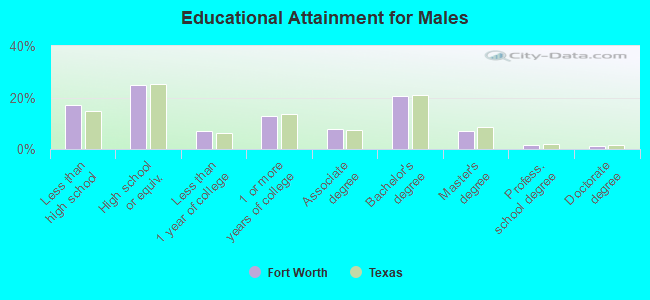
Education attainment for males 25 years and older:
- No schooling: 10,295
- Nursery to 4th grade: 2,284
- 5th and 6th grade: 6,126
- 7th and 8th grade: 5,842
- 9th grade: 8,528
- 10th grade: 4,927
- 11th grade: 4,862
- 12th grade, no diploma: 9,097
- High school graduate (or equivalency): 75,744
- Less than 1 year of college: 21,204
- Some college more than 1 year, no degree: 38,521
- Associate degree: 24,090
- Bachelor's degree: 62,892
- Master's degree: 21,393
- Professional school degree: 4,516
- Doctorate degree: 3,141
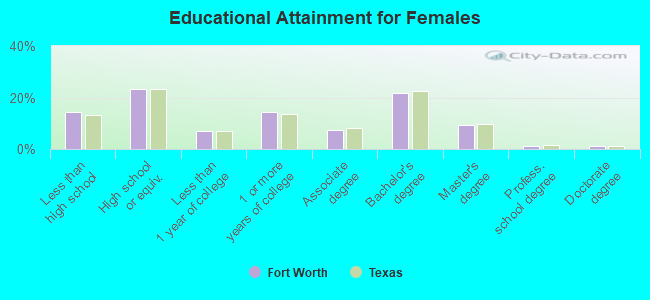
Education attainment for females 25 years and older:
- No schooling: 9,691
- Nursery to 4th grade: 2,397
- 5th and 6th grade: 6,366
- 7th and 8th grade: 4,849
- 9th grade: 5,030
- 10th grade: 4,952
- 11th grade: 5,638
- 12th grade, no diploma: 7,305
- High school graduate (or equivalency): 74,438
- Less than 1 year of college: 22,668
- Some college more than 1 year, no degree: 45,156
- Associate degree: 23,601
- Bachelor's degree: 68,518
- Master's degree: 29,149
- Professional school degree: 4,103
- Doctorate degree: 3,857
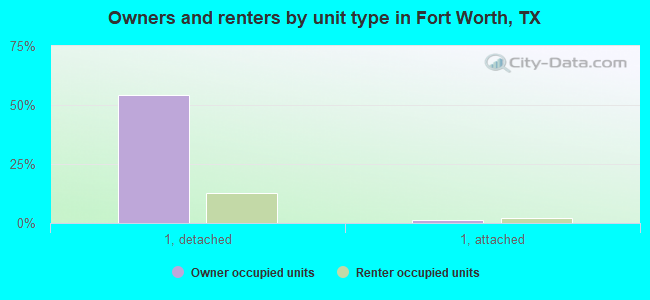
Housing units in structures:
- One, detached: 247,450
- One, attached: 10,043
- Two: 6,821
- 3 or 4: 12,505
- 5 to 9: 23,185
- 10 to 19: 25,770
- 20 to 49: 12,818
- 50 or more: 29,015
- Mobile homes: 5,395
- Boats, RVs, vans, etc.: 500
Median worth of mobile homes: $84,900
Housing units lacking complete kitchen facilities in 2022: 1.9%
House/condo owner moved in on average 9 years ago
Renter moved in on average 2 years ago
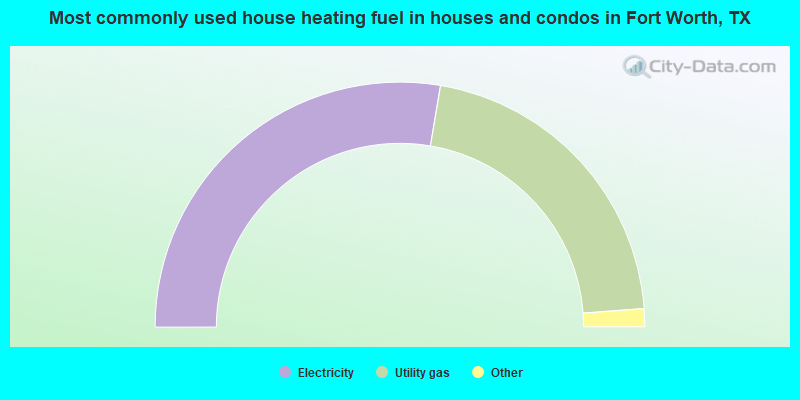
- 55.3%Electricity
- 42.3%Utility gas
- 1.5%Bottled, tank, or LP gas
- 0.6%Solar energy
- 0.2%No fuel used
- 0.1%Other fuel
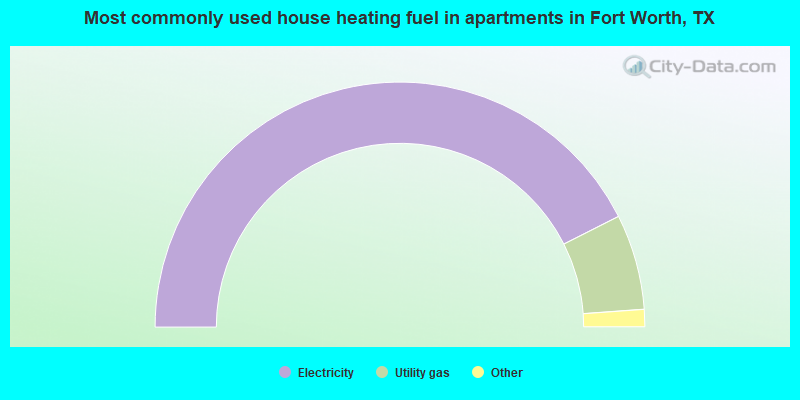
- 85.1%Electricity
- 12.6%Utility gas
- 0.7%No fuel used
- 0.7%Bottled, tank, or LP gas
- 0.3%Solar energy
- 0.2%Wood
- 0.2%Fuel oil, kerosene, etc.
- 0.2%Other fuel
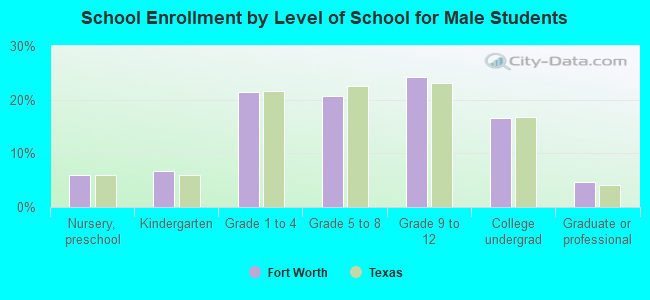
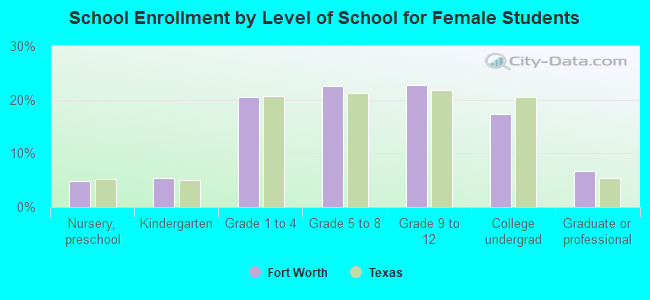
Private vs. public school enrollment:
| Here: | 7.0% |
| Texas: | 8.8% |
| Here: | 7.5% |
| Texas: | 8.0% |
| Here: | 20.8% |
| Texas: | 16.2% |