Franklin Park, IL (Illinois) Houses and Residents
Estimated median house or condo value in 2022: $252,655 (it was $144,400 in 2000 )
Franklin Park:
$252,655Illinois:
$251,600
Lower value quartile - upper value quartile: $215,011 - $293,586Mean price in 2022: Detached houses: $251,873 Here:
$251,873State:
$310,164
Townhouses or other attached units: $254,337 Here:
$254,337State:
$286,230
In 2-unit structures: $426,335 Here:
$426,335State:
$299,638
In 3-to-4-unit structures: $379,697 Here:
$379,697State:
$330,907
In 5-or-more-unit structures: $250,181 Here:
$250,181State:
$318,887
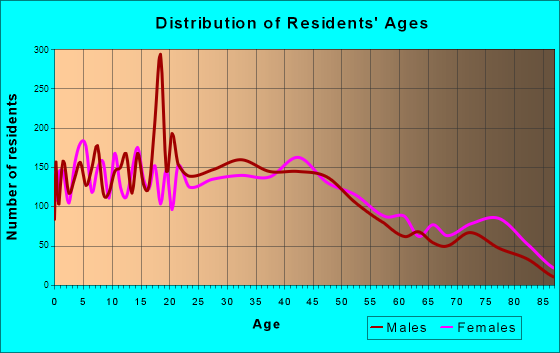
Total population: 18,404 (All urban)
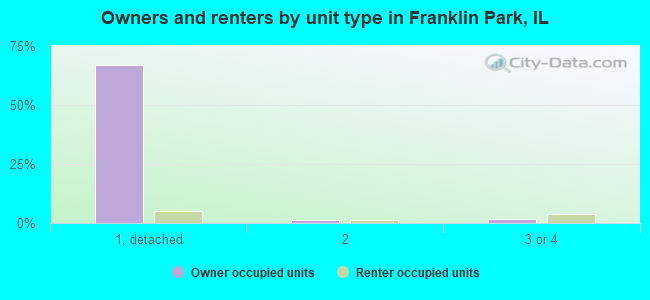
Houses: 6,293 (5,826 occupied: 4,347 owner occupied, 1,579 renter occupied )
% of renters here:
27%State:
33%
Housing density: 1,351 houses/condos per square mile
Median price asked for vacant for-sale houses and condos in 2022: $147,784.
Median contract rent in 2022: $954 (lower quartile is $838, upper quartile is $1,209)
Median rent asked for vacant for-rent units in 2022: $980
Median gross rent in Franklin Park, IL in 2022: $1,111
Housing units in Franklin Park with a mortgage: 2,911 (90 second mortgage, 0 home equity loan, 57 both second mortgage and home equity loan )Houses without a mortgage: 46
Median household income for houses/condos with a mortgage: $101,490
Median household income for apartments without a mortgage: $69,496
Median monthly housing costs: $1,378
Data:
Median house or condo value ($)
Median house or condo value ($ change since 2000)
Median house or condo value ($) - White
Median house or condo value ($) - Black or African American
Median house or condo value ($) - Asian
Median house or condo value ($) - Hispanic or Latino
Median house or condo value ($) - American Indian and Alaska Native
Median house or condo value ($) - Multirace
Median house or condo value ($) - Other Race
Median price asked for mobile homes ($)
Household density (households per square mile)
Mean house or condo value by units in structure - 1, detached ($)
Mean house or condo value by units in structure - 1, attached ($)
Mean house or condo value by units in structure - 2 ($)
Mean house or condo value by units in structure by units in structure - 3 or 4 ($)
Mean house or condo value by units in structure - 5 or more ($)
Mean house or condo value by units in structure - Boat, RV, van, etc. ($)
Mean house or condo value by units in structure - Mobile home ($)
Median contract rent ($)
Median contract rent - Lower quartile ($)
Median contract rent - Upper quartile ($)
Median gross rent ($)
Urban houses (%)
Rural houses (%)
Houses occupied (%)
Houses occupied (% change since 2000)
Houses owner occupied (%)
Houses owner occupied (% change since 2000)
Houses renter occupied (%)
Houses renter occupied (% change since 2000)
Vacant housing units - For rent (%)
Vacant housing units - For rent (% change since 2000)
Vacant housing units - For sale only (%)
Vacant housing units - For sale only (% change since 2000)
Vacant housing units - Rented or sold, not occupied (%)
Vacant housing units - Rented or sold, not occupied (% change since 2000)
Vacant housing units - For seasonal, recreational, or occasional use (%)
Vacant housing units - For seasonal, recreational, or occasional use (% change since 2000)
Vacant housing units - For migrant workers (%)
Vacant housing units - For migrant workers (% change since 2000)
Vacant housing units - Other vacant (%)
Vacant housing units - Other vacant (% change since 2000)
Median monthly housing costs ($)
Median household income for houses/condos with a mortgage ($)
Median household income for houses/condos without a mortgage ($)
Median household income ($)
Median household income ($) - White
Median household income ($) - Black or African American
Median household income ($) - Asian
Median household income ($) - Hispanic or Latino
Median household income ($) - American Indian and Alaska Native
Median household income ($) - Multirace
Median household income ($) - Other Race
Mortgage status - with mortgage (%)
Mortgage status - with second mortgage (%)
Mortgage status - with home equity loan (%)
Mortgage status - with both second mortgage and home equity loan (%)
Mortgage status - without a mortgage (%)
Median year house/condo built
Median year apartment built
Household type by relationship - Male householder living alone (%)
Household type by relationship - Male householder not living alone (%)
Household type by relationship - Female householder living alone (%)
Household type by relationship - Female householder not living alone (%)
Household type by relationship - Opposite-Sex spouse (%)
Household type by relationship - Same-Sex spouse (%)
Household type by relationship - Opposite-Sex unmarried partner (%)
Household type by relationship - Same-Sex unmarried partner (%)
Household type by relationship - In group quarters (%)
Size of family households - 2-person household (%)
Size of family households - 3-person household (%)
Size of family households - 4-person household (%)
Size of family households - 5-person household (%)
Size of family households - 6-person household (%)
Size of family households - 7-or-more-person household (%)
Size of nonfamily households - 1-person household (%)
Size of nonfamily households - 2-person household (%)
Size of nonfamily households - 3-person household (%)
Size of nonfamily households - 4-person household (%)
Size of nonfamily households - 5-person household (%)
Size of nonfamily households - 6-person household (%)
Size of nonfamily households - 7-or-moreperson household (%)
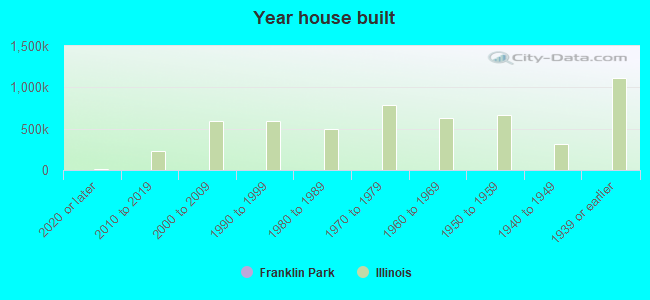
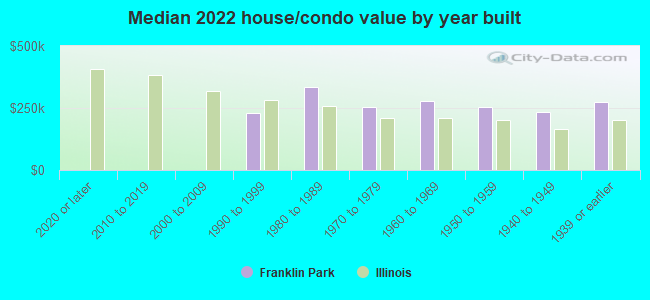
Year house built - Built 2010 or later (%)
Year house built - Built 2000 to 2009 (%)
Year house built - Built 1990 to 1999 (%)
Year house built - Built 1980 to 1989 (%)
Year house built - Built 1970 to 1979 (%)
Year house built - Built 1960 to 1969 (%)
Year house built - Built 1950 to 1959 (%)
Year house built - Built 1940 to 1949 (%)
Year house built - Built 1939 or earlier (%)
Median number of rooms in houses and condos
Median number of rooms in apartments
Median number of bedrooms in owner occupied houses
Mean number of bedrooms in owner occupied houses
Median number of bedrooms in renter occupied houses
Mean number of bedrooms in renter occupied houses
Median number of vehichles in owner occupied houses
Mean number of vehichles in owner occupied houses
Median number of vehichles in renter occupied houses
Mean number of vehichles in renter occupied houses
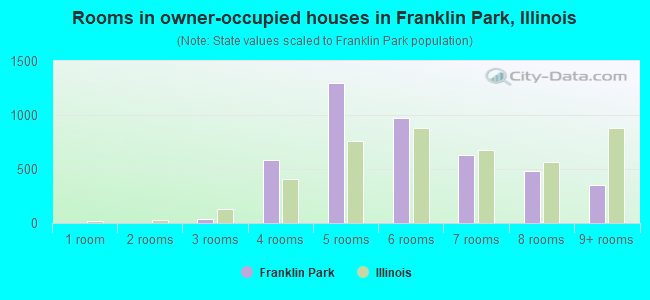
Rooms in owner-occupied houses - 1 room (%)
Rooms in owner-occupied houses - 2 rooms (%)
Rooms in owner-occupied houses - 3 rooms (%)
Rooms in owner-occupied houses - 4 rooms (%)
Rooms in owner-occupied houses - 5 rooms (%)
Rooms in owner-occupied houses - 6 rooms (%)
Rooms in owner-occupied houses - 7 rooms (%)
Rooms in owner-occupied houses - 8 rooms (%)
Rooms in owner-occupied houses - 9+ rooms (%)
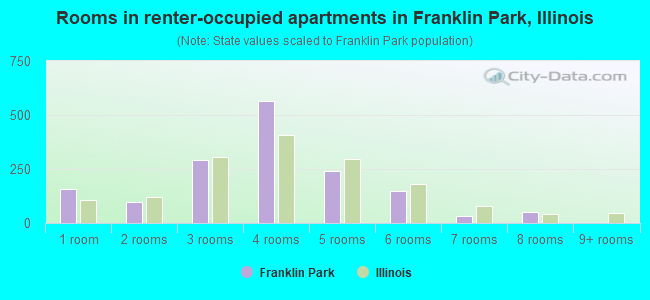
Rooms in renter-occupied houses - 1 room (%)
Rooms in renter-occupied houses - 2 rooms (%)
Rooms in renter-occupied houses - 3 rooms (%)
Rooms in renter-occupied houses - 4 rooms (%)
Rooms in renter-occupied houses - 5 rooms (%)
Rooms in renter-occupied houses - 6 rooms (%)
Rooms in renter-occupied houses - 7 rooms (%)
Rooms in renter-occupied houses - 8 rooms (%)
Rooms in renter-occupied houses - 9+ rooms (%)
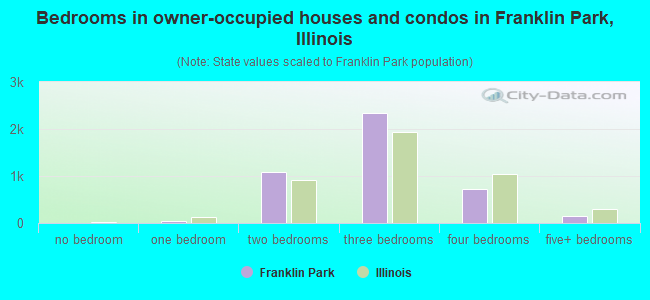
Bedrooms in owner-occupied houses - no bedrooms (%)
Bedrooms in owner-occupied houses - 1 bedroom (%)
Bedrooms in owner-occupied houses - 2 bedrooms (%)
Bedrooms in owner-occupied houses - 3 bedrooms (%)
Bedrooms in owner-occupied houses - 4 bedrooms (%)
Bedrooms in owner-occupied houses - 5+ bedrooms (%)
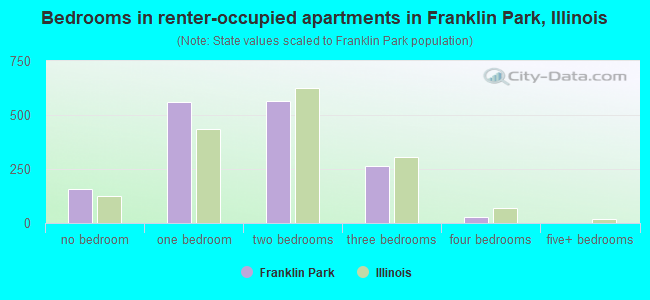
Bedrooms in renter-occupied houses - no bedrooms (%)
Bedrooms in renter-occupied houses - 1 bedroom (%)
Bedrooms in renter-occupied houses - 2 bedrooms (%)
Bedrooms in renter-occupied houses - 3 bedrooms (%)
Bedrooms in renter-occupied houses - 4 bedrooms (%)
Bedrooms in renter-occupied houses - 5+ bedrooms (%)
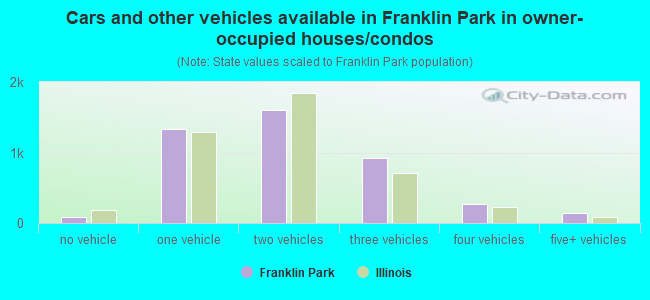
Vehicles available in owner-occupied houses - no vehicle available (%)
Vehicles available in owner-occupied houses - 1 vehicle available(%)
Vehicles available in owner-occupied houses - 2 Vehicles available (%)
Vehicles available in owner-occupied houses - 3 Vehicles available (%)
Vehicles available in owner-occupied houses - 4 Vehicles available (%)
Vehicles available in owner-occupied houses - 5+ Vehicles available (%)
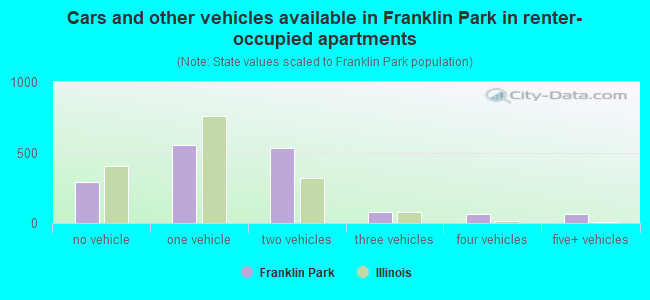
Vehicles available in renter-occupied houses - no vehicle available (%)
Vehicles available in renter-occupied houses - 1 vehicle available (%)
Vehicles available in renter-occupied houses - 2 Vehicles available (%)
Vehicles available in renter-occupied houses - 3 Vehicles available (%)
Vehicles available in renter-occupied houses - 4 Vehicles available (%)
Vehicles available in renter-occupied houses - 5+ Vehicles available (%)
Housing units in structures - 1, detached (%)
Housing units in structures - 1, attached (%)
Housing units in structures - 2 (%)
Housing units in structures - 3 or 4 (%)
Housing units in structures - 5 to 9 (%)
Housing units in structures - 10 to 19 (%)
Housing units in structures - 20 to 49 (%)
Housing units in structures - 50 or more (%)
Housing units in structures - Mobile home (%)
Housing units in structures - Boat, RV, van, etc. (%)
Housing units in structures - Owners - 1, detached (%)
Housing units in structures - Owners - 1, attached (%)
Housing units in structures - Owners - 2 (%)
Housing units in structures - Owners - 3 or 4 (%)
Housing units in structures - Owners - 5 to 9 (%)
Housing units in structures - Owners - 10 to 19 (%)
Housing units in structures - Owners - 20 to 49 (%)
Housing units in structures - Owners - 50 or more (%)
Housing units in structures - Owners - Mobile home (%)
Housing units in structures - Owners - Boat, RV, van, etc. (%)
Housing units in structures - Renters - 1, detached (%)
Housing units in structures - Renters - 1, attached (%)
Housing units in structures - Renters - 2 (%)
Housing units in structures - Renters - 3 or 4 (%)
Housing units in structures - Renters - 5 to 9 (%)
Housing units in structures - Renters - 10 to 19 (%)
Housing units in structures - Renters - 20 to 49 (%)
Housing units in structures - Renters - 50 or more (%)
Housing units in structures - Renters - Mobile home (%)
Housing units in structures - Renters - Boat, RV, van, etc. (%)
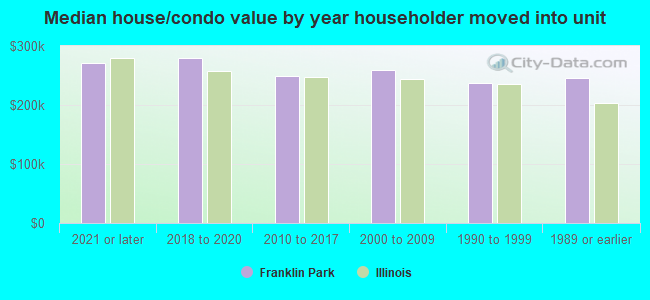
House/condo owner moved in on average (years ago)
Renter moved in on average (years ago)
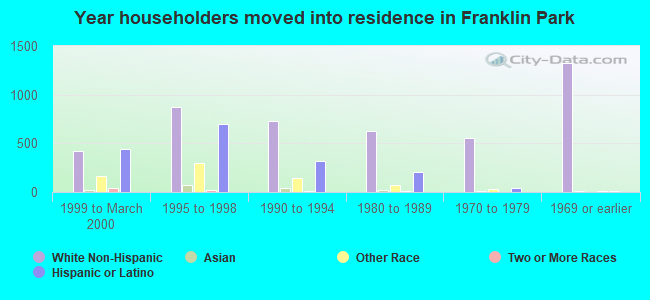
Year householder moved into unit - Moved in 1999 to March 2000 (%)
Year householder moved into unit - Moved in 1999 to March 2000 (%) - White
Year householder moved into unit - Moved in 1999 to March 2000 (%) - Black or African American
Year householder moved into unit - Moved in 1999 to March 2000 (%) - Asian
Year householder moved into unit - Moved in 1999 to March 2000 (%) - Hispanic or Latino
Year householder moved into unit - Moved in 1999 to March 2000 (%) - American Indian and Alaska Native
Year householder moved into unit - Moved in 1999 to March 2000 (%) - Multirace
Year householder moved into unit - Moved in 1999 to March 2000 (%) - Other Race
Year householder moved into unit - Moved in 1995 to 1998 (%)
Year householder moved into unit - Moved in 1995 to 1998 (%) - White
Year householder moved into unit - Moved in 1995 to 1998 (%) - Black or African American
Year householder moved into unit - Moved in 1995 to 1998 (%) - Asian
Year householder moved into unit - Moved in 1995 to 1998 (%) - Hispanic or Latino
Year householder moved into unit - Moved in 1995 to 1998 (%) - American Indian and Alaska Native
Year householder moved into unit - Moved in 1995 to 1998 (%) - Multirace
Year householder moved into unit - Moved in 1995 to 1998 (%) - Other Race
Year householder moved into unit - Moved in 1990 to 1994 (%)
Year householder moved into unit - Moved in 1990 to 1994 (%) - White
Year householder moved into unit - Moved in 1990 to 1994 (%) - Black or African American
Year householder moved into unit - Moved in 1990 to 1994 (%) - Asian
Year householder moved into unit - Moved in 1990 to 1994 (%) - Hispanic or Latino
Year householder moved into unit - Moved in 1990 to 1994 (%) - American Indian and Alaska Native
Year householder moved into unit - Moved in 1990 to 1994 (%) - Multirace
Year householder moved into unit - Moved in 1990 to 1994 (%) - Other Race
Year householder moved into unit - Moved in 1980 to 1989 (%)
Year householder moved into unit - Moved in 1980 to 1989 (%) - White
Year householder moved into unit - Moved in 1980 to 1989 (%) - Black or African American
Year householder moved into unit - Moved in 1980 to 1989 (%) - Asian
Year householder moved into unit - Moved in 1980 to 1989 (%) - Hispanic or Latino
Year householder moved into unit - Moved in 1980 to 1989 (%) - American Indian and Alaska Native
Year householder moved into unit - Moved in 1980 to 1989 (%) - Multirace
Year householder moved into unit - Moved in 1980 to 1989 (%) - Other Race
Year householder moved into unit - Moved in 1970 to 1979 (%)
Year householder moved into unit - Moved in 1970 to 1979 (%) - White
Year householder moved into unit - Moved in 1970 to 1979 (%) - Black or African American
Year householder moved into unit - Moved in 1970 to 1979 (%) - Asian
Year householder moved into unit - Moved in 1970 to 1979 (%) - Hispanic or Latino
Year householder moved into unit - Moved in 1970 to 1979 (%) - American Indian and Alaska Native
Year householder moved into unit - Moved in 1970 to 1979 (%) - Multirace
Year householder moved into unit - Moved in 1970 to 1979 (%) - Other Race
Year householder moved into unit - Moved in 1969 or earlier (%)
Year householder moved into unit - Moved in 1969 or earlier (%) - White
Year householder moved into unit - Moved in 1969 or earlier (%) - Black or African American
Year householder moved into unit - Moved in 1969 or earlier (%) - Asian
Year householder moved into unit - Moved in 1969 or earlier (%) - Hispanic or Latino
Year householder moved into unit - Moved in 1969 or earlier (%) - American Indian and Alaska Native
Year householder moved into unit - Moved in 1969 or earlier (%) - Multirace
Year householder moved into unit - Moved in 1969 or earlier (%) - Other Race
Housing units lacking complete plumbing facilities (%)
Housing units lacking complete kitchen facilities (%)
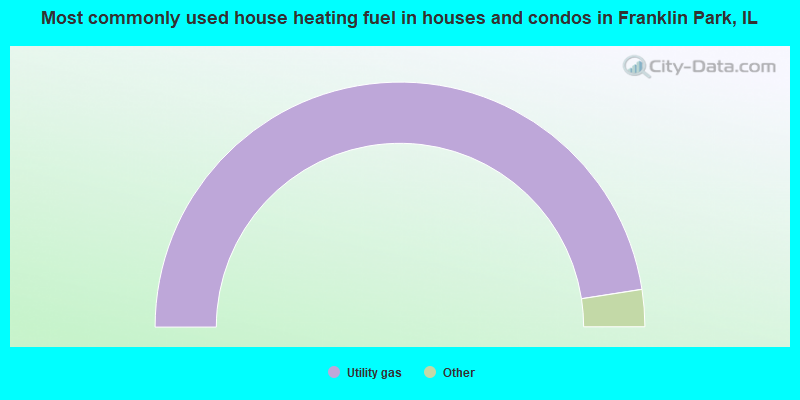
House heating fuel used in houses and condos - Utility gas (%)
House heating fuel used in houses and condos - Bottled, tank, or LP gas (%)
House heating fuel used in houses and condos - Electricity (%)
House heating fuel used in houses and condos - Fuel oil, kerosene, etc. (%)
House heating fuel used in houses and condos - Coal or coke (%)
House heating fuel used in houses and condos - Wood (%)
House heating fuel used in houses and condos - Solar energy (%)
House heating fuel used in houses and condos - Other fuel (%)
House heating fuel used in houses and condos - No fuel used (%)
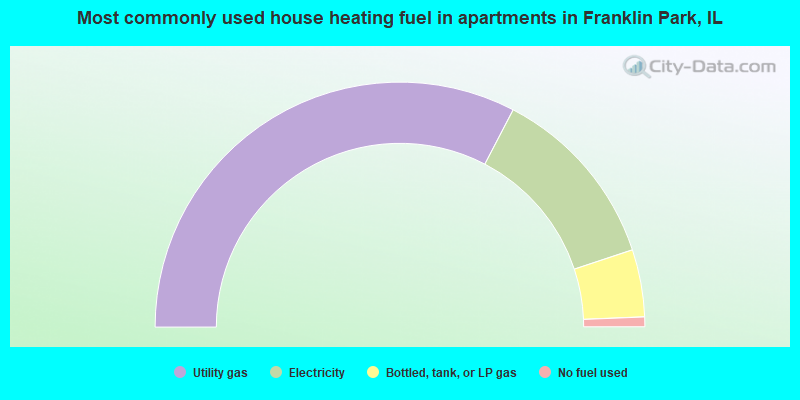
House heating fuel used in apartments - Utility gas (%)
House heating fuel used in apartments - Bottled, tank, or LP gas (%)
House heating fuel used in apartments - Electricity (%)
House heating fuel used in apartments - Fuel oil, kerosene, etc. (%)
House heating fuel used in apartments - Coal or coke (%)
House heating fuel used in apartments - Wood (%)
House heating fuel used in apartments - Solar energy (%)
House heating fuel used in apartments - Other fuel (%)
House heating fuel used in apartments - No fuel used (%)
Median year house/condo built: 1954Median year apartment built: 1968Household type by relationship:
Households: 17,965
Male householders: 2,961 (729 living alone ), Female householders: 2,711 (530 living alone )2,745 spouses (2,719 opposite-sex spouses ), 278 unmarried partners , (257 opposite-sex unmarried partners ), 6,467 children (6,208 natural , 39 adopted , 219 stepchildren ), 576 grandchildren , 352 brothers or sisters , 538 parents , 0 foster children , 559 other relatives , 757 non-relatives In group quarters: 16
Size of family households: 1,118 2-persons , 1,294 3-persons , 885 4-persons , 570 5-persons , 249 6-persons , 184 7-or-more-persons .
Size of nonfamily households: 1,353 1-person , 116 2-persons , 17 3-persons , 24 6-persons .
2,269 married couples with children. single-parent households (518 men , 915 women ).
38.1% of residents of Franklin Park speak English at home. of residents speak Spanish at home (55% speak English very well , 16% speak English well , 15% speak English not well , 15% don't speak English at all ).of residents speak other Indo-European language at home (66% speak English very well , 21% speak English well , 12% speak English not well , 1% don't speak English at all ).of residents speak Asian or Pacific Island language at home (74% speak English very well , 24% speak English well , 2% speak English not well ).of residents speak other language at home (79% speak English very well , 4% speak English well , 13% speak English not well , 4% don't speak English at all ).
Foreign born population: 5,865 (32.6%)of them are naturalized citizens )
Median number of rooms in houses and condos:
Median number of rooms in apartments
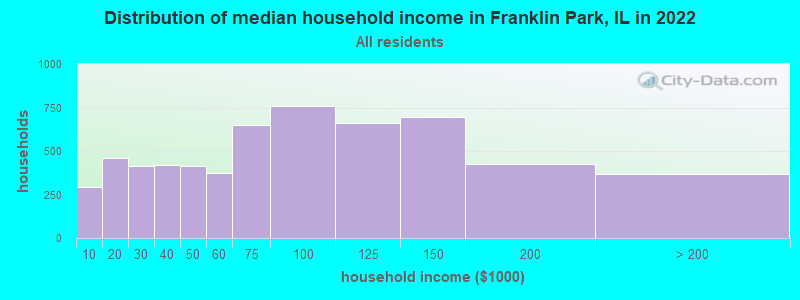
Franklin Park, IL household income distribution 294 Less than $10,000459 $10,000 to $19,999413 $20,000 to $29,999421 $30,000 to $39,999412 $40,000 to $49,999375 $50,000 to $59,999647 $60,000 to $74,999759 $75,000 to $99,999663 $100,000 to $124,999696 $125,000 to $149,999426 $150,000 to $199,999366 $200,000 or more
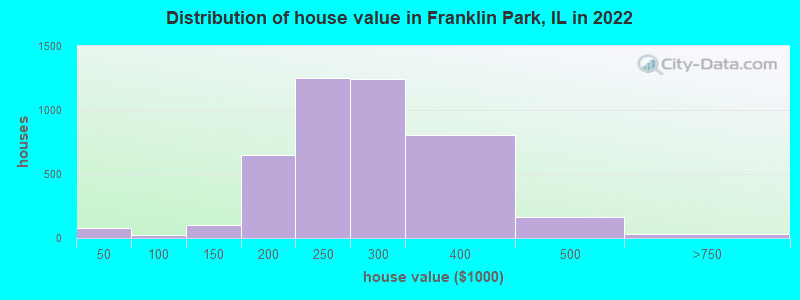
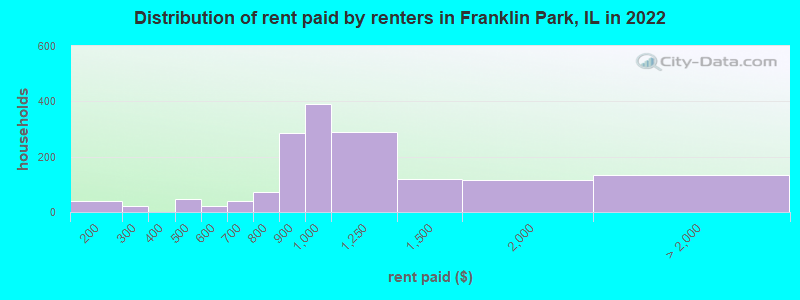
Home value of owner - occupied houses in 2022 in Franklin Park, IL 16 Less than $10,00016 $15,000 to $19,99921 $20,000 to $24,99911 $25,000 to $29,99911 $35,000 to $39,9995 $50,000 to $59,99920 $90,000 to $99,99931 $100,000 to $124,99967 $125,000 to $149,999323 $150,000 to $174,999328 $175,000 to $199,9991,251 $200,000 to $249,9991,238 $250,000 to $299,999802 $300,000 to $399,999162 $400,000 to $499,99915 $500,000 to $749,99915 $750,000 to $999,999Rent paid by renters in 2022 in Franklin Park, IL 40 $150 to $19922 $200 to $2498 $400 to $44939 $450 to $49919 $550 to $59940 $650 to $69968 $700 to $7495 $750 to $799285 $800 to $899389 $900 to $999289 $1,000 to $1,249117 $1,250 to $1,499114 $1,500 to $1,99987 $2,000 to $2,49912 $2,500 to $2,99931 No cash rent
Percentage of workers working in this county: 80.7%Number of people working at home: 790 (8.4% of all workers )
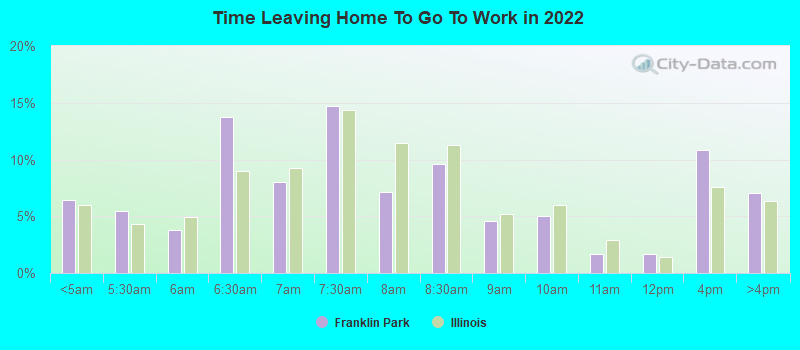
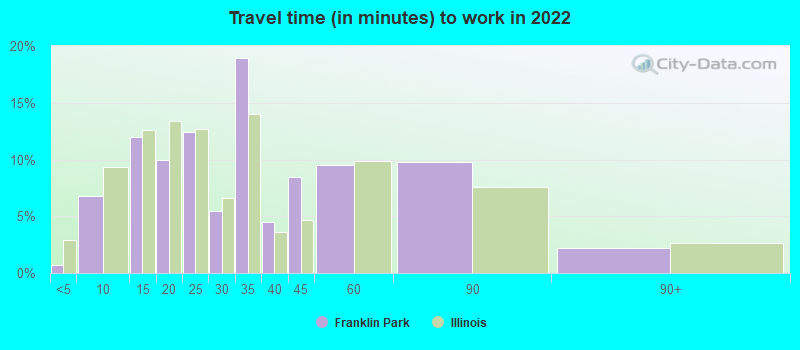
Travel time to work (commute)
Less than 5 minutes: 1135 to 9 minutes: 88510 to 14 minutes: 66915 to 19 minutes: 1,01020 to 24 minutes: 1,04225 to 29 minutes: 57830 to 34 minutes: 1,83635 to 39 minutes: 36240 to 44 minutes: 27145 to 59 minutes: 1,12760 to 89 minutes: 33490 or more minutes: 134
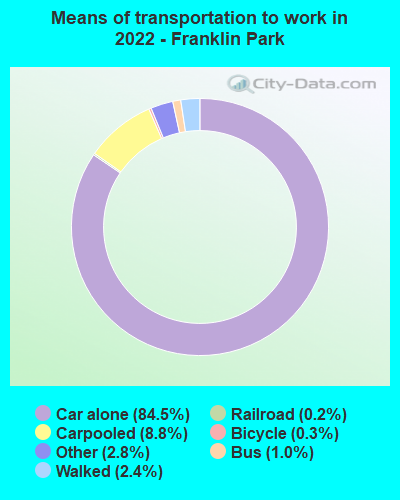
Means of transportation to work:
Drove a car alone: 11,587 (78.5%)Carpooled: 1,295 (8.8%)Bus : 128 (0.9%)Light rail, streetcar or trolley : 27 (0.2%)Taxi: 380 (2.6%)Bicycle: 46 (0.3%)Walked: 338 (2.3%)Worked at home: 790 (5.4%)
Unemployment by race in 2022
Unemployment rate for White non-Hispanic residents 4.5% Males1.6% FemalesUnemployment rate for American Indian and Alaska Native residents 29.0% MalesUnemployment rate for Asian residents 7.7% FemalesUnemployment rate for other race residents 7.7% Males2.4% FemalesUnemployment rate for two or more race residents 5.3% Males2.6% FemalesUnemployment rate for Hispanic or Latino residents 7.4% Males2.2% Females
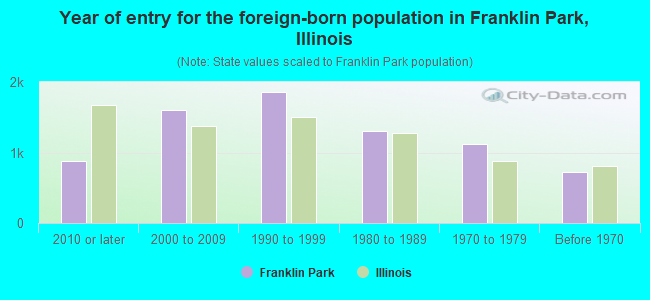
Year of entry for the foreign-born population in Franklin Park, Illinois
884 2010 or later 1,605 2000 to 2009 1,862 1990 to 1999 1,298 1980 to 1989 1,124 1970 to 1979 725 Before 1970
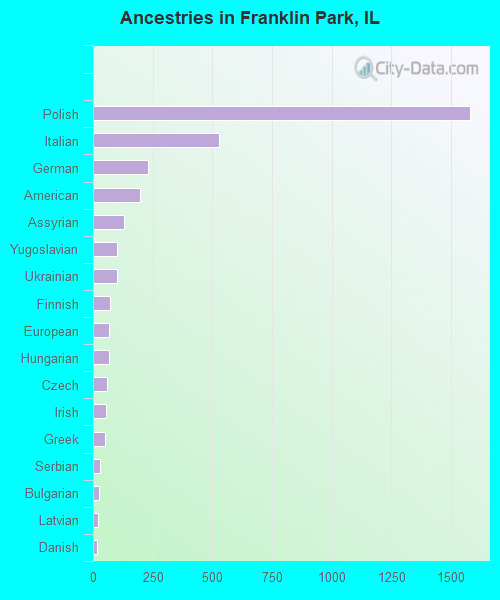
First ancestries reported:
Polish: 1,581 (14.1%)
Italian: 530 (4.7%)
German: 229 (2.0%)
American: 195 (1.7%)
Assyrian: 128 (1.1%)
Yugoslavian: 102 (0.9%)
Ukrainian: 100 (0.9%)
Finnish: 70 (0.6%)
European: 65 (0.6%)
Hungarian: 65 (0.6%)
Czech: 60 (0.5%)
Irish: 56 (0.5%)
Greek: 50 (0.4%)
Serbian: 31 (0.3%)
Bulgarian: 24 (0.2%)
Latvian: 21 (0.2%)
Danish: 16 (0.1%)
Belgian: 13 (0.1%)
Romanian: 13 (0.1%)
Swedish: 9 (0.08%)
Brazilian: 8 (0.07%)
French: 8 (0.07%)
Jamaican: 8 (0.07%)
Austrian: 7 (0.06%)
Dutch: 7 (0.06%)
Slovak: 7 (0.06%)
English: 6 (0.05%)
Welsh: 5 (0.04%)
Scottish: 2 (0.02%) Most common places of birth for foreign-born residents (%): Mexico Franklin Park:
59.4% (3,482)Illinois:
34.7% (626,958)
Poland Franklin Park:
15.4% (905)Illinois:
6.9% (124,474)
Venezuela Franklin Park:
5.2% (306)Illinois:
0.5% (9,688)
Philippines Franklin Park:
4.0% (234)Illinois:
5.2% (93,003)
Bosnia and Herzegovina Franklin Park:
3.1% (180)Illinois:
0.6% (10,776)
Italy Franklin Park:
1.8% (105)Illinois:
0.9% (15,679)
Ukraine Franklin Park:
1.6% (94)Illinois:
1.6% (29,316)
Place of birth for U.S.-born residents:
This state: 10,942Other state: 814Northeast: 199Midwest: 209South: 158West: 241 95.3% of Franklin Park residents lived in the same house 1 years ago.
Out of people who lived in different houses, 35.2% lived in this county.
Out of people who lived in different counties, 3.9% lived in Illinois.
Franklin Park:
95.3%State average:
88.3%
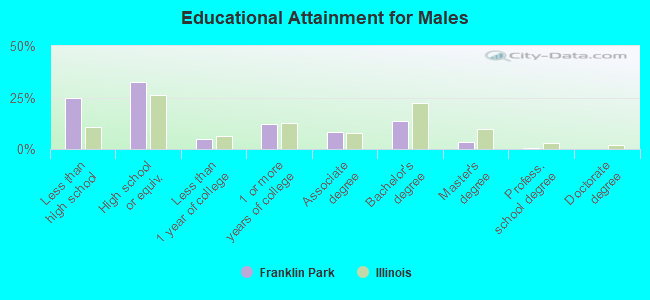
Education attainment for males 25 years and older:
No schooling: 336Nursery to 4th grade: 275th and 6th grade: 2227th and 8th grade: 1559th grade: 11810th grade: 6411th grade: 16912th grade, no diploma: 358High school graduate (or equivalency): 1,901Less than 1 year of college: 290Some college more than 1 year, no degree: 713Associate degree: 489Bachelor's degree: 781Master's degree: 199Professional school degree: 18Doctorate degree: 0
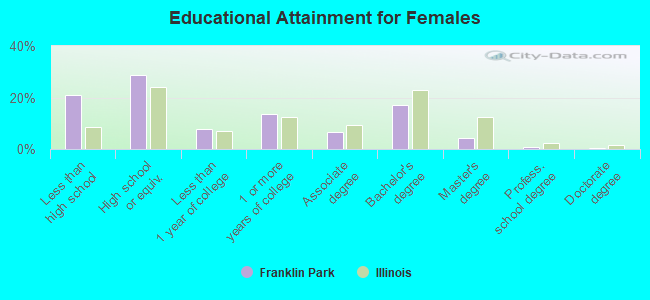
Education attainment for females 25 years and older:
No schooling: 216Nursery to 4th grade: 265th and 6th grade: 6027th and 8th grade: 999th grade: 5910th grade: 7011th grade: 3012th grade, no diploma: 149High school graduate (or equivalency): 1,713Less than 1 year of college: 463Some college more than 1 year, no degree: 804Associate degree: 381Bachelor's degree: 1,009Master's degree: 253Professional school degree: 48Doctorate degree: 18
Housing units in structures:
One, detached: 4,510One, attached: 68Two: 1473 or 4: 3825 to 9: 43310 to 19: 39820 to 49: 9550 or more: 197Mobile homes: 59Housing units lacking complete plumbing facilities in 2022: 0.8%Housing units lacking complete kitchen facilities in 2022: 1.7%House/condo owner moved in on average 16 years ago
Renter moved in on average 5 years ago
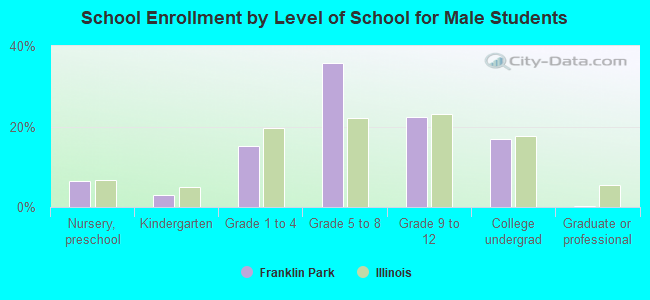
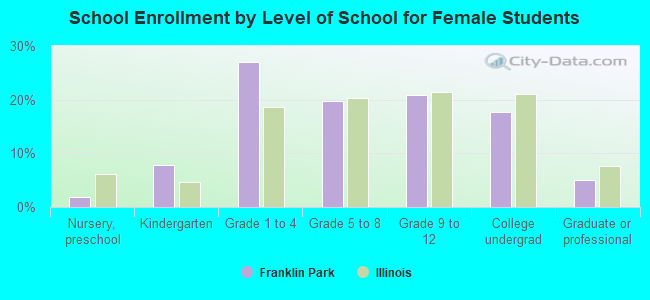
Private vs. public school enrollment:
Students in private schools in grades 1 to 8 (elementary and middle school): 151 Students in private schools in grades 9 to 12 (high school): 78 Students in private undergraduate colleges: 223