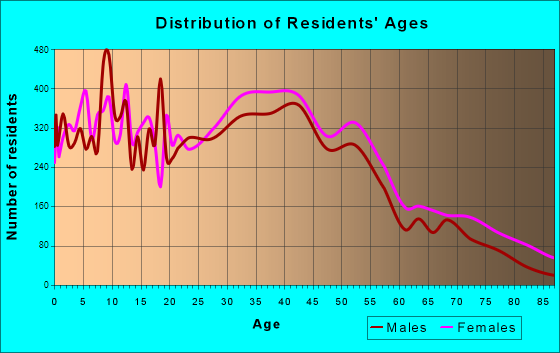
Freeport, NY (New York) Houses and Residents
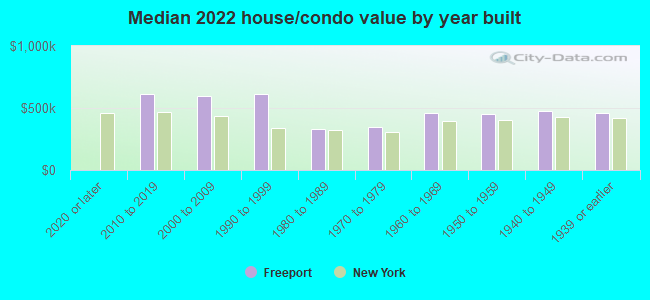
| Freeport: | $458,881 |
| New York: | $400,400 |
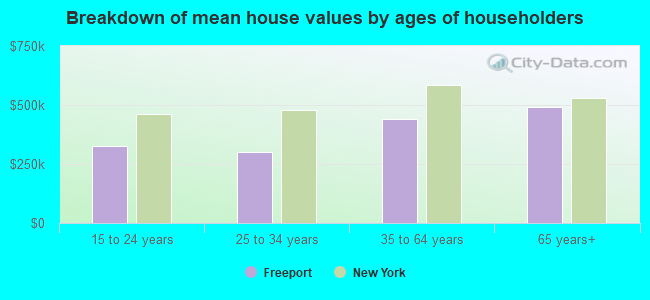
Mean price in 2022:
Detached houses: $481,426
Here: $481,426 State: $476,719 Townhouses or other attached units: $579,847
Here: $579,847 State: $699,270 In 2-unit structures: $595,050
Here: $595,050 State: $713,077 In 3-to-4-unit structures: $442,275
Here: $442,275 State: $764,568 In 5-or-more-unit structures: $304,634
Here: $304,634 State: $912,009
Total population: 43,304 (All urban)
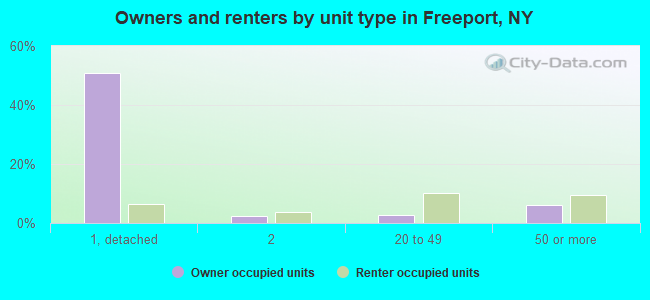
Houses: 14,991 (14,236 occupied: 9,806 owner occupied, 4,405 renter occupied)
| % of renters here: | 31% |
| State: | 46% |
Housing density: 3,263 houses/condos per square mile
Median price asked for vacant for-sale houses and condos in 2022: $433,473.
Median contract rent in 2022: $1,665 (lower quartile is $1,084, upper quartile is over $2,000)
Median rent asked for vacant for-rent units in 2022: $2,184
Median gross rent in Freeport, NY in 2022: $1,794
Housing units in Freeport with a mortgage: 6,806 (599 second mortgage, 52 home equity loan, 472 both second mortgage and home equity loan)
Houses without a mortgage: 194
Median household income for houses/condos with a mortgage: $136,151
Median household income for apartments without a mortgage: $75,408
Median monthly housing costs: $2,169
Compare current foreclosures in Freeport, NY:
| Photo | Address | Area | Beds / Baths | Price | Details |
|---|---|---|---|---|---|

|
#1
Sweezy Ave
Freeport, NY 11520
|
1,554 sq. feet
|
2 baths 4 beds |
show details | |

|
#2
E Bedell St
Freeport, NY 11520
|
810 sq. feet
|
1 baths 2 beds |
show details | |

|
#3
Wilson Pl
Freeport, NY 11520
|
1,681 sq. feet
|
1 baths 3 beds |
show details | |

|
#4
Archer St
Freeport, NY 11520
|
2,851 sq. feet
|
2 baths - beds |
show details | |

|
#5
Wallace St
Freeport, NY 11520
|
1,091 sq. feet
|
2 baths 3 beds |
show details | |

|
#6
W Seaman Ave
Freeport, NY 11520
|
1,876 sq. feet
|
2 baths 3 beds |
show details | |

|
#7
Park Ave
Freeport, NY 11520
|
1,153 sq. feet
|
1 baths - beds |
show details | |

|
#8
Tanglewood Ln
Freeport, NY 11520
|
2,520 sq. feet
|
3 baths - beds |
show details | |

|
#9
N Brookside Ave
Freeport, NY 11520
|
1,505 sq. feet
|
2 baths - beds |
show details | |

|
#10
Shonnard Ave
Freeport, NY 11520
|
1,756 sq. feet
|
2 baths - beds |
show details |
| Photo | Address | Area | Beds / Baths | Price | Details |
|---|---|---|---|---|---|

|
#11
Shonnard Ave
Freeport, NY 11520
|
1,511 sq. feet
|
2 baths - beds |
show details | |

|
#12
Roosevelt Ave
Freeport, NY 11520
|
1,690 sq. feet
|
2 baths - beds |
show details | |

|
#13
Westside Ave
Freeport, NY 11520
|
1,426 sq. feet
|
1 baths - beds |
show details | |

|
#14
Nassau Ave # 2
Freeport, NY 11520
|
1,770 sq. feet
|
2 baths - beds |
show details | |

|
#15
Branch Ave
Freeport, NY 11520
|
1,376 sq. feet
|
1 baths - beds |
show details | |

|
#16
Maxson Ave
Freeport, NY 11520
|
1,911 sq. feet
|
2 baths - beds |
show details | |

|
#17
Layton St # 1
Freeport, NY 11520
|
1,088 sq. feet
|
1 baths - beds |
show details | |

|
#18
Morris St
Freeport, NY 11520
|
1,658 sq. feet
|
1 baths - beds |
show details | |

|
#19
Lessing Pl
Freeport, NY 11520
|
1,109 sq. feet
|
1 baths - beds |
show details | |

|
#20
Jefferson St
Freeport, NY 11520
|
1,544 sq. feet
|
1 baths - beds |
show details |
| Photo | Address | Area | Beds / Baths | Price | Details |
|---|---|---|---|---|---|

|
#21
Saint Marks Ave
Freeport, NY 11520
|
1,376 sq. feet
|
1 baths - beds |
show details | |

|
#22
New York Ave
Freeport, NY 11520
|
1,840 sq. feet
|
1 baths - beds |
show details | |

|
#23
N Long Beach Ave
Freeport, NY 11520
|
1,684 sq. feet
|
2 baths - beds |
show details | |

|
#24
New York Ave
Freeport, NY 11520
|
1,482 sq. feet
|
1 baths - beds |
show details | |

|
#25
Sportsmans Ave
Freeport, NY 11520
|
1,731 sq. feet
|
2 baths - beds |
show details | |

|
#26
Tyler St
Freeport, NY 11520
|
825 sq. feet
|
1 baths - beds |
show details | |

|
#27
Guy Lombardo Ave
Freeport, NY 11520
|
1,397 sq. feet
|
2 baths - beds |
show details | |

|
#28
Pine St
Freeport, NY 11520
|
4,437 sq. feet
|
1 baths - beds |
show details | |

|
#29
Willow Ave
Freeport, NY 11520
|
1,392 sq. feet
|
2 baths - beds |
show details | |

|
#30
Connecticut Ave
Freeport, NY 11520
|
2,448 sq. feet
|
3 baths - beds |
show details |
| Photo | Address | Area | Beds / Baths | Price | Details |
|---|---|---|---|---|---|

|
#31
Saint Marks Ave
Freeport, NY 11520
|
1,376 sq. feet
|
1 baths - beds |
show details | |

|
#32
Lillian Ave
Freeport, NY 11520
|
1,232 sq. feet
|
1 baths - beds |
show details | |

|
#33
S Ocean Ave
Freeport, NY 11520
|
1,663 sq. feet
|
2 baths - beds |
show details | |

|
#34
Wallace St
Freeport, NY 11520
|
2,028 sq. feet
|
1 baths - beds |
show details | |

|
#35
Laurette Ln
Freeport, NY 11520
|
1,320 sq. feet
|
2 baths - beds |
show details | |

|
#36
Maryland Ave
Freeport, NY 11520
|
1,969 sq. feet
|
3 baths - beds |
show details | |

|
#37
Whaley St
Freeport, NY 11520
|
1,846 sq. feet
|
1 baths - beds |
show details | |

|
#38
Pennsylvania Ave
Freeport, NY 11520
|
1,611 sq. feet
|
2 baths - beds |
show details | |

|
#39
Mount Ave
Freeport, NY 11520
|
1,374 sq. feet
|
1 baths - beds |
show details | |

|
#40
E Seaman Ave
Freeport, NY 11520
|
1,062 sq. feet
|
1 baths - beds |
show details |
| Photo | Address | Area | Beds / Baths | Price | Details |
|---|---|---|---|---|---|

|
#41
Westside Ave
Freeport, NY 11520
|
2,585 sq. feet
|
2 baths - beds |
show details | |

|
#42
Martha St
Freeport, NY 11520
|
1,488 sq. feet
|
2 baths - beds |
show details | |

|
#43
Whaley St
Freeport, NY 11520
|
2,675 sq. feet
|
4 baths - beds |
show details | |

|
#44
Colonial Ave
Freeport, NY 11520
|
1,550 sq. feet
|
2 baths - beds |
show details | |

|
#45
E Milton St
Freeport, NY 11520
|
924 sq. feet
|
2 baths - beds |
show details | |

|
#46
Frederick Ave
Freeport, NY 11520
|
2,820 sq. feet
|
4 baths - beds |
show details | |

|
#47
Harris Ave
Freeport, NY 11520
|
1,269 sq. feet
|
1 baths - beds |
show details | |

|
#48
E Seaman Ave
Freeport, NY 11520
|
1,664 sq. feet
|
2 baths - beds |
show details | |

|
#49
N Columbus Ave
Freeport, NY 11520
|
981 sq. feet
|
2 baths - beds |
show details | |

|
Check over 1 million property listings on Foreclosure.com!
|
browse all offers | |||

Latest news about housing in Freeport, NY collected exclusively by city-data.com from local newspapers, TV, and radio stations

 | Wharfside Condos in Freeport (3 replies) |
| Reporting illegal accessory apartments (25 replies) |
| small houses or townhomes in Baldwin and surrounding areas (19 replies) |
| Looking to buy within a ~45min commute to Penn Station (Port W, Lynbrook, Rockeville Center, Baldwin,Freeport, Merrick) (109 replies) |
| Freeport Condos (5 replies) |
| Roosevelt Today? (68 replies) |
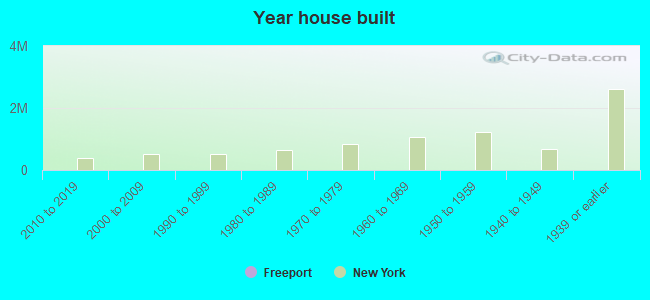
Median year apartment built: 1953
Household type by relationship:
Households: 44,037- Male householders: 6,706 (1,656 living alone), Female householders: 7,406 (1,920 living alone)
5,911 spouses (5,791 opposite-sex spouses), 851 unmarried partners, (851 opposite-sex unmarried partners), 13,183 children (12,759 natural, 129 adopted, 293 stepchildren), 2,699 grandchildren, 1,201 brothers or sisters, 1,009 parents, 0 foster children, 2,739 other relatives, 1,809 non-relatives
- In group quarters: 517
Size of family households: 2,779 2-persons, 2,034 3-persons, 1,764 4-persons, 1,286 5-persons, 758 6-persons, 1,125 7-or-more-persons.
Size of nonfamily households: 3,729 1-person, 756 2-persons, 60 3-persons, 12 5-persons.
3,481 married couples with children.
2,688 single-parent households (838 men, 1,850 women).
54.9% of residents of Freeport speak English at home.
38.7% of residents speak Spanish at home (47% speak English very well, 25% speak English well, 23% speak English not well, 4% don't speak English at all).
3.4% of residents speak other Indo-European language at home (70% speak English very well, 20% speak English well, 8% speak English not well, 2% don't speak English at all).
0.9% of residents speak Asian or Pacific Island language at home (46% speak English very well, 15% speak English well, 10% speak English not well, 29% don't speak English at all).
1.4% of residents speak other language at home (95% speak English very well, 1% speak English well, 2% speak English not well, 2% don't speak English at all).
Foreign born population: 15,783 (35.8%)
(58.9% of them are naturalized citizens)
| Here: | 6.5 |
| State: | 6.3 |
| Here: | 3.9 |
| State: | 3.8 |
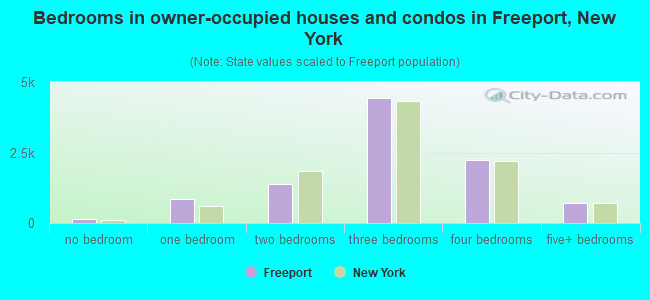
- Bedrooms in owner-occupied houses and condos in Freeport, New York
- 157no bedroom
- 8411 bedroom
- 1,3972 bedrooms
- 4,4453 bedrooms
- 2,2464 bedrooms
- 7205+ bedrooms
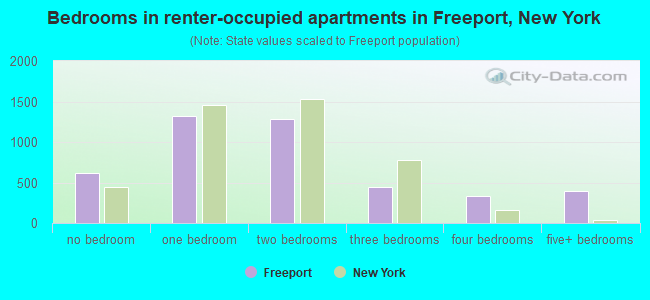
- Bedrooms in renter-occupied apartments in Freeport, New York
- 613no bedroom
- 1,3271 bedroom
- 1,2882 bedrooms
- 4463 bedrooms
- 3304 bedrooms
- 4015+ bedrooms
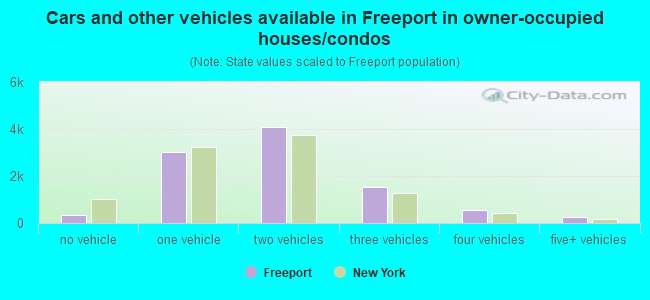
- Cars and other vehicles available in Freeport in owner-occupied houses/condos
- 341no vehicle
- 3,0011 vehicle
- 4,1022 vehicles
- 1,5413 vehicles
- 5474 vehicles
- 2755+ vehicles
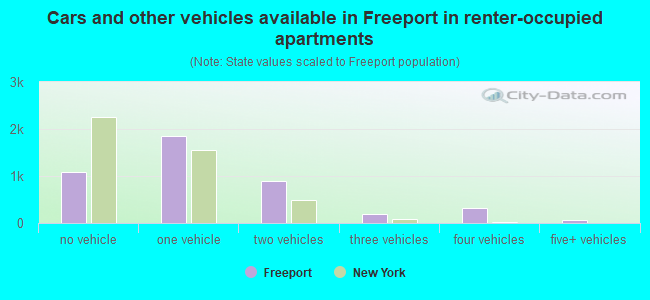
- Cars and other vehicles available in Freeport in renter-occupied apartments
- 1,078no vehicle
- 1,8521 vehicle
- 9042 vehicles
- 1893 vehicles
- 3144 vehicles
- 695+ vehicles
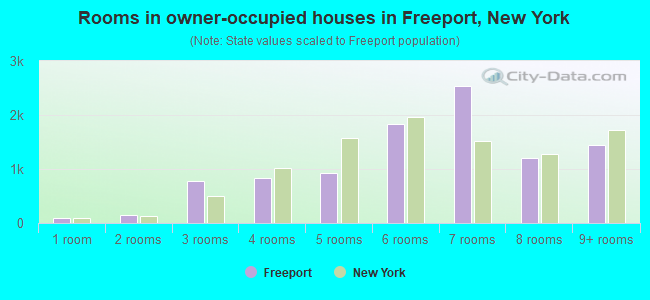
- Rooms in owner-occupied houses in Freeport, New York
- 951 room
- 1422 rooms
- 7753 rooms
- 8414 rooms
- 9305 rooms
- 1,8306 rooms
- 2,5457 rooms
- 1,2008 rooms
- 1,4499+ rooms
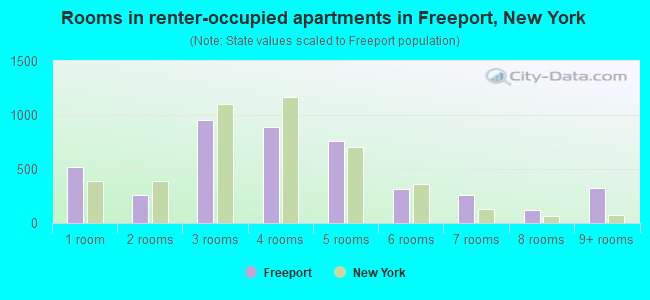
- Rooms in renter-occupied apartments in Freeport, New York
- 5221 room
- 2622 rooms
- 9573 rooms
- 8894 rooms
- 7635 rooms
- 3176 rooms
- 2597 rooms
- 1168 rooms
- 3219+ rooms
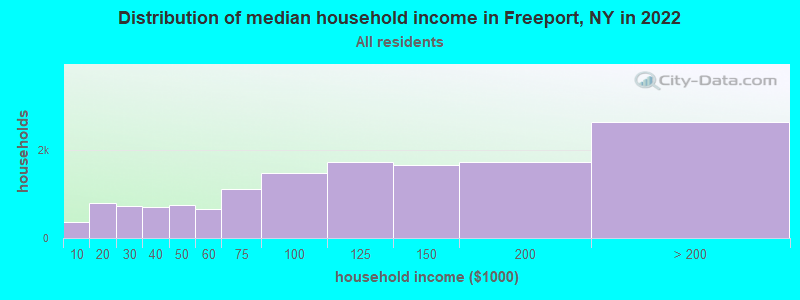
Freeport, NY household income distribution

- 352Less than $10,000
- 794$10,000 to $19,999
- 726$20,000 to $29,999
- 701$30,000 to $39,999
- 747$40,000 to $49,999
- 652$50,000 to $59,999
- 1,108$60,000 to $74,999
- 1,472$75,000 to $99,999
- 1,720$100,000 to $124,999
- 1,645$125,000 to $149,999
- 1,719$150,000 to $199,999
- 2,631$200,000 or more
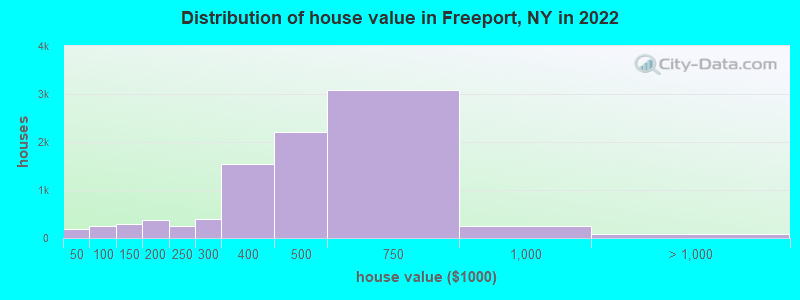
Home value of owner - occupied houses in 2022 in Freeport, NY
-
- 70Less than $10,000
- 34$10,000 to $14,999
- 10$25,000 to $29,999
- 34$35,000 to $39,999
- 43$40,000 to $49,999
- 113$50,000 to $59,999
- 25$60,000 to $69,999
- 25$80,000 to $89,999
- 52$90,000 to $99,999
- 179$100,000 to $124,999
- 104$125,000 to $149,999
- 280$150,000 to $174,999
- 96$175,000 to $199,999
- 260$200,000 to $249,999
- 402$250,000 to $299,999
- 1,532$300,000 to $399,999
- 2,204$400,000 to $499,999
- 3,076$500,000 to $749,999
- 251$750,000 to $999,999
- 73$2,000,000 or more
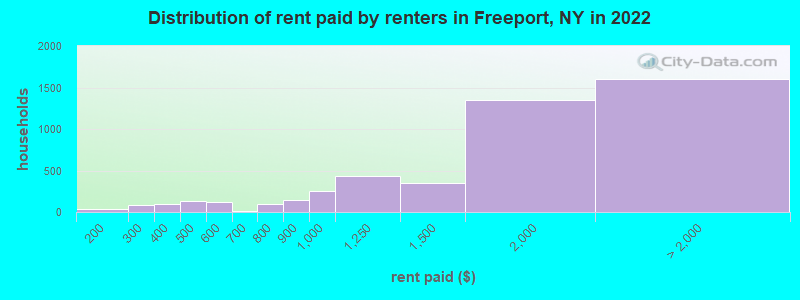
Rent paid by renters in 2022 in Freeport, NY
-
- 32$100 to $149
- 14$200 to $249
- 72$250 to $299
- 49$300 to $349
- 44$350 to $399
- 128$400 to $449
- 124$500 to $549
- 16$650 to $699
- 37$700 to $749
- 58$750 to $799
- 140$800 to $899
- 253$900 to $999
- 430$1,000 to $1,249
- 349$1,250 to $1,499
- 1,351$1,500 to $1,999
- 407$2,000 to $2,499
- 563$2,500 to $2,999
- 72$3,000 to $3,499
- 361$3,500 or more
- 198No cash rent
Percentage of workers working in this county: 69.3%
Number of people working at home: 1,965 (8.7% of all workers)
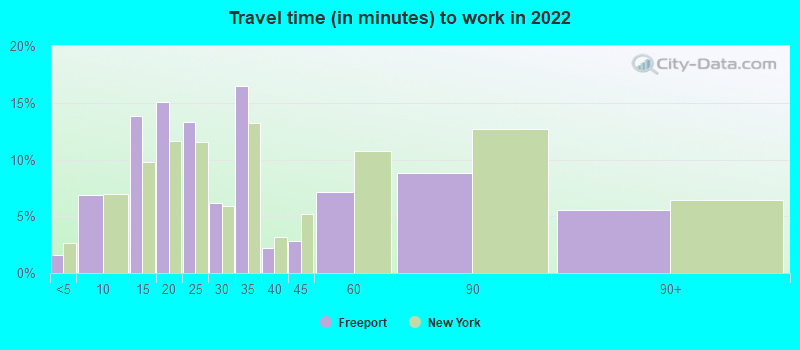
Travel time to work (commute)
- Less than 5 minutes: 362
- 5 to 9 minutes: 947
- 10 to 14 minutes: 2,141
- 15 to 19 minutes: 2,437
- 20 to 24 minutes: 3,130
- 25 to 29 minutes: 1,479
- 30 to 34 minutes: 2,378
- 35 to 39 minutes: 819
- 40 to 44 minutes: 1,074
- 45 to 59 minutes: 1,914
- 60 to 89 minutes: 2,065
- 90 or more minutes: 1,650
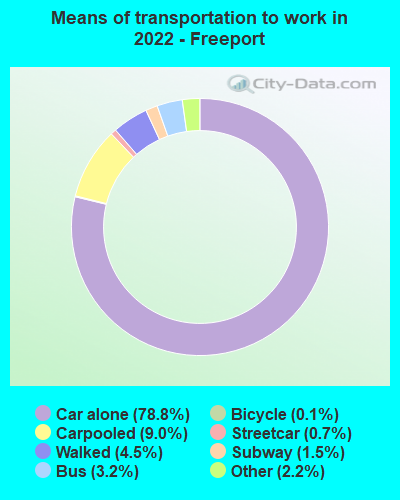
Means of transportation to work:
- Drove a car alone: 7,097 (64.6%)
- Carpooled: 787 (7.2%)
- Bus: 281 (2.6%)
- Subway or elevated rail: 53 (0.5%)
- Long-distance train or commuter rail: 122 (1.1%)
- Taxi: 287 (2.6%)
- Bicycle: 14 (0.1%)
- Walked: 433 (3.9%)
- Worked at home: 1,965 (17.9%)
- Unemployment by race in 2022
- Unemployment rate for White non-Hispanic residents
- 7.2%Males
- 4.1%Females
- Unemployment rate for Black residents
- 8.5%Males
- 6.2%Females
- Unemployment rate for Asian residents
- 6.4%Females
- Unemployment rate for other race residents
- 6.2%Males
- 1.3%Females
- Unemployment rate for two or more race residents
- 3.8%Males
- 10.0%Females
- Unemployment rate for Hispanic or Latino residents
- 4.7%Males
- 2.8%Females
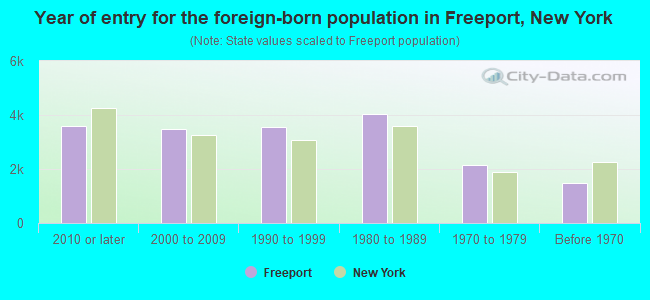
- Year of entry for the foreign-born population in Freeport, New York
- 3,6062010 or later
- 3,4892000 to 2009
- 3,5561990 to 1999
- 4,0371980 to 1989
- 2,1601970 to 1979
- 1,492Before 1970
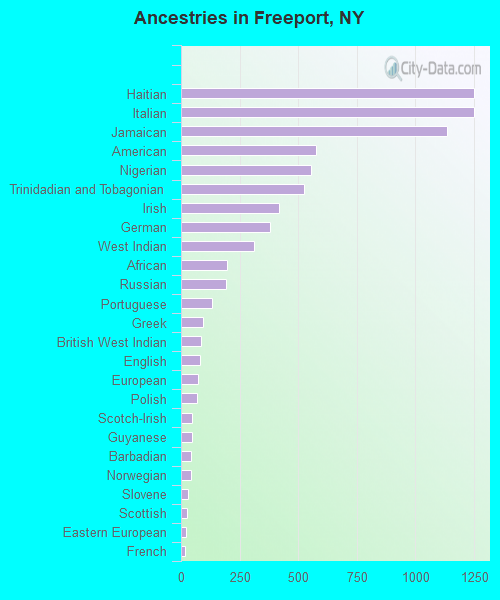
First ancestries reported:
- Haitian: 1,251 (4.7%)
- Italian: 1,249 (4.7%)
- Jamaican: 1,133 (4.3%)
- American: 576 (2.2%)
- Nigerian: 555 (2.1%)
- Trinidadian and Tobagonian: 524 (2.0%)
- Irish: 420 (1.6%)
- German: 381 (1.4%)
- West Indian: 310 (1.2%)
- African: 195 (0.7%)
- Russian: 193 (0.7%)
- Portuguese: 132 (0.5%)
- Greek: 93 (0.4%)
- British West Indian: 84 (0.3%)
- English: 81 (0.3%)
- European: 71 (0.3%)
- Polish: 68 (0.3%)
- Scotch-Irish: 46 (0.2%)
- Guyanese: 45 (0.2%)
- Barbadian: 44 (0.2%)
- Norwegian: 43 (0.2%)
- Slovene: 30 (0.1%)
- Scottish: 27 (0.1%)
- Eastern European: 22 (0.08%)
- French: 19 (0.07%)
- Slovak: 18 (0.07%)
- Zimbabwean: 18 (0.07%)
- Bermudan: 18 (0.07%)
- French Canadian: 15 (0.06%)
- Swedish: 14 (0.05%)
- Lithuanian: 12 (0.05%)
- Finnish: 11 (0.04%)
- Brazilian: 10 (0.04%)
- Estonian: 10 (0.04%)
- Belizean: 10 (0.04%)
- Czech: 8 (0.03%)
- Slavic: 8 (0.03%)
- Ukrainian: 8 (0.03%)
- Dutch: 7 (0.03%)
- Egyptian: 6 (0.02%)
- Iranian: 6 (0.02%)
- Ugandan: 2 (0.01%)
Most common places of birth for foreign-born residents (%):
| Freeport: | 25.9% (3,956) |
| New York: | 11.1% (501,040) |
| Freeport: | 23.0% (3,518) |
| New York: | 2.4% (108,067) |
| Freeport: | 5.9% (896) |
| New York: | 2.8% (126,936) |
| Freeport: | 4.8% (738) |
| New York: | 1.4% (61,245) |
| Freeport: | 4.0% (615) |
| New York: | 3.9% (177,448) |
| Freeport: | 3.9% (602) |
| New York: | 5.0% (227,557) |
| Freeport: | 3.8% (577) |
| New York: | 2.5% (111,920) |
| Freeport: | 2.2% (340) |
| New York: | 3.8% (172,129) |
| Freeport: | 2.2% (333) |
| New York: | 2.0% (91,428) |
| Freeport: | 2.1% (315) |
| New York: | 0.7% (33,746) |
| Freeport: | 2.0% (299) |
| New York: | 0.4% (18,218) |
| Freeport: | 1.7% (265) |
| New York: | 0.2% (8,227) |
| Freeport: | 1.5% (235) |
| New York: | 4.8% (214,559) |
Place of birth for U.S.-born residents:
- This state: 25,083
- Other state: 2,240
- Northeast: 529
- Midwest: 119
- South: 1,433
- West: 135
94.7% of Freeport residents lived in the same house 1 years ago.
Out of people who lived in different houses, 38.8% lived in this county.
Out of people who lived in different counties, 86.3% lived in New York.
| Freeport: | 94.7% |
| State average: | 89.6% |
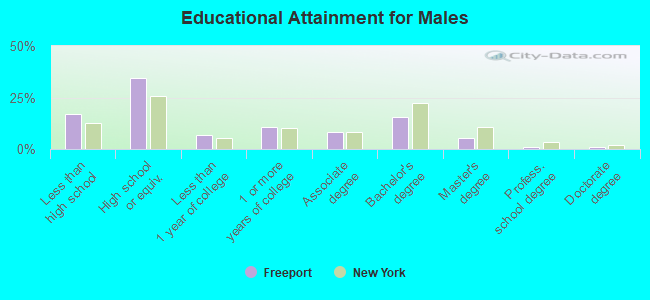
Education attainment for males 25 years and older:
- No schooling: 901
- Nursery to 4th grade: 207
- 5th and 6th grade: 245
- 7th and 8th grade: 363
- 9th grade: 279
- 10th grade: 62
- 11th grade: 227
- 12th grade, no diploma: 308
- High school graduate (or equivalency): 5,286
- Less than 1 year of college: 1,009
- Some college more than 1 year, no degree: 1,628
- Associate degree: 1,260
- Bachelor's degree: 2,371
- Master's degree: 850
- Professional school degree: 180
- Doctorate degree: 186
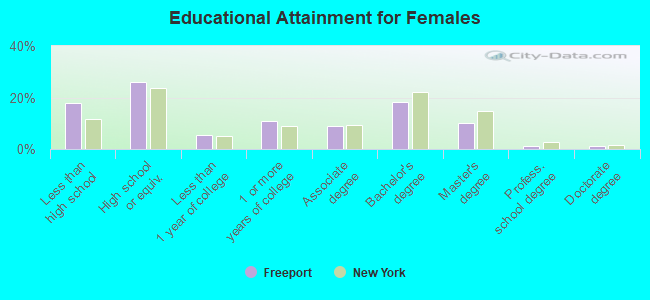
Education attainment for females 25 years and older:
- No schooling: 1,051
- Nursery to 4th grade: 312
- 5th and 6th grade: 206
- 7th and 8th grade: 222
- 9th grade: 301
- 10th grade: 100
- 11th grade: 71
- 12th grade, no diploma: 556
- High school graduate (or equivalency): 4,058
- Less than 1 year of college: 834
- Some college more than 1 year, no degree: 1,727
- Associate degree: 1,382
- Bachelor's degree: 2,871
- Master's degree: 1,610
- Professional school degree: 185
- Doctorate degree: 207
Housing units in structures:
- One, detached: 9,202
- One, attached: 264
- Two: 714
- 3 or 4: 478
- 5 to 9: 436
- 10 to 19: 471
- 20 to 49: 1,365
- 50 or more: 1,995
- Mobile homes: 64
Housing units lacking complete kitchen facilities in 2022: 0.6%
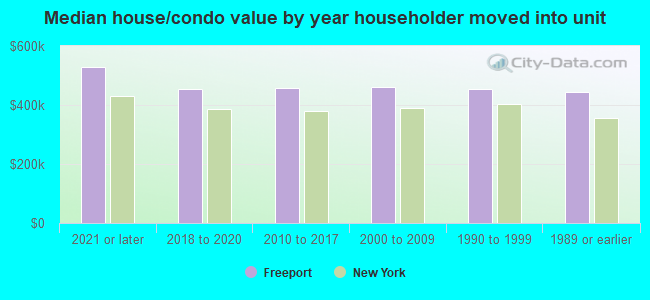
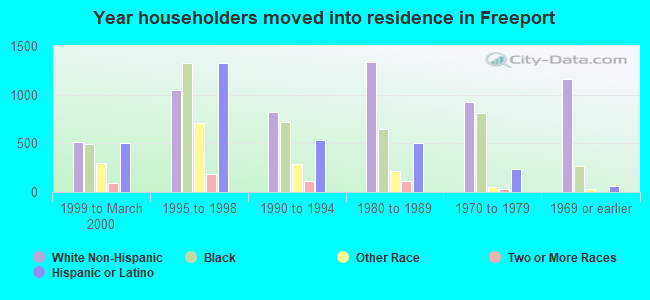
House/condo owner moved in on average 14 years ago
Renter moved in on average 7 years ago
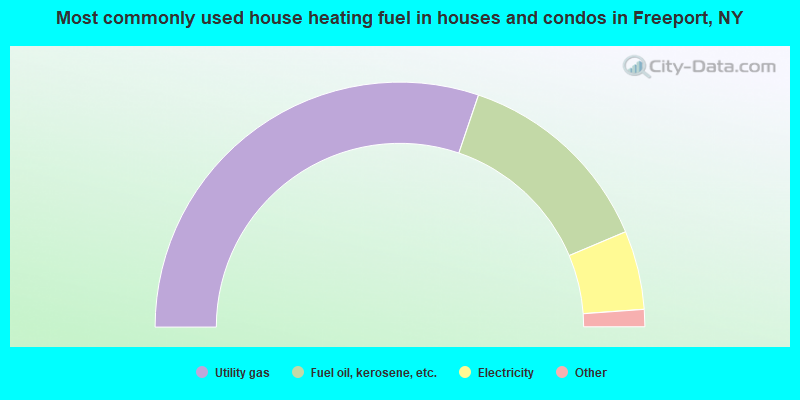
- 60.4%Utility gas
- 26.9%Fuel oil, kerosene, etc.
- 10.4%Electricity
- 1.6%Bottled, tank, or LP gas
- 0.6%Other fuel
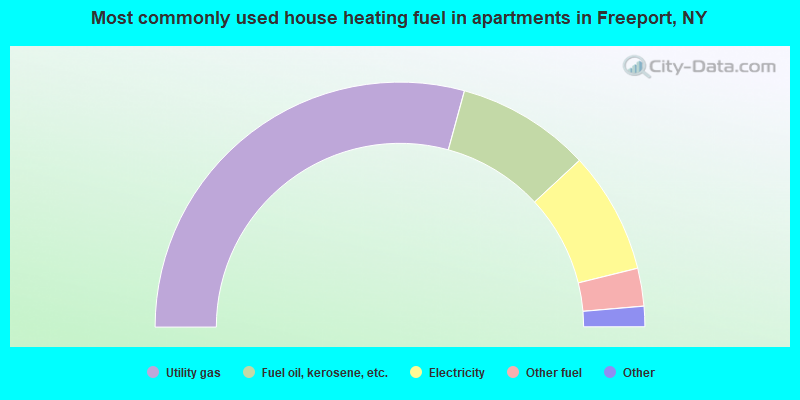
- 58.5%Utility gas
- 17.7%Fuel oil, kerosene, etc.
- 16.1%Electricity
- 5.0%Other fuel
- 1.6%Bottled, tank, or LP gas
- 1.1%No fuel used
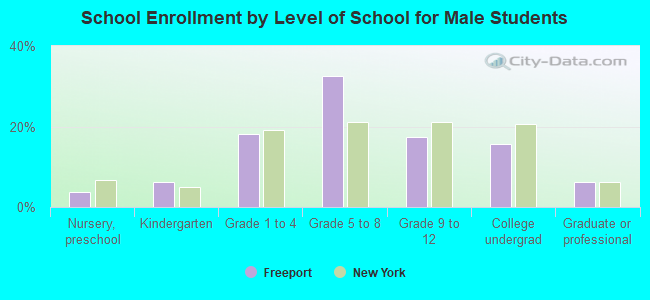
Private vs. public school enrollment:
| Here: | 5.7% |
| New York: | 15.6% |
| Here: | 3.8% |
| New York: | 15.0% |
| Here: | 31.9% |
| New York: | 39.2% |