Garden City, MI (Michigan) Houses and Residents
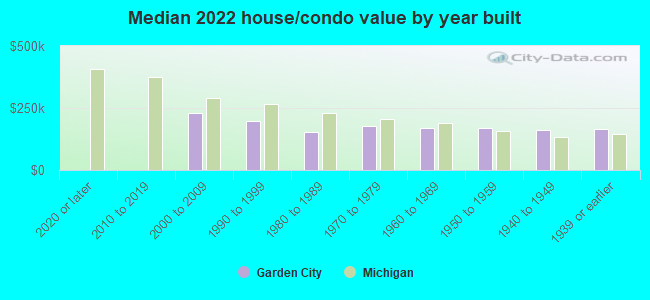
| Garden City: | $167,155 |
| Michigan: | $224,400 |
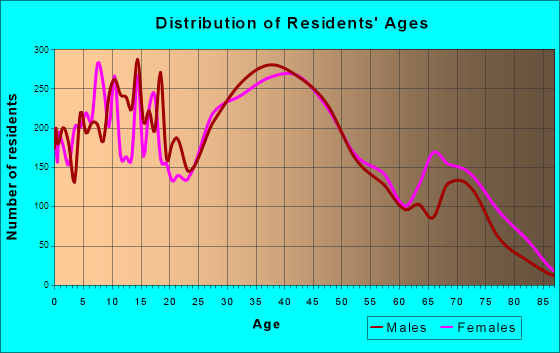
Total population: 27,052 (All urban)
Houses: 11,307 (11,008 occupied: 8,938 owner occupied, 2,133 renter occupied)
| % of renters here: | 19% |
| State: | 27% |
Housing density: 1,928 houses/condos per square mile
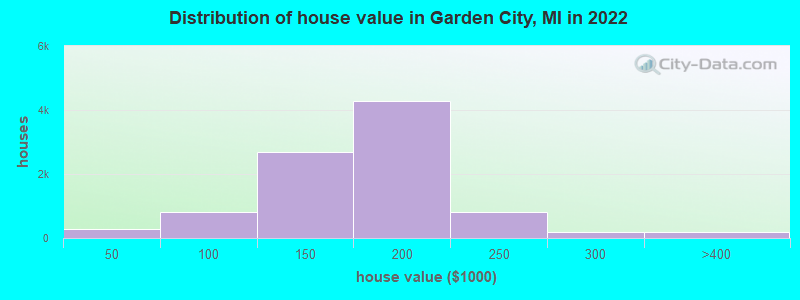
Median price asked for vacant for-sale houses and condos in 2022: $120,261.
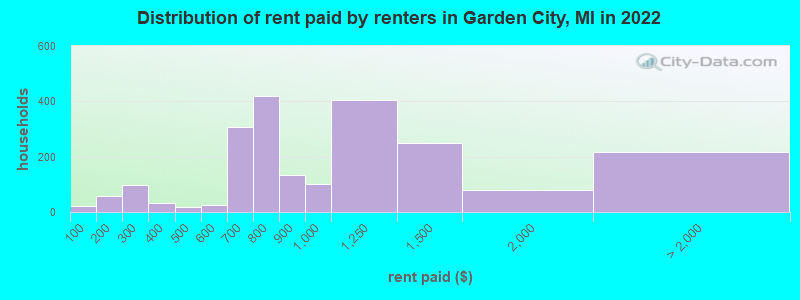
Median contract rent in 2022: $797 (lower quartile is $694, upper quartile is $1,187)
Median rent asked for vacant for-rent units in 2022: $4,526
Median gross rent in Garden City, MI in 2022: $954
Housing units in Garden City with a mortgage: 5,958 (453 second mortgage, 21 home equity loan, 350 both second mortgage and home equity loan)
Houses without a mortgage: 544
Median household income for houses/condos with a mortgage: $77,977
Median household income for apartments without a mortgage: $49,959
Median monthly housing costs: $1,003
Compare current foreclosures in Garden City, MI:
| Photo | Address | Area | Beds / Baths | Price | Details |
|---|---|---|---|---|---|

|
#1
Helen St
Garden City, MI 48135
|
960 sq. feet
|
1 baths 3 beds |
$199,900
|
show details |

|
#2
E Rose Ave
Garden City, MI 48135
|
981 sq. feet
|
1 baths 3 beds |
$195,001
|
show details |

|
#3
Barton St
Garden City, MI 48135
|
1,000 sq. feet
|
1 baths 3 beds |
show details | |

|
#4
Bock St
Garden City, MI 48135
|
925 sq. feet
|
1 baths 3 beds |
show details | |

|
#5
Sharon St
Garden City, MI 48135
|
1,044 sq. feet
|
2 baths 4 beds |
show details | |

|
#6
Florence St
Garden City, MI 48135
|
1,123 sq. feet
|
1 baths 2 beds |
show details | |

|
#7
Marquette St
Garden City, MI 48135
|
- sq. feet
|
1 baths 3 beds |
show details | |

|
#8
Gilman St
Garden City, MI 48135
|
1,101 sq. feet
|
1 baths 3 beds |
show details | |

|
#9
Dover St
Garden City, MI 48135
|
972 sq. feet
|
1 baths 2 beds |
show details | |

|
#10
Brown St
Garden City, MI 48135
|
1,554 sq. feet
|
1 baths - beds |
show details |
| Photo | Address | Area | Beds / Baths | Price | Details |
|---|---|---|---|---|---|

|
#11
Sheridan St
Garden City, MI 48135
|
1,092 sq. feet
|
1 baths - beds |
show details | |

|
#12
Helen St
Garden City, MI 48135
|
864 sq. feet
|
1 baths - beds |
show details | |

|
#13
Pierce St
Garden City, MI 48135
|
624 sq. feet
|
1 baths - beds |
show details | |

|
#14
Dawson St
Garden City, MI 48135
|
1,532 sq. feet
|
1 baths - beds |
show details | |

|
#15
Barton St
Garden City, MI 48135
|
975 sq. feet
|
1 baths - beds |
show details | |

|
#16
Harrison St
Garden City, MI 48135
|
1,145 sq. feet
|
2 baths - beds |
show details | |

|
#17
Hawthorne St
Garden City, MI 48135
|
1,044 sq. feet
|
1 baths - beds |
show details | |

|
#18
Helen St
Garden City, MI 48135
|
1,240 sq. feet
|
1 baths - beds |
show details | |

|
#19
Schuman St
Garden City, MI 48135
|
864 sq. feet
|
1 baths - beds |
show details | |

|
#20
Arcola St
Garden City, MI 48135
|
1,044 sq. feet
|
1 baths - beds |
show details |
| Photo | Address | Area | Beds / Baths | Price | Details |
|---|---|---|---|---|---|

|
#21
Maplewood St
Garden City, MI 48135
|
929 sq. feet
|
1 baths - beds |
show details | |

|
#22
Alvin St
Garden City, MI 48135
|
1,412 sq. feet
|
1 baths - beds |
show details | |

|
#23
Mansfield St
Garden City, MI 48135
|
1,044 sq. feet
|
1 baths - beds |
show details | |

|
#24
Kathryn St
Garden City, MI 48135
|
958 sq. feet
|
1 baths - beds |
show details | |

|
#25
Balmoral St
Garden City, MI 48135
|
1,040 sq. feet
|
1 baths - beds |
show details | |

|
#26
Chester St
Garden City, MI 48135
|
1,258 sq. feet
|
1 baths - beds |
show details | |

|
#27
Belton St
Garden City, MI 48135
|
1,192 sq. feet
|
1 baths - beds |
show details | |

|
#28
Lathers St
Garden City, MI 48135
|
754 sq. feet
|
1 baths - beds |
show details | |

|
#29
Cambridge St
Garden City, MI 48135
|
2,240 sq. feet
|
1 baths - beds |
show details | |

|
#30
Garden St
Garden City, MI 48135
|
838 sq. feet
|
1 baths - beds |
show details |
| Photo | Address | Area | Beds / Baths | Price | Details |
|---|---|---|---|---|---|

|
#31
Sharon St
Garden City, MI 48135
|
1,044 sq. feet
|
1 baths - beds |
show details | |

|
#32
Pierce St
Garden City, MI 48135
|
768 sq. feet
|
1 baths - beds |
show details | |

|
#33
Donnelly St
Garden City, MI 48135
|
1,540 sq. feet
|
1 baths - beds |
show details | |

|
#34
Beechwood St
Garden City, MI 48135
|
1,269 sq. feet
|
2 baths - beds |
show details | |

|
#35
Brown Ct
Garden City, MI 48135
|
1,141 sq. feet
|
1 baths - beds |
show details | |

|
#36
Deering St
Garden City, MI 48135
|
958 sq. feet
|
1 baths - beds |
show details | |

|
#37
Balmoral St
Garden City, MI 48135
|
864 sq. feet
|
1 baths - beds |
show details | |

|
#38
Sheridan St
Garden City, MI 48135
|
- sq. feet
|
- baths - beds |
show details | |

|
#39
Brown St
Garden City, MI 48135
|
- sq. feet
|
- baths - beds |
show details | |

|
#40
John Hauk St
Garden City, MI 48135
|
- sq. feet
|
- baths - beds |
show details |
| Photo | Address | Area | Beds / Baths | Price | Details |
|---|---|---|---|---|---|

|
#41
Krauter St Apt 6
Garden City, MI 48135
|
- sq. feet
|
- baths - beds |
show details | |

|
#42
Warren Rd
Garden City, MI 48135
|
- sq. feet
|
- baths - beds |
show details | |

|
#43
Windsor St
Garden City, MI 48135
|
- sq. feet
|
- baths - beds |
show details | |

|
#44
Deering St
Garden City, MI 48135
|
- sq. feet
|
- baths - beds |
show details | |

|
#45
James St
Garden City, MI 48135
|
- sq. feet
|
- baths - beds |
show details | |

|
#46
Arcola St
Garden City, MI 48135
|
- sq. feet
|
- baths - beds |
show details | |

|
#47
Hennepin St
Garden City, MI 48135
|
- sq. feet
|
- baths - beds |
show details | |

|
#48
Brandt St
Garden City, MI 48135
|
- sq. feet
|
- baths - beds |
show details | |

|
#49
Helen St
Garden City, MI 48135
|
- sq. feet
|
- baths - beds |
show details | |

|
Check over 1 million property listings on Foreclosure.com!
|
browse all offers | |||


 | Apartments near UofM (14 replies) |
| Solution for your parent's house full of "stuff" in SE Michigan (25 replies) |
| Relocation city for Indian parents (close to Windsor, Ontario) (9 replies) |
| Detroit is a great city (17 replies) |
| Buying Home in Livonia, MI (moving from Troy) (6 replies) |
| Looking for a condo/coop near DTW. Any recommendations? (8 replies) |
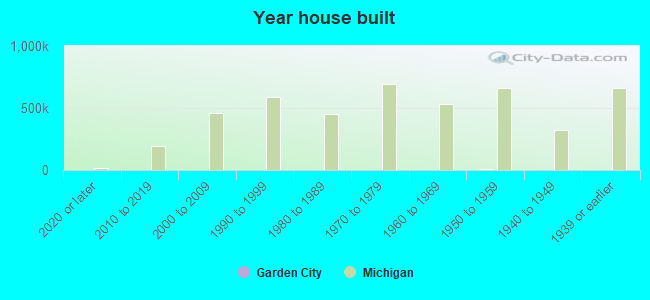
Median year apartment built: 1960
Household type by relationship:
Households: 26,827- Male householders: 5,458 (1,587 living alone), Female householders: 5,414 (1,619 living alone)
4,657 spouses (4,636 opposite-sex spouses), 901 unmarried partners, (878 opposite-sex unmarried partners), 7,571 children (6,980 natural, 56 adopted, 534 stepchildren), 719 grandchildren, 353 brothers or sisters, 560 parents, 34 foster children, 380 other relatives, 721 non-relatives
- In group quarters: 54
Size of family households: 3,101 2-persons, 1,856 3-persons, 1,266 4-persons, 654 5-persons, 166 6-persons, 29 7-or-more-persons.
Size of nonfamily households: 3,323 1-person, 567 2-persons, 32 3-persons, 38 4-persons.
3,164 married couples with children.
1,435 single-parent households (550 men, 885 women).
93.4% of residents of Garden City speak English at home.
1.0% of residents speak Spanish at home (92% speak English very well, 4% speak English well, 5% speak English not well).
1.8% of residents speak other Indo-European language at home (74% speak English very well, 12% speak English well, 12% speak English not well, 2% don't speak English at all).
0.6% of residents speak Asian or Pacific Island language at home (36% speak English very well, 56% speak English well, 7% speak English not well).
2.7% of residents speak other language at home (80% speak English very well, 7% speak English well, 7% speak English not well, 6% don't speak English at all).
Foreign born population: 1,189 (4.4%)
(73.5% of them are naturalized citizens)
| Here: | 5.7 |
| State: | 6.5 |
| Here: | 4.5 |
| State: | 4.3 |
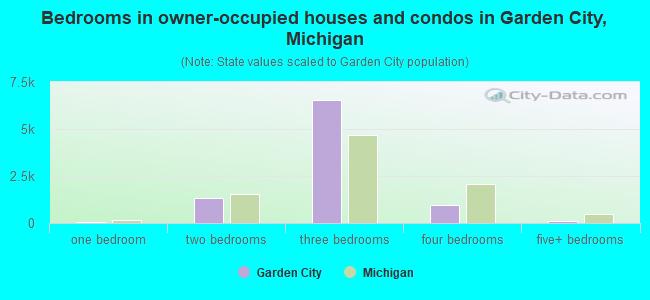
- Bedrooms in owner-occupied houses and condos in Garden City, Michigan
- 0no bedroom
- 341 bedroom
- 1,3102 bedrooms
- 6,5213 bedrooms
- 9514 bedrooms
- 1245+ bedrooms
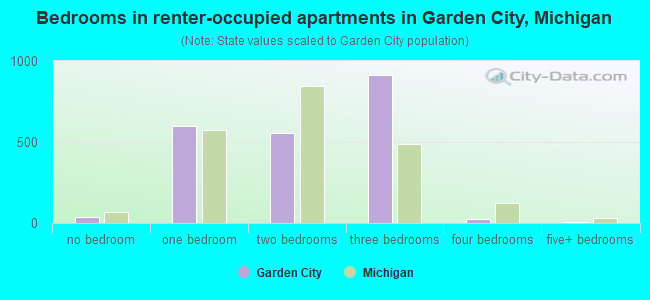
- Bedrooms in renter-occupied apartments in Garden City, Michigan
- 39no bedroom
- 5961 bedroom
- 5532 bedrooms
- 9113 bedrooms
- 274 bedrooms
- 75+ bedrooms
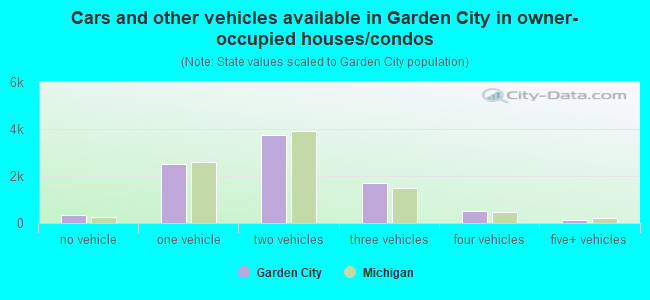
- Cars and other vehicles available in Garden City in owner-occupied houses/condos
- 340no vehicle
- 2,5121 vehicle
- 3,7542 vehicles
- 1,6913 vehicles
- 5244 vehicles
- 1175+ vehicles
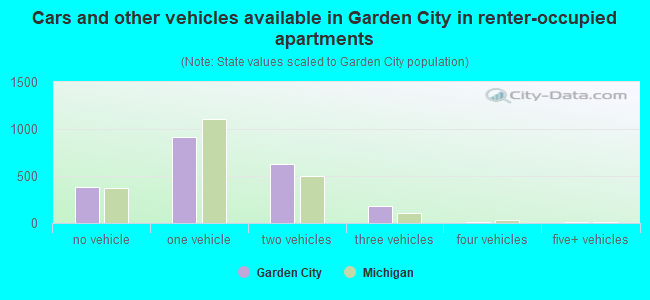
- Cars and other vehicles available in Garden City in renter-occupied apartments
- 382no vehicle
- 9141 vehicle
- 6302 vehicles
- 1833 vehicles
- 134 vehicles
- 125+ vehicles
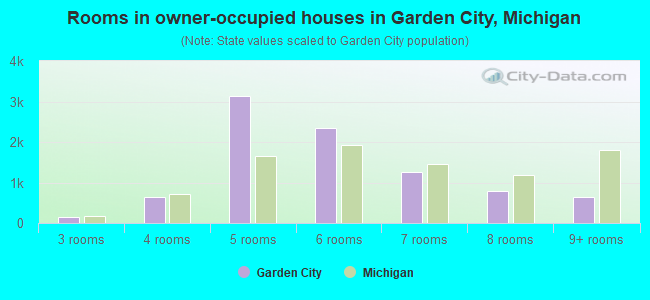
- Rooms in owner-occupied houses in Garden City, Michigan
- 01 room
- 52 rooms
- 1533 rooms
- 6304 rooms
- 3,1315 rooms
- 2,3396 rooms
- 1,2507 rooms
- 7978 rooms
- 6349+ rooms
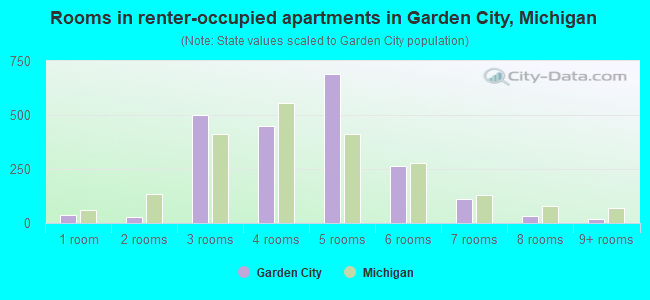
- Rooms in renter-occupied apartments in Garden City, Michigan
- 391 room
- 302 rooms
- 4993 rooms
- 4484 rooms
- 6895 rooms
- 2656 rooms
- 1117 rooms
- 318 rooms
- 209+ rooms
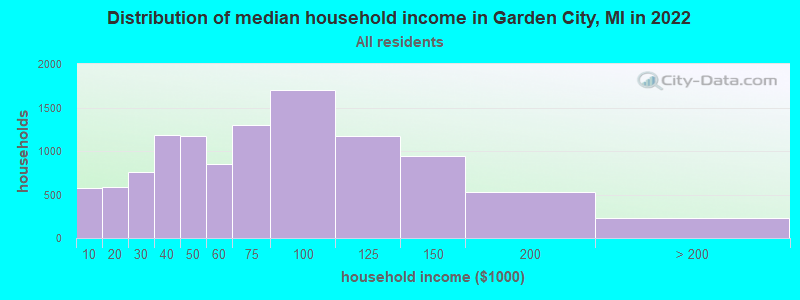
Garden City, MI household income distribution

- 577Less than $10,000
- 581$10,000 to $19,999
- 759$20,000 to $29,999
- 1,184$30,000 to $39,999
- 1,176$40,000 to $49,999
- 854$50,000 to $59,999
- 1,295$60,000 to $74,999
- 1,706$75,000 to $99,999
- 1,172$100,000 to $124,999
- 945$125,000 to $149,999
- 523$150,000 to $199,999
- 226$200,000 or more
Home value of owner - occupied houses in 2022 in Garden City, MI
-
- 78Less than $10,000
- 62$10,000 to $14,999
- 51$15,000 to $19,999
- 2$20,000 to $24,999
- 18$30,000 to $34,999
- 11$35,000 to $39,999
- 58$40,000 to $49,999
- 63$50,000 to $59,999
- 82$60,000 to $69,999
- 264$70,000 to $79,999
- 173$80,000 to $89,999
- 165$90,000 to $99,999
- 1,128$100,000 to $124,999
- 1,557$125,000 to $149,999
- 3,048$150,000 to $174,999
- 1,218$175,000 to $199,999
- 827$200,000 to $249,999
- 180$250,000 to $299,999
- 115$300,000 to $399,999
- 5$400,000 to $499,999
- 23$500,000 to $749,999
- 22$1,000,000 to $1,499,999
- 6$2,000,000 or more
Rent paid by renters in 2022 in Garden City, MI
-
- 22Less than $100
- 57$150 to $199
- 90$200 to $249
- 7$250 to $299
- 30$300 to $349
- 16$450 to $499
- 12$500 to $549
- 13$550 to $599
- 52$600 to $649
- 255$650 to $699
- 259$700 to $749
- 158$750 to $799
- 133$800 to $899
- 100$900 to $999
- 403$1,000 to $1,249
- 249$1,250 to $1,499
- 78$1,500 to $1,999
- 215No cash rent
Percentage of workers working in this county: 80.1%
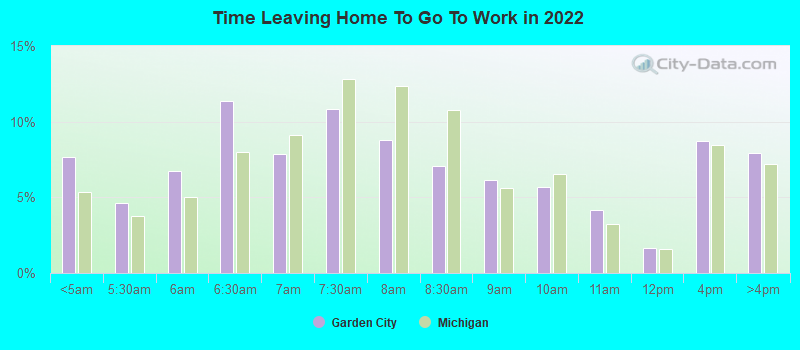
Number of people working at home: 1,126 (8.6% of all workers)
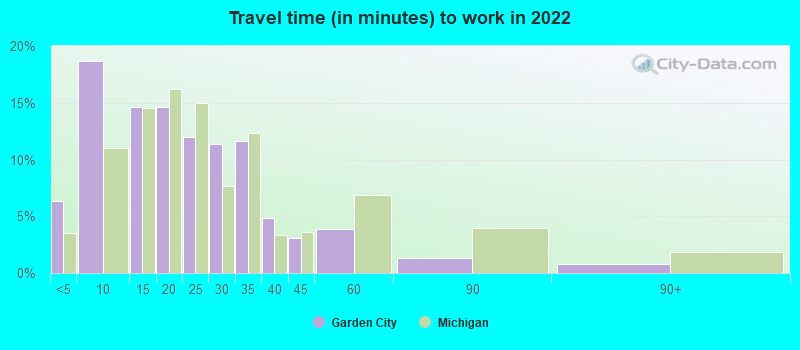
Travel time to work (commute)
- Less than 5 minutes: 274
- 5 to 9 minutes: 1,647
- 10 to 14 minutes: 1,086
- 15 to 19 minutes: 1,538
- 20 to 24 minutes: 2,148
- 25 to 29 minutes: 955
- 30 to 34 minutes: 1,623
- 35 to 39 minutes: 440
- 40 to 44 minutes: 597
- 45 to 59 minutes: 715
- 60 to 89 minutes: 425
- 90 or more minutes: 350
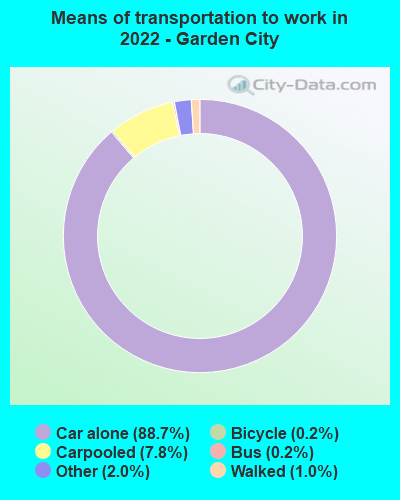
Means of transportation to work:
- Drove a car alone: 5,158 (75.0%)
- Carpooled: 449 (6.5%)
- Bus: 11 (0.2%)
- Taxi: 124 (1.8%)
- Bicycle: 15 (0.2%)
- Walked: 63 (0.9%)
- Worked at home: 1,126 (16.4%)
- Unemployment by race in 2022
- Unemployment rate for White non-Hispanic residents
- 4.8%Males
- 5.7%Females
- Unemployment rate for Black residents
- 7.5%Males
- 11.8%Females
- Unemployment rate for two or more race residents
- 0.9%Males
- 29.3%Females
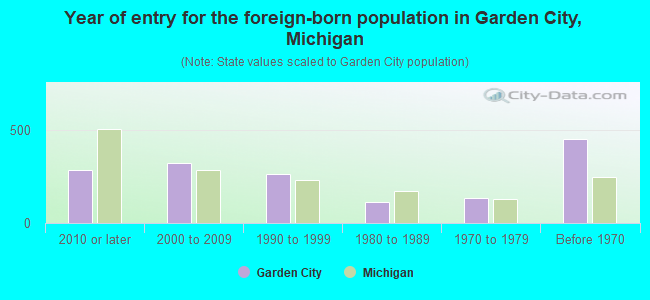
- Year of entry for the foreign-born population in Garden City, Michigan
- 2852010 or later
- 3232000 to 2009
- 2631990 to 1999
- 1141980 to 1989
- 1371970 to 1979
- 451Before 1970
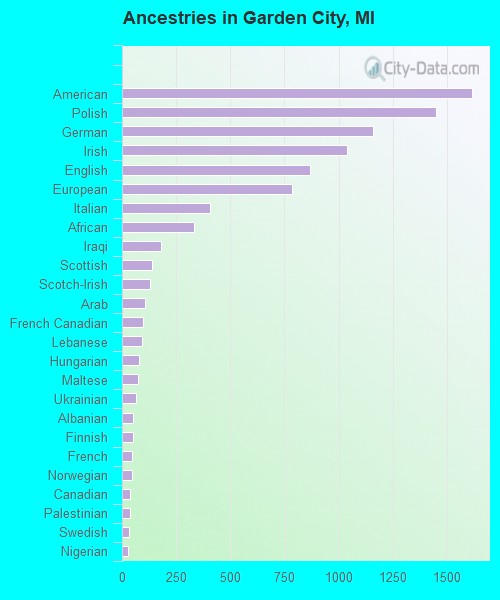
First ancestries reported:
- American: 1,614 (13.8%)
- Polish: 1,449 (12.4%)
- German: 1,158 (9.9%)
- Irish: 1,040 (8.9%)
- English: 870 (7.4%)
- European: 785 (6.7%)
- Italian: 408 (3.5%)
- African: 332 (2.8%)
- Iraqi: 180 (1.5%)
- Scottish: 139 (1.2%)
- Scotch-Irish: 127 (1.1%)
- Arab: 107 (0.9%)
- French Canadian: 96 (0.8%)
- Lebanese: 91 (0.8%)
- Hungarian: 77 (0.7%)
- Maltese: 74 (0.6%)
- Ukrainian: 64 (0.5%)
- Albanian: 50 (0.4%)
- Finnish: 49 (0.4%)
- French: 47 (0.4%)
- Norwegian: 45 (0.4%)
- Canadian: 36 (0.3%)
- Palestinian: 35 (0.3%)
- Swedish: 32 (0.3%)
- Nigerian: 30 (0.3%)
- Danish: 26 (0.2%)
- Romanian: 25 (0.2%)
- Armenian: 24 (0.2%)
- Dutch: 24 (0.2%)
- Yugoslavian: 24 (0.2%)
- Austrian: 19 (0.2%)
- Welsh: 17 (0.1%)
- Greek: 17 (0.1%)
- Slovene: 16 (0.1%)
- British: 16 (0.1%)
- Jordanian: 14 (0.1%)
- Czechoslovakian: 12 (0.1%)
- Northern European: 12 (0.1%)
- Syrian: 11 (0.09%)
- Lithuanian: 11 (0.09%)
- Israeli: 10 (0.09%)
- Brazilian: 10 (0.09%)
- Belgian: 8 (0.07%)
- Celtic: 8 (0.07%)
- Macedonian: 7 (0.06%)
- Scandinavian: 6 (0.05%)
- Russian: 5 (0.04%)
- Jamaican: 2 (0.02%)
Most common places of birth for foreign-born residents (%):
| Garden City: | 22.6% (262) |
| Michigan: | 8.1% (55,954) |
| Garden City: | 6.9% (80) |
| Michigan: | 2.8% (19,112) |
| Garden City: | 5.5% (64) |
| Michigan: | 1.9% (12,910) |
| Garden City: | 4.5% (52) |
| Michigan: | 2.3% (16,126) |
| Garden City: | 4.2% (49) |
| Michigan: | 0.2% (1,437) |
| Garden City: | 3.5% (41) |
| Michigan: | 1.6% (10,857) |
| Garden City: | 3.4% (40) |
| Michigan: | 10.9% (75,965) |
| Garden City: | 3.4% (39) |
| Michigan: | 11.1% (77,240) |
| Garden City: | 3.2% (37) |
| Michigan: | 5.0% (35,052) |
| Garden City: | 3.0% (35) |
| Michigan: | 3.7% (25,634) |
| Garden City: | 2.8% (33) |
| Michigan: | 3.1% (21,538) |
| Garden City: | 2.8% (32) |
| Michigan: | 0.9% (5,978) |
| Garden City: | 2.7% (31) |
| Michigan: | 4.9% (34,295) |
| Garden City: | 2.7% (31) |
| Michigan: | 0.7% (4,939) |
| Garden City: | 2.4% (28) |
| Michigan: | 1.2% (8,563) |
| Garden City: | 2.3% (27) |
| Michigan: | 0.8% (5,492) |
| Garden City: | 2.0% (23) |
| Michigan: | 0.2% (1,597) |
| Garden City: | 2.0% (23) |
| Michigan: | 0.2% (1,499) |
| Garden City: | 1.9% (22) |
| Michigan: | 0.6% (3,969) |
| Garden City: | 1.6% (19) |
| Michigan: | 0.9% (5,964) |
Place of birth for U.S.-born residents:
- This state: 22,818
- Other state: 2,749
- Northeast: 363
- Midwest: 618
- South: 1,171
- West: 625
91.7% of Garden City residents lived in the same house 1 years ago.
Out of people who lived in different houses, 44.5% lived in this county.
Out of people who lived in different counties, 82.6% lived in Michigan.
| Garden City: | 91.7% |
| State average: | 88.4% |
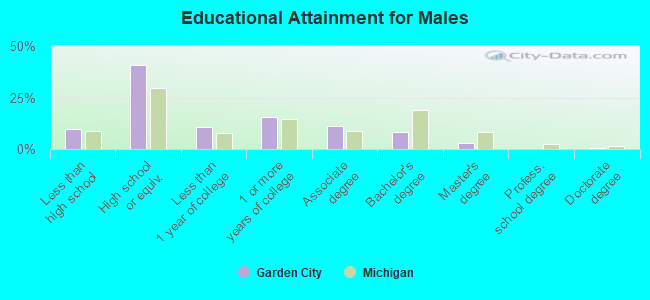
Education attainment for males 25 years and older:
- No schooling: 163
- Nursery to 4th grade: 0
- 5th and 6th grade: 0
- 7th and 8th grade: 52
- 9th grade: 49
- 10th grade: 134
- 11th grade: 236
- 12th grade, no diploma: 264
- High school graduate (or equivalency): 3,845
- Less than 1 year of college: 1,024
- Some college more than 1 year, no degree: 1,454
- Associate degree: 1,029
- Bachelor's degree: 774
- Master's degree: 295
- Professional school degree: 17
- Doctorate degree: 39
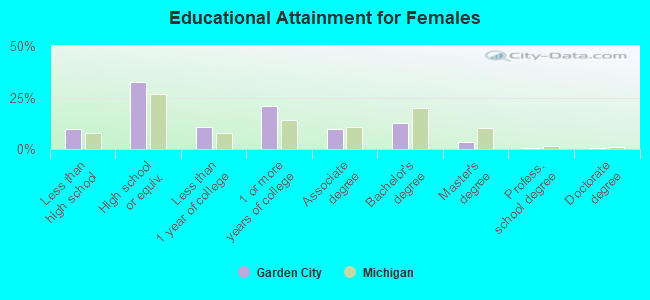
Education attainment for females 25 years and older:
- No schooling: 136
- Nursery to 4th grade: 27
- 5th and 6th grade: 23
- 7th and 8th grade: 61
- 9th grade: 147
- 10th grade: 139
- 11th grade: 113
- 12th grade, no diploma: 343
- High school graduate (or equivalency): 3,277
- Less than 1 year of college: 1,047
- Some college more than 1 year, no degree: 2,087
- Associate degree: 955
- Bachelor's degree: 1,249
- Master's degree: 351
- Professional school degree: 45
- Doctorate degree: 25
Housing units in structures:
- One, detached: 10,216
- One, attached: 54
- Two: 8
- 3 or 4: 58
- 5 to 9: 352
- 10 to 19: 329
- 20 to 49: 102
- 50 or more: 140
- Mobile homes: 41
Housing units lacking complete kitchen facilities in 2022: 0.3%
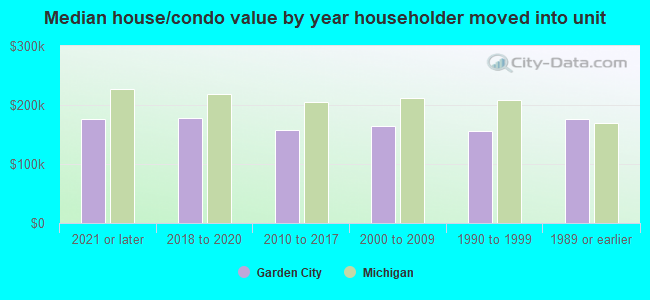
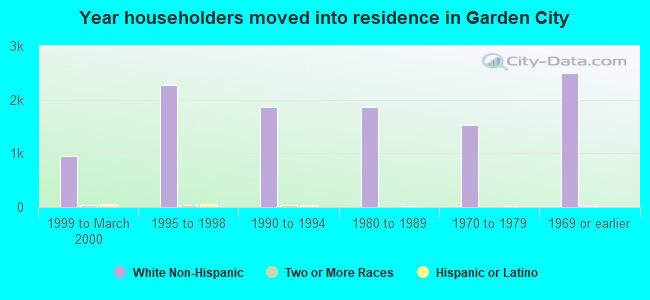
House/condo owner moved in on average 14 years ago
Renter moved in on average 5 years ago
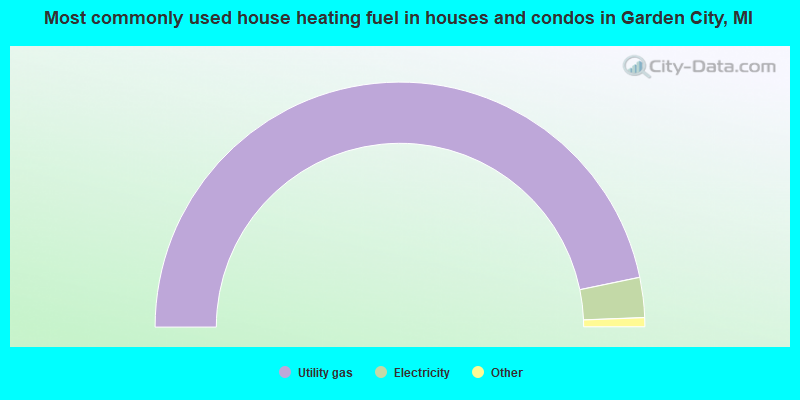
- 93.5%Utility gas
- 5.3%Electricity
- 0.9%Bottled, tank, or LP gas
- 0.1%No fuel used
- 0.1%Fuel oil, kerosene, etc.
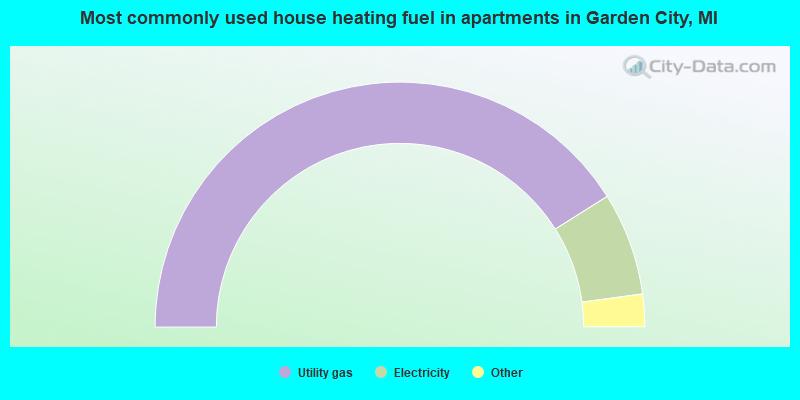
- 82.2%Utility gas
- 13.6%Electricity
- 2.3%No fuel used
- 1.0%Other fuel
- 0.9%Bottled, tank, or LP gas
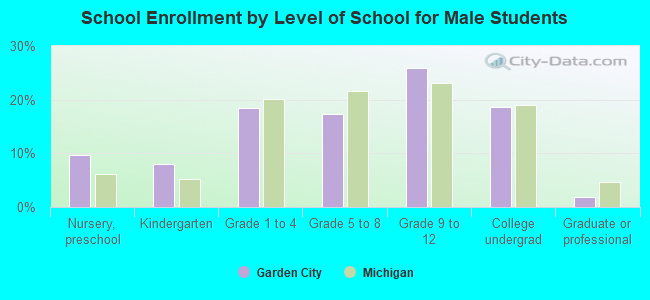
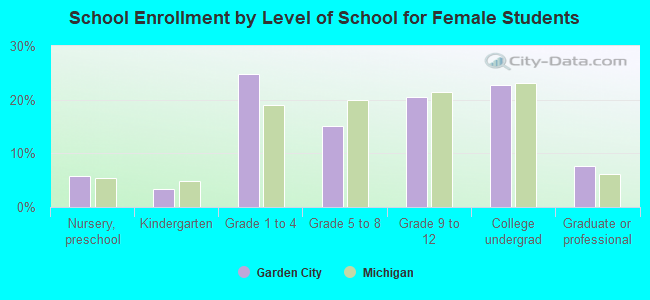
Private vs. public school enrollment:
| Here: | 15.6% |
| Michigan: | 12.4% |
| Here: | 10.8% |
| Michigan: | 9.8% |
| Here: | 8.7% |
| Michigan: | 14.9% |