Gastonia, NC (North Carolina) Houses and Residents
| Gastonia: | $272,200 |
| North Carolina: | $280,600 |
Mean price in 2022:
Detached houses: $297,004
Here: $297,004 State: $375,326 Townhouses or other attached units: $256,564
Here: $256,564 State: $317,935 In 2-unit structures: $161,260
Here: $161,260 State: $250,488 In 3-to-4-unit structures: $195,105
Here: $195,105 State: $254,939 In 5-or-more-unit structures: $69,030
Here: $69,030 State: $329,290 Mobile homes: $131,643
Here: $131,643 State: $124,933
Total population: 73,698 (Urban population: 65,564, Rural population: 734 (all nonfarm))
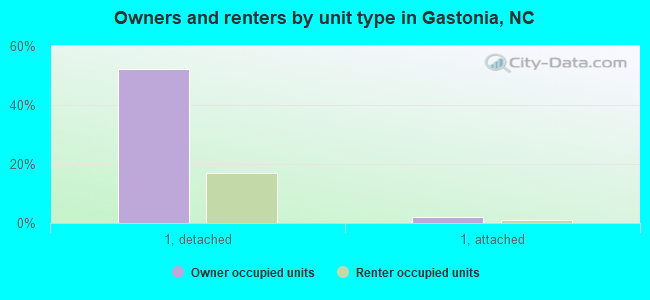
Houses: 36,861 (34,881 occupied: 20,107 owner occupied, 14,774 renter occupied)
| % of renters here: | 42% |
| State: | 33% |
Housing density: 800 houses/condos per square mile
Median price asked for vacant for-sale houses and condos in 2022: $301,373.
Median contract rent in 2022: $882 (lower quartile is $693, upper quartile is $1,076)
Median rent asked for vacant for-rent units in 2022: $488
Median gross rent in Gastonia, NC in 2022: $1,058
Housing units in Gastonia with a mortgage: 12,905 (1,369 second mortgage, 0 home equity loan, 1,215 both second mortgage and home equity loan)
Houses without a mortgage: 365
Median household income for houses/condos with a mortgage: $95,762
Median household income for apartments without a mortgage: $45,822
Median monthly housing costs: $1,060
Compare current foreclosures in Gastonia, NC:
| Photo | Address | Area | Beds / Baths | Price | Details |
|---|---|---|---|---|---|

|
#1
Balsam Ct
Gastonia, NC 28052
|
1,130 sq. feet
|
1 baths 3 beds |
show details | |

|
#2
Elizabeth Cir
Gastonia, NC 28054
|
768 sq. feet
|
1 baths 2 beds |
show details | |

|
#3
Norton Dr
Gastonia, NC 28052
|
- sq. feet
|
2 baths 3 beds |
show details | |

|
#4
Lauren Marie Ct
Gastonia, NC 28052
|
- sq. feet
|
2 baths 3 beds |
show details | |

|
#5
Wellman St
Gastonia, NC 28054
|
1,263 sq. feet
|
2 baths 3 beds |
show details | |

|
#6
Union New Hope Rd
Gastonia, NC 28056
|
2,376 sq. feet
|
4 baths 4 beds |
show details | |

|
#7
Shannon Bradley Rd
Gastonia, NC 28052
|
1,008 sq. feet
|
1 baths 4 beds |
show details | |

|
#8
Lewis Rd
Gastonia, NC 28052
|
1,620 sq. feet
|
2 baths 3 beds |
show details | |

|
#9
Country Meadows Dr
Gastonia, NC 28056
|
1,362 sq. feet
|
2 baths 3 beds |
show details | |

|
#10
Stoney Oaks Dr
Gastonia, NC 28052
|
1,680 sq. feet
|
2 baths 3 beds |
show details |
| Photo | Address | Area | Beds / Baths | Price | Details |
|---|---|---|---|---|---|

|
#11
Knollwood Dr
Gastonia, NC 28052
|
1,150 sq. feet
|
1 baths 3 beds |
show details | |

|
#12
Broadwater Ct
Gastonia, NC 28056
|
1,663 sq. feet
|
2 baths 4 beds |
show details | |

|
#13
Old Field Rd
Gastonia, NC 28056
|
1,428 sq. feet
|
1 baths 3 beds |
show details | |

|
#14
W 4th Ave
Gastonia, NC 28052
|
970 sq. feet
|
1 baths 2 beds |
show details | |

|
#15
Split Oak Trl
Gastonia, NC 28052
|
1,270 sq. feet
|
2 baths 3 beds |
show details | |

|
#16
Spencer Mountain Rd
Gastonia, NC 28054
|
1,266 sq. feet
|
1 baths 2 beds |
show details | |

|
#17
Linsbury Ct
Gastonia, NC 28056
|
2,094 sq. feet
|
2 baths 4 beds |
show details | |

|
#18
Copper Ridge Ct
Gastonia, NC 28056
|
3,072 sq. feet
|
2 baths 4 beds |
show details | |

|
#19
Sharon Ln
Gastonia, NC 28052
|
1,056 sq. feet
|
1 baths 2 beds |
show details | |

|
#20
Raindrops Rd
Gastonia, NC 28054
|
2,041 sq. feet
|
2 baths 4 beds |
show details |
| Photo | Address | Area | Beds / Baths | Price | Details |
|---|---|---|---|---|---|

|
#21
Eric Ct
Gastonia, NC 28052
|
1,325 sq. feet
|
1 baths 3 beds |
show details | |

|
#22
S Webb St
Gastonia, NC 28052
|
1,116 sq. feet
|
1 baths 3 beds |
show details | |

|
#23
Matthews Dr
Gastonia, NC 28052
|
1,420 sq. feet
|
1 baths 4 beds |
show details | |

|
#24
N Weldon St
Gastonia, NC 28052
|
1,144 sq. feet
|
1 baths 3 beds |
show details | |

|
#25
Wellman St
Gastonia, NC 28054
|
868 sq. feet
|
1 baths 3 beds |
show details | |

|
#26
Angus Dr
Gastonia, NC 28056
|
1,272 sq. feet
|
1 baths 3 beds |
show details | |

|
#27
Green Circle Dr
Gastonia, NC 28054
|
1,626 sq. feet
|
1 baths 3 beds |
show details | |

|
#28
Pompano Pl
Gastonia, NC 28056
|
1,370 sq. feet
|
2 baths 3 beds |
show details | |

|
#29
Jasin Dr
Gastonia, NC 28054
|
1,996 sq. feet
|
2 baths 4 beds |
show details | |

|
#30
Country Meadows Dr
Gastonia, NC 28056
|
1,276 sq. feet
|
2 baths 3 beds |
show details |
| Photo | Address | Area | Beds / Baths | Price | Details |
|---|---|---|---|---|---|

|
#31
Holiday Rd
Gastonia, NC 28054
|
2,016 sq. feet
|
2 baths 3 beds |
show details | |

|
#32
Hawk Ridge Dr
Gastonia, NC 28056
|
1,402 sq. feet
|
2 baths 3 beds |
show details | |

|
#33
N King St
Gastonia, NC 28052
|
1,304 sq. feet
|
1 baths 2 beds |
show details | |

|
#34
Doffin Ln
Gastonia, NC 28052
|
960 sq. feet
|
1 baths 3 beds |
show details | |

|
#35
Beechwood Cir
Gastonia, NC 28054
|
936 sq. feet
|
1 baths 2 beds |
show details | |

|
#36
Withers St
Gastonia, NC 28054
|
1,134 sq. feet
|
1 baths 1 beds |
show details | |

|
#37
Duncan Ln
Gastonia, NC 28056
|
1,296 sq. feet
|
2 baths 3 beds |
show details | |

|
#38
Pryor St
Gastonia, NC 28052
|
1,092 sq. feet
|
2 baths 3 beds |
show details | |

|
#39
Ebony Ave
Gastonia, NC 28054
|
1,765 sq. feet
|
2 baths 3 beds |
show details | |

|
#40
Venus Ave
Gastonia, NC 28052
|
1,000 sq. feet
|
2 baths 3 beds |
show details |
| Photo | Address | Area | Beds / Baths | Price | Details |
|---|---|---|---|---|---|

|
#41
Gelinda Ct
Gastonia, NC 28056
|
1,160 sq. feet
|
2 baths 3 beds |
show details | |

|
#42
Royalty Ct
Gastonia, NC 28054
|
1,664 sq. feet
|
2 baths 2 beds |
show details | |

|
#43
Starrland Dr
Gastonia, NC 28052
|
1,056 sq. feet
|
1 baths 3 beds |
show details | |

|
#44
Robinson Rd
Gastonia, NC 28056
|
1,616 sq. feet
|
2 baths 4 beds |
show details | |

|
#45
Pinehaven Dr
Gastonia, NC 28054
|
1,219 sq. feet
|
2 baths 4 beds |
show details | |

|
#46
Villard St
Gastonia, NC 28054
|
952 sq. feet
|
1 baths 2 beds |
show details | |

|
#47
Pine Ridge Dr
Gastonia, NC 28054
|
1,458 sq. feet
|
2 baths 3 beds |
show details | |

|
#48
Verde View Dr
Gastonia, NC 28056
|
1,080 sq. feet
|
2 baths 3 beds |
show details | |

|
#49
Kingston Dr
Gastonia, NC 28052
|
1,460 sq. feet
|
2 baths 3 beds |
show details | |

|
Check over 1 million property listings on Foreclosure.com!
|
browse all offers | |||

Latest news about housing in Gastonia, NC collected exclusively by city-data.com from local newspapers, TV, and radio stations

 | Anyone lived in River Wind Apartments in gastonia? (2 replies) |
| The Charlotte real estate market is crazy hot (13 replies) |
| Looking for a 1 bedroom between Gastonia and Charlotte, any suggestions? (3 replies) |
| Possibly moving to Gastonia (2 replies) |
| rental house, large dog (2 replies) |
| Looking for a home to rent in the S/E Gastonia, Cramerton, or Belmont area. (2 replies) |
Median year apartment built: 1979
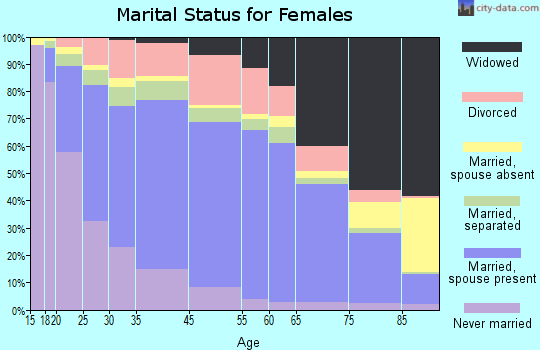
Household type by relationship:
Households: 82,666- Male householders: 14,668 (4,986 living alone), Female householders: 20,213 (5,539 living alone)
13,668 spouses (13,668 opposite-sex spouses), 2,043 unmarried partners, (2,043 opposite-sex unmarried partners), 20,079 children (19,854 natural, 0 adopted, 225 stepchildren), 4,223 grandchildren, 709 brothers or sisters, 390 parents, 0 foster children, 3,319 other relatives, 1,720 non-relatives
- In group quarters: 1,634
Size of family households: 10,166 2-persons, 6,802 3-persons, 2,874 4-persons, 1,330 5-persons, 190 6-persons, 543 7-or-more-persons.
Size of nonfamily households: 10,525 1-person, 1,728 2-persons, 698 3-persons, 25 4-persons.
7,286 married couples with children.
5,915 single-parent households (522 men, 5,393 women).
88.3% of residents of Gastonia speak English at home.
9.2% of residents speak Spanish at home (58% speak English very well, 25% speak English well, 13% speak English not well, 3% don't speak English at all).
1.1% of residents speak other Indo-European language at home (75% speak English very well, 20% speak English well, 4% speak English not well, 1% don't speak English at all).
0.8% of residents speak Asian or Pacific Island language at home (68% speak English very well, 11% speak English well, 21% speak English not well).
0.4% of residents speak other language at home (74% speak English very well, 8% speak English well, 18% speak English not well).
Foreign born population: 6,463 (7.8%)
(35.3% of them are naturalized citizens)
| Here: | 6.6 |
| State: | 6.4 |
| Here: | 4.3 |
| State: | 4.4 |
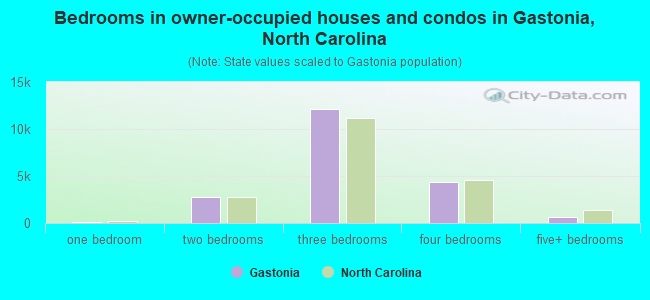
- Bedrooms in owner-occupied houses and condos in Gastonia, North Carolina
- 62no bedroom
- 671 bedroom
- 2,7872 bedrooms
- 12,1383 bedrooms
- 4,3874 bedrooms
- 6665+ bedrooms
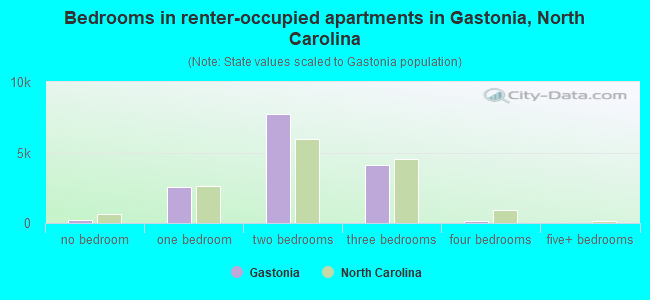
- Bedrooms in renter-occupied apartments in Gastonia, North Carolina
- 213no bedroom
- 2,5281 bedroom
- 7,7642 bedrooms
- 4,1203 bedrooms
- 1494 bedrooms
- 05+ bedrooms
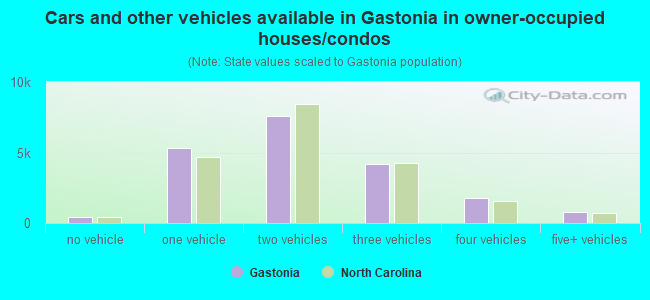
- Cars and other vehicles available in Gastonia in owner-occupied houses/condos
- 426no vehicle
- 5,3441 vehicle
- 7,5862 vehicles
- 4,2103 vehicles
- 1,7554 vehicles
- 7865+ vehicles
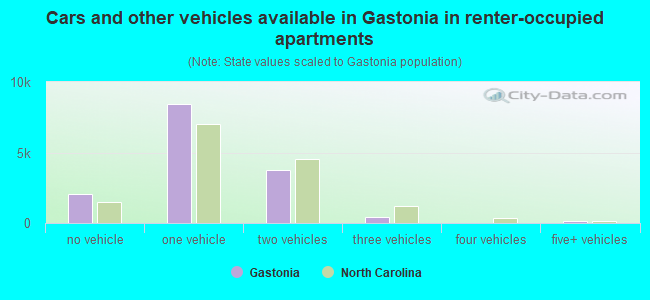
- Cars and other vehicles available in Gastonia in renter-occupied apartments
- 2,026no vehicle
- 8,4611 vehicle
- 3,7442 vehicles
- 4353 vehicles
- 04 vehicles
- 1085+ vehicles
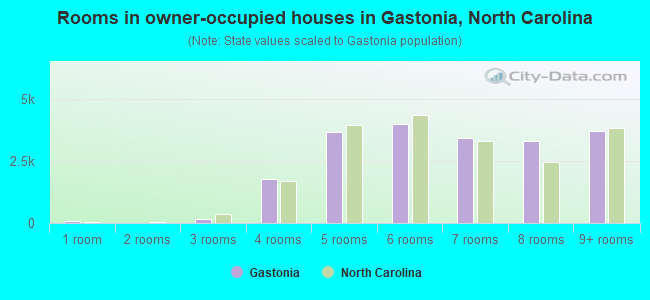
- Rooms in owner-occupied houses in Gastonia, North Carolina
- 621 room
- 02 rooms
- 1783 rooms
- 1,7824 rooms
- 3,6565 rooms
- 3,9836 rooms
- 3,4187 rooms
- 3,3298 rooms
- 3,6999+ rooms
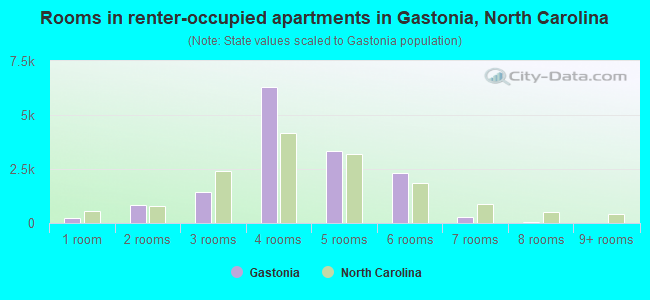
- Rooms in renter-occupied apartments in Gastonia, North Carolina
- 2131 room
- 8232 rooms
- 1,4533 rooms
- 6,2954 rooms
- 3,3395 rooms
- 2,3266 rooms
- 2567 rooms
- 698 rooms
- 09+ rooms
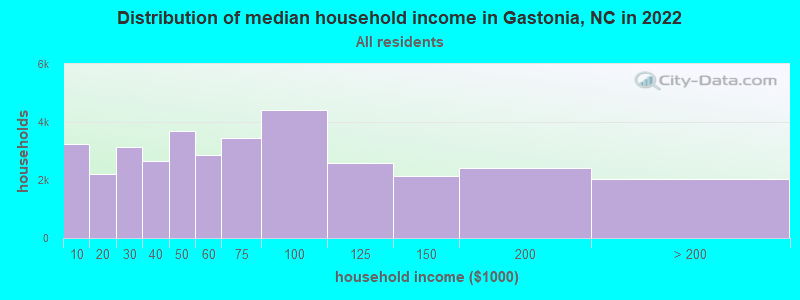
Gastonia, NC household income distribution

- 3,258Less than $10,000
- 2,200$10,000 to $19,999
- 3,154$20,000 to $29,999
- 2,651$30,000 to $39,999
- 3,691$40,000 to $49,999
- 2,855$50,000 to $59,999
- 3,463$60,000 to $74,999
- 4,427$75,000 to $99,999
- 2,586$100,000 to $124,999
- 2,121$125,000 to $149,999
- 2,426$150,000 to $199,999
- 2,049$200,000 or more
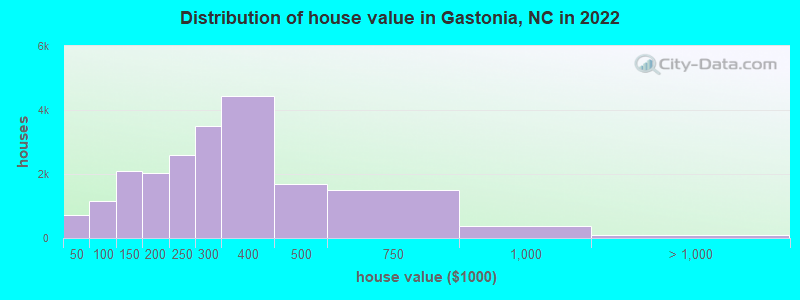
Home value of owner - occupied houses in 2022 in Gastonia, NC
-
- 193Less than $10,000
- 176$20,000 to $24,999
- 25$30,000 to $34,999
- 244$35,000 to $39,999
- 66$40,000 to $49,999
- 43$60,000 to $69,999
- 493$70,000 to $79,999
- 358$80,000 to $89,999
- 185$90,000 to $99,999
- 1,413$100,000 to $124,999
- 687$125,000 to $149,999
- 715$150,000 to $174,999
- 1,307$175,000 to $199,999
- 2,591$200,000 to $249,999
- 3,504$250,000 to $299,999
- 4,437$300,000 to $399,999
- 1,686$400,000 to $499,999
- 1,508$500,000 to $749,999
- 371$750,000 to $999,999
- 105$1,000,000 to $1,499,999
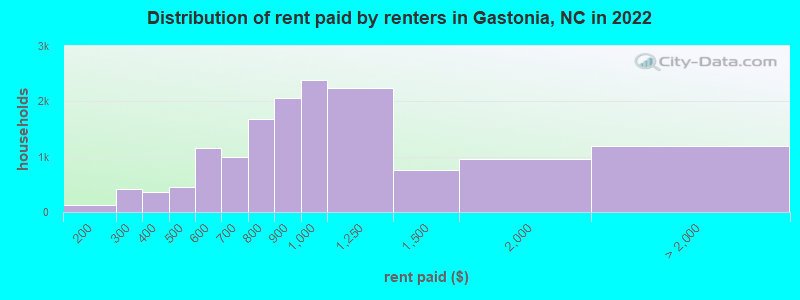
Rent paid by renters in 2022 in Gastonia, NC
-
- 123$150 to $199
- 421$250 to $299
- 126$300 to $349
- 232$350 to $399
- 290$400 to $449
- 154$450 to $499
- 350$500 to $549
- 808$550 to $599
- 568$600 to $649
- 425$650 to $699
- 489$700 to $749
- 1,199$750 to $799
- 2,053$800 to $899
- 2,390$900 to $999
- 2,242$1,000 to $1,249
- 758$1,250 to $1,499
- 958$1,500 to $1,999
- 67$2,500 to $2,999
- 91$3,000 to $3,499
- 1,030No cash rent
Percentage of workers working in this county: 64.5%
Number of people working at home: 4,703 (11.7% of all workers)
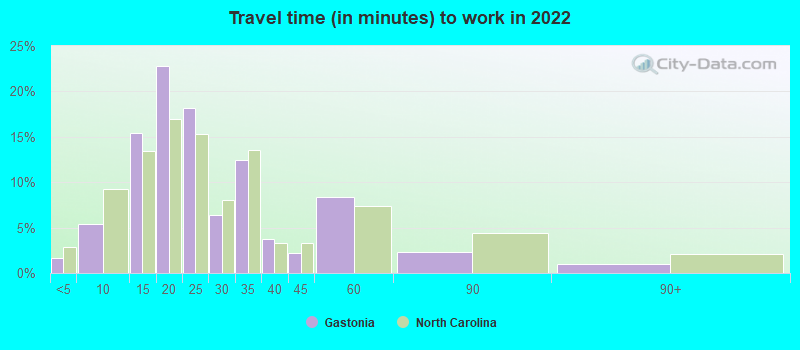
Travel time to work (commute)
- Less than 5 minutes: 384
- 5 to 9 minutes: 2,398
- 10 to 14 minutes: 5,459
- 15 to 19 minutes: 7,420
- 20 to 24 minutes: 4,216
- 25 to 29 minutes: 2,554
- 30 to 34 minutes: 3,624
- 35 to 39 minutes: 1,415
- 40 to 44 minutes: 1,367
- 45 to 59 minutes: 3,949
- 60 to 89 minutes: 1,656
- 90 or more minutes: 1,035
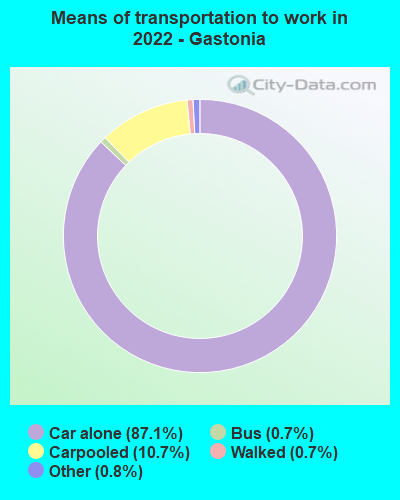
Means of transportation to work:
- Drove a car alone: 36,936 (74.9%)
- Carpooled: 5,259 (10.7%)
- Bus: 534 (1.1%)
- Long-distance train or commuter rail: 15 (0.0%)
- Taxi: 465 (0.9%)
- Bicycle: 8 (0.0%)
- Walked: 200 (0.4%)
- Worked at home: 4,703 (9.5%)
- Unemployment by race in 2022
- Unemployment rate for White non-Hispanic residents
- 2.7%Males
- Unemployment rate for Black residents
- 17.3%Males
- 4.2%Females
- Unemployment rate for American Indian and Alaska Native residents
- 2.3%Males
- Unemployment rate for other race residents
- 7.2%Males
- Unemployment rate for two or more race residents
- 6.2%Males
- 2.6%Females
- Unemployment rate for Hispanic or Latino residents
- 5.0%Males
- 3.7%Females
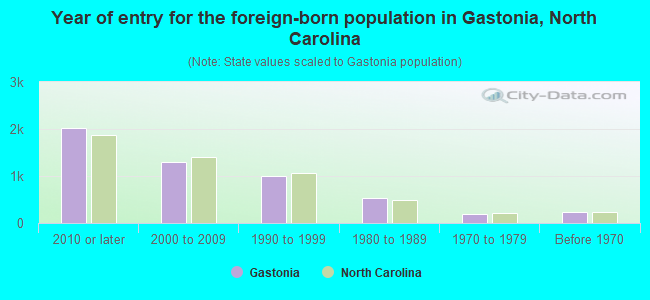
- Year of entry for the foreign-born population in Gastonia, North Carolina
- 2,0162010 or later
- 1,2982000 to 2009
- 9901990 to 1999
- 5271980 to 1989
- 1871970 to 1979
- 241Before 1970
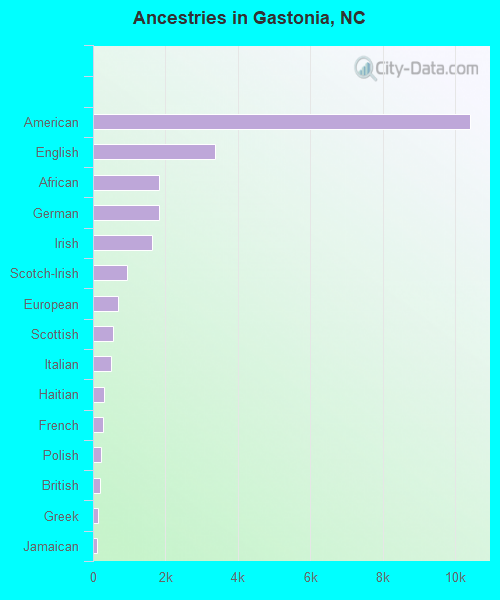
First ancestries reported:
- American: 10,416 (21.2%)
- English: 3,383 (6.9%)
- African: 1,814 (3.7%)
- German: 1,812 (3.7%)
- Irish: 1,633 (3.3%)
- Scotch-Irish: 931 (1.9%)
- European: 702 (1.4%)
- Scottish: 547 (1.1%)
- Italian: 503 (1.0%)
- Haitian: 296 (0.6%)
- French: 273 (0.6%)
- Polish: 230 (0.5%)
- British: 185 (0.4%)
- Greek: 133 (0.3%)
- Jamaican: 116 (0.2%)
- Dutch: 94 (0.2%)
- West Indian: 90 (0.2%)
- Northern European: 87 (0.2%)
- Trinidadian and Tobagonian: 78 (0.2%)
- Bulgarian: 61 (0.1%)
- Swedish: 59 (0.1%)
- Bahamian: 54 (0.1%)
- Norwegian: 50 (0.1%)
- Turkish: 44 (0.09%)
- Guyanese: 38 (0.08%)
- Russian: 37 (0.08%)
- Slovak: 35 (0.07%)
- Hungarian: 34 (0.07%)
- Eastern European: 33 (0.07%)
- Kenyan: 33 (0.07%)
- Welsh: 33 (0.07%)
- French Canadian: 30 (0.06%)
- Jordanian: 29 (0.06%)
- Afghan: 25 (0.05%)
- Ghanaian: 24 (0.05%)
- Scandinavian: 21 (0.04%)
- Israeli: 14 (0.03%)
- Egyptian: 11 (0.02%)
- Canadian: 9 (0.02%)
- Austrian: 8 (0.02%)
- Czech: 8 (0.02%)
- Portuguese: 7 (0.01%)
- Moroccan: 7 (0.01%)
- Lithuanian: 7 (0.01%)
- Belgian: 6 (0.01%)
- Swiss: 6 (0.01%)
- Australian: 6 (0.01%)
Most common places of birth for foreign-born residents (%):
| Gastonia: | 22.4% (1,256) |
| North Carolina: | 24.7% (214,776) |
| Gastonia: | 20.5% (1,151) |
| North Carolina: | 2.1% (18,275) |
| Gastonia: | 7.4% (414) |
| North Carolina: | 3.8% (33,379) |
| Gastonia: | 3.0% (171) |
| North Carolina: | 0.4% (3,587) |
| Gastonia: | 3.0% (169) |
| North Carolina: | 4.7% (40,707) |
| Gastonia: | 2.9% (161) |
| North Carolina: | 0.3% (2,274) |
| Gastonia: | 2.6% (148) |
| North Carolina: | 9.3% (80,594) |
| Gastonia: | 2.6% (146) |
| North Carolina: | 0.6% (5,018) |
| Gastonia: | 2.4% (137) |
| North Carolina: | 1.3% (11,419) |
| Gastonia: | 2.4% (133) |
| North Carolina: | 1.2% (10,140) |
| Gastonia: | 2.2% (124) |
| North Carolina: | 2.9% (24,965) |
| Gastonia: | 2.2% (123) |
| North Carolina: | 2.4% (20,695) |
| Gastonia: | 1.7% (96) |
| North Carolina: | 1.7% (15,135) |
| Gastonia: | 1.6% (92) |
| North Carolina: | 0.4% (3,607) |
| Gastonia: | 1.5% (85) |
| North Carolina: | 0.5% (4,128) |
Place of birth for U.S.-born residents:
- This state: 51,208
- Other state: 23,770
- Northeast: 6,498
- Midwest: 4,463
- South: 10,933
- West: 1,876
88.1% of Gastonia residents lived in the same house 1 years ago.
Out of people who lived in different houses, 29.7% lived in this county.
Out of people who lived in different counties, 65.5% lived in North Carolina.
| Gastonia: | 88.1% |
| State average: | 87.3% |
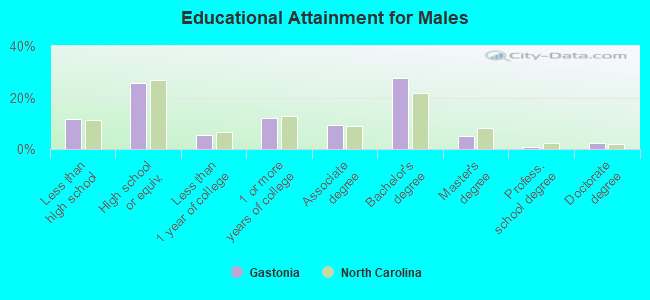
Education attainment for males 25 years and older:
- No schooling: 251
- Nursery to 4th grade: 271
- 5th and 6th grade: 355
- 7th and 8th grade: 226
- 9th grade: 86
- 10th grade: 1,264
- 11th grade: 380
- 12th grade, no diploma: 331
- High school graduate (or equivalency): 6,874
- Less than 1 year of college: 1,412
- Some college more than 1 year, no degree: 3,221
- Associate degree: 2,458
- Bachelor's degree: 7,357
- Master's degree: 1,363
- Professional school degree: 245
- Doctorate degree: 620
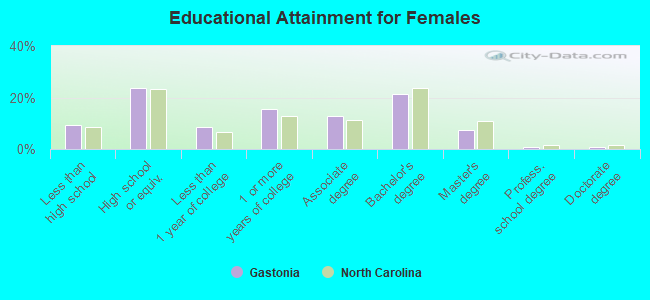
Education attainment for females 25 years and older:
- No schooling: 139
- Nursery to 4th grade: 156
- 5th and 6th grade: 111
- 7th and 8th grade: 218
- 9th grade: 512
- 10th grade: 721
- 11th grade: 826
- 12th grade, no diploma: 35
- High school graduate (or equivalency): 6,879
- Less than 1 year of college: 2,520
- Some college more than 1 year, no degree: 4,480
- Associate degree: 3,751
- Bachelor's degree: 6,170
- Master's degree: 2,095
- Professional school degree: 227
- Doctorate degree: 219
Housing units in structures:
- One, detached: 24,947
- One, attached: 1,082
- Two: 412
- 3 or 4: 2,991
- 5 to 9: 2,262
- 10 to 19: 2,656
- 20 to 49: 314
- 50 or more: 1,068
- Mobile homes: 1,129
Median worth of mobile homes: $106,600
Housing units lacking complete kitchen facilities in 2022: 1.7%
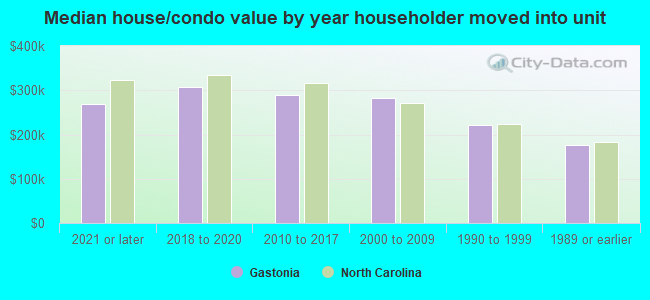
House/condo owner moved in on average 9 years ago
Renter moved in on average 3 years ago
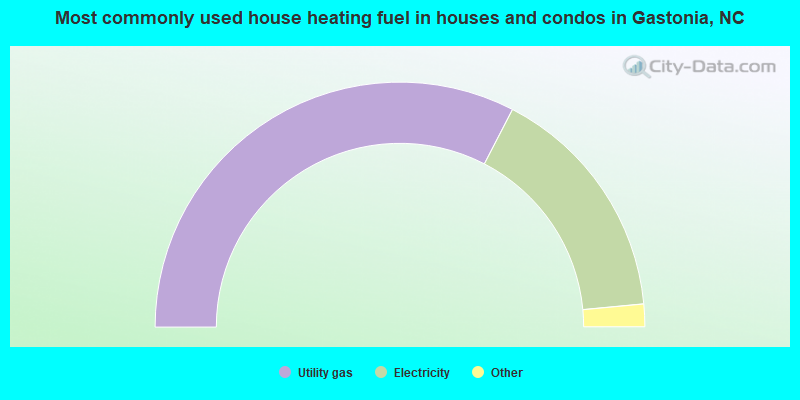
- 65.2%Utility gas
- 31.8%Electricity
- 1.4%Bottled, tank, or LP gas
- 0.8%Fuel oil, kerosene, etc.
- 0.5%No fuel used
- 0.3%Other fuel

- 66.7%Electricity
- 30.7%Utility gas
- 1.4%Bottled, tank, or LP gas
- 0.9%No fuel used
- 0.2%Fuel oil, kerosene, etc.
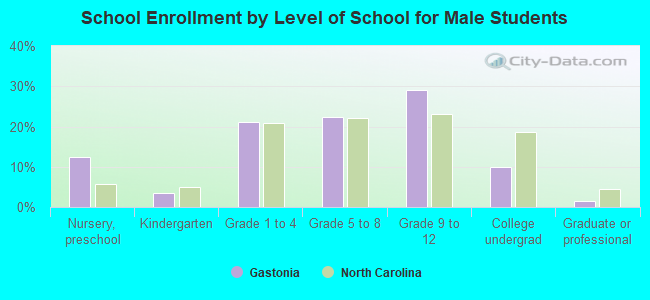
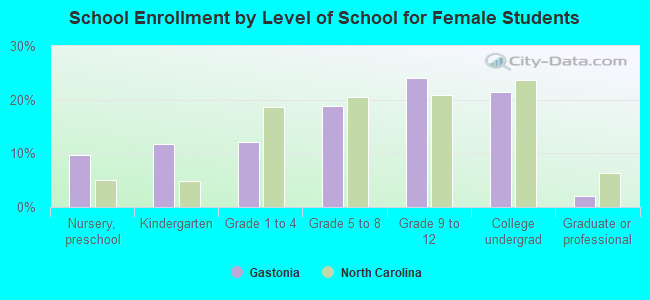
Private vs. public school enrollment:
| Here: | 11.2% |
| North Carolina: | 13.8% |
| Here: | 14.5% |
| North Carolina: | 11.9% |
| Here: | 20.3% |
| North Carolina: | 19.3% |