Grants Pass, OR (Oregon) Houses and Residents
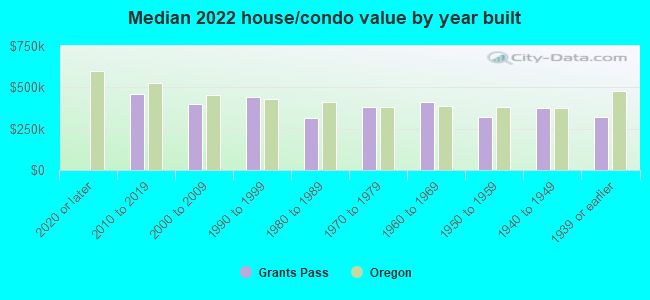
| Grants Pass: | $380,921 |
| Oregon: | $475,600 |
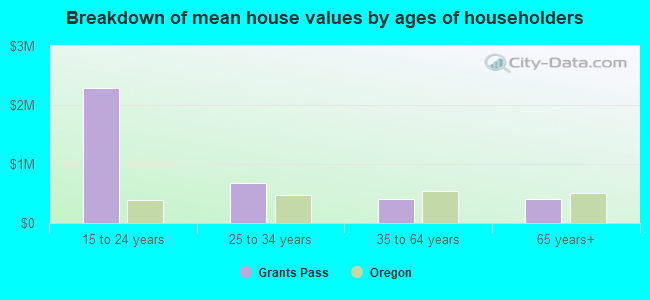
Mean price in 2022:
Detached houses: $378,476
Here: $378,476 State: $562,872 Townhouses or other attached units: $293,529
Here: $293,529 State: $463,029 In 2-unit structures: $3,134,123
Here: $3,134,123 State: $505,105 In 5-or-more-unit structures: $3,684,654
Here: $3,684,654 State: $420,389 Mobile homes: $109,538
Here: $109,538 State: $214,044
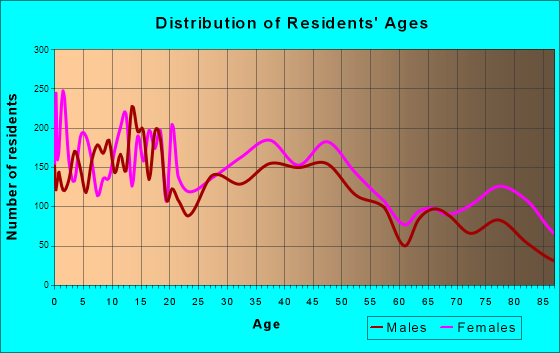
Total population: 35,272 (Urban population: 22,789 (all inside urban clusters), Rural population: 76 (all nonfarm))
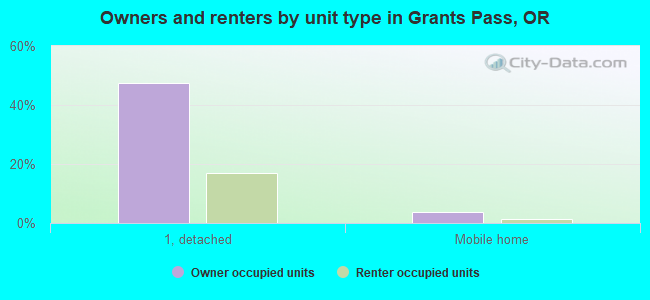
Houses: 17,496 (16,732 occupied: 9,191 owner occupied, 7,475 renter occupied)
| % of renters here: | 45% |
| State: | 37% |
Housing density: 2,307 houses/condos per square mile
Median price asked for vacant for-sale houses and condos in 2022: $972,906.
Median contract rent in 2022: $963 (lower quartile is $831, upper quartile is $1,503)
Median rent asked for vacant for-rent units in 2022: $2,224
Median gross rent in Grants Pass, OR in 2022: $1,127
Housing units in Grants Pass with a mortgage: 6,029 (741 second mortgage, 0 home equity loan, 729 both second mortgage and home equity loan)
Houses without a mortgage: 131
Median household income for houses/condos with a mortgage: $80,707
Median household income for apartments without a mortgage: $42,340
Median monthly housing costs: $1,209
Compare current foreclosures in Grants Pass, OR:
| Photo | Address | Area | Beds / Baths | Price | Details |
|---|---|---|---|---|---|

|
#1
Plumtree Ln
Grants Pass, OR 97526
|
1,512 sq. feet
|
2 baths 3 beds |
show details | |

|
#2
SW Bridge St
Grants Pass, OR 97526
|
1,207 sq. feet
|
2 baths 3 beds |
show details | |

|
#3
SW Oak St
Grants Pass, OR 97526
|
1,048 sq. feet
|
1 baths 1 beds |
show details | |

|
#4
Schroeder Ln
Grants Pass, OR 97527
|
2,467 sq. feet
|
1 baths 1 beds |
show details | |

|
#5
Harbeck Rd
Grants Pass, OR 97527
|
2,145 sq. feet
|
3 baths 6 beds |
show details | |

|
#6
Summit Loop
Grants Pass, OR 97527
|
1,804 sq. feet
|
2 baths 3 beds |
show details | |

|
#7
Laubach Ln
Grants Pass, OR 97526
|
990 sq. feet
|
1 baths 2 beds |
show details | |

|
#8
Tami Rd
Grants Pass, OR 97526
|
1,128 sq. feet
|
2 baths 3 beds |
show details | |

|
#9
Leonard Rd # B
Grants Pass, OR 97527
|
1,824 sq. feet
|
2 baths 2 beds |
show details | |

|
#10
Lower River Rd
Grants Pass, OR 97526
|
1,252 sq. feet
|
2 baths 3 beds |
show details |
| Photo | Address | Area | Beds / Baths | Price | Details |
|---|---|---|---|---|---|

|
#11
Kokanee Ln
Grants Pass, OR 97527
|
1,438 sq. feet
|
2 baths 2 beds |
show details | |

|
#12
Tami Rd
Grants Pass, OR 97526
|
1,200 sq. feet
|
2 baths 3 beds |
show details | |

|
#13
Pyle Dr
Grants Pass, OR 97527
|
888 sq. feet
|
1 baths 2 beds |
show details | |

|
#14
Merlin Rd
Grants Pass, OR 97526
|
3,607 sq. feet
|
2 baths 7 beds |
show details | |

|
#15
SW Juniper Dr
Grants Pass, OR 97526
|
1,248 sq. feet
|
1 baths 3 beds |
show details | |

|
#16
Teel Ln
Grants Pass, OR 97527
|
1,743 sq. feet
|
2 baths 3 beds |
show details | |

|
#17
SE Herrick Ln
Grants Pass, OR 97526
|
1,402 sq. feet
|
1 baths 3 beds |
show details | |

|
#18
Summit Loop
Grants Pass, OR 97527
|
1,482 sq. feet
|
2 baths 3 beds |
show details | |

|
#19
SE Clarey Ave
Grants Pass, OR 97526
|
945 sq. feet
|
1 baths 2 beds |
show details | |

|
#20
NE Sunset Ln
Grants Pass, OR 97526
|
1,973 sq. feet
|
3 baths 3 beds |
show details |
| Photo | Address | Area | Beds / Baths | Price | Details |
|---|---|---|---|---|---|

|
#21
Angler Ln
Grants Pass, OR 97527
|
1,342 sq. feet
|
2 baths 3 beds |
show details | |

|
#22
Fish Hatchery Rd
Grants Pass, OR 97527
|
1,812 sq. feet
|
2 baths 2 beds |
show details | |

|
#23
Cheslock Rd
Grants Pass, OR 97527
|
1,286 sq. feet
|
1 baths 1 beds |
show details | |

|
#24
SE Ashley Pl
Grants Pass, OR 97526
|
1,106 sq. feet
|
1 baths 2 beds |
show details | |

|
#25
Lower River Rd
Grants Pass, OR 97526
|
1,942 sq. feet
|
1 baths 3 beds |
show details | |

|
#26
SE Clarey Ave
Grants Pass, OR 97526
|
1,052 sq. feet
|
1 baths 3 beds |
show details | |

|
#27
Robinson Rd
Grants Pass, OR 97527
|
2,077 sq. feet
|
2 baths 3 beds |
show details | |

|
#28
Allenwood Dr
Grants Pass, OR 97527
|
1,322 sq. feet
|
2 baths 3 beds |
show details | |

|
#29
Redwood Hwy
Grants Pass, OR 97527
|
1,884 sq. feet
|
1 baths 1 beds |
show details | |

|
#30
Linda Lee Ln
Grants Pass, OR 97527
|
1,972 sq. feet
|
3 baths 3 beds |
show details |
| Photo | Address | Area | Beds / Baths | Price | Details |
|---|---|---|---|---|---|

|
#31
NE 12th St
Grants Pass, OR 97526
|
1,339 sq. feet
|
1 baths 3 beds |
show details | |

|
#32
SW Burgess St
Grants Pass, OR 97526
|
960 sq. feet
|
1 baths 2 beds |
show details | |

|
#33
Mountain View Pl
Grants Pass, OR 97527
|
4,523 sq. feet
|
3 baths 3 beds |
show details | |

|
#34
SW Bridge St Apt D
Grants Pass, OR 97526
|
- sq. feet
|
1 baths 1 beds |
show details | |

|
#35
Mount Baldy Rd
Grants Pass, OR 97527
|
2,080 sq. feet
|
2 baths 4 beds |
show details | |

|
#36
Plummer Ave
Grants Pass, OR 97527
|
2,205 sq. feet
|
2 baths 4 beds |
show details | |

|
#37
SW David Dr
Grants Pass, OR 97527
|
1,560 sq. feet
|
2 baths 3 beds |
show details | |

|
#38
Galaxy Way
Grants Pass, OR 97527
|
1,316 sq. feet
|
2 baths 3 beds |
show details | |

|
#39
NE Oregon Ave
Grants Pass, OR 97526
|
1,084 sq. feet
|
1 baths 3 beds |
show details | |

|
#40
Lower River Rd
Grants Pass, OR 97526
|
1,794 sq. feet
|
1 baths 3 beds |
show details |
| Photo | Address | Area | Beds / Baths | Price | Details |
|---|---|---|---|---|---|

|
#41
Plumtree Ln
Grants Pass, OR 97526
|
1,504 sq. feet
|
1 baths 3 beds |
show details | |

|
#42
Williams Hwy
Grants Pass, OR 97527
|
1,308 sq. feet
|
2 baths 2 beds |
show details | |

|
#43
NW 3rd St
Grants Pass, OR 97526
|
2,469 sq. feet
|
2 baths 3 beds |
show details | |

|
#44
Virginia Ln
Grants Pass, OR 97527
|
1,488 sq. feet
|
2 baths 3 beds |
show details | |

|
#45
Lower River Rd
Grants Pass, OR 97526
|
1,192 sq. feet
|
1 baths 2 beds |
show details | |

|
#46
Leonard Rd
Grants Pass, OR 97527
|
1,172 sq. feet
|
1 baths 3 beds |
show details | |

|
#47
Redwood Ave
Grants Pass, OR 97527
|
1,238 sq. feet
|
1 baths 3 beds |
show details | |

|
#48
New Hope Rd
Grants Pass, OR 97527
|
2,061 sq. feet
|
3 baths 4 beds |
show details | |

|
#49
Lower River Rd # B
Grants Pass, OR 97526
|
1,760 sq. feet
|
2 baths 3 beds |
show details | |

|
Check over 1 million property listings on Foreclosure.com!
|
browse all offers | |||


 | Apartments or Townhomes for rent in Grants Pass Oregon (0 replies) |
| House swap in Grants Pass to Arizona (35 replies) |
| Moving Family Medford or Grants Pass?? (65 replies) |
| Grants Pass Oregon/ similar places (38 replies) |
| "For Sale" homes unsold...for a while. Why? (24 replies) |
| RV Parks in Medford, Ashland, Grants Pass area (4 replies) |
Median year apartment built: 1980
Household type by relationship:
Households: 39,013- Male householders: 6,863 (2,030 living alone), Female householders: 9,561 (2,875 living alone)
6,745 spouses (6,697 opposite-sex spouses), 1,549 unmarried partners, (1,495 opposite-sex unmarried partners), 10,004 children (8,897 natural, 525 adopted, 582 stepchildren), 477 grandchildren, 346 brothers or sisters, 386 parents, 85 foster children, 420 other relatives, 1,437 non-relatives
- In group quarters: 1,133
Size of family households: 4,341 2-persons, 2,562 3-persons, 1,699 4-persons, 698 5-persons, 240 6-persons, 122 7-or-more-persons.
Size of nonfamily households: 5,477 1-person, 1,248 2-persons, 88 3-persons, 47 6-persons.
4,660 married couples with children.
2,649 single-parent households (612 men, 2,037 women).
95.1% of residents of Grants Pass speak English at home.
3.9% of residents speak Spanish at home (62% speak English very well, 18% speak English well, 17% speak English not well, 2% don't speak English at all).
0.3% of residents speak other Indo-European language at home (100% speak English very well).
0.7% of residents speak Asian or Pacific Island language at home (36% speak English very well, 48% speak English well, 5% speak English not well, 11% don't speak English at all).
Foreign born population: 1,212 (3.1%)
(64.9% of them are naturalized citizens)
| Here: | 5.8 |
| State: | 6.2 |
| Here: | 4.5 |
| State: | 4.0 |
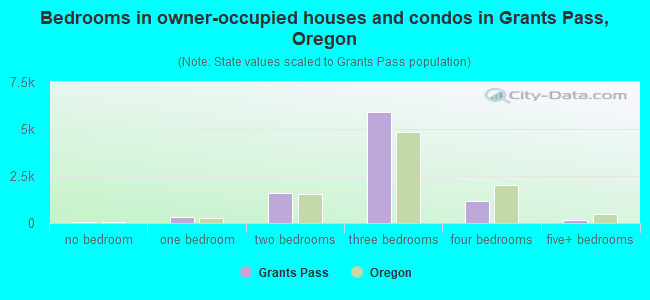
- Bedrooms in owner-occupied houses and condos in Grants Pass, Oregon
- 51no bedroom
- 3001 bedroom
- 1,6072 bedrooms
- 5,8863 bedrooms
- 1,1654 bedrooms
- 1825+ bedrooms
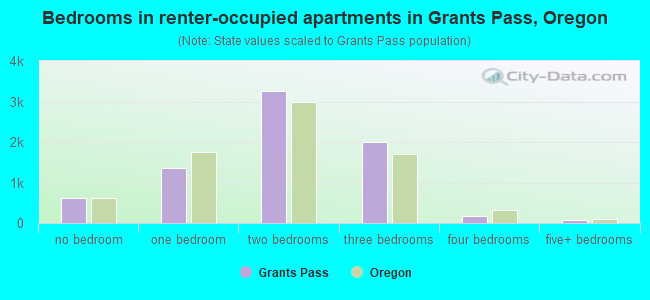
- Bedrooms in renter-occupied apartments in Grants Pass, Oregon
- 629no bedroom
- 1,3561 bedroom
- 3,2592 bedrooms
- 1,9923 bedrooms
- 1704 bedrooms
- 705+ bedrooms
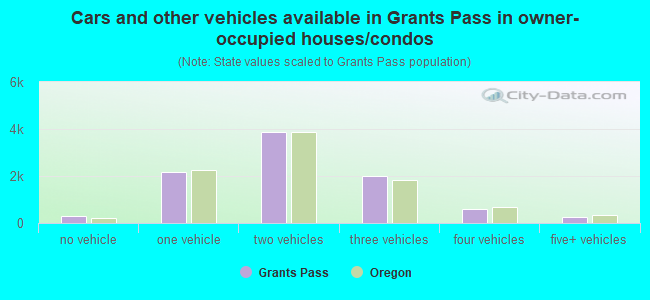
- Cars and other vehicles available in Grants Pass in owner-occupied houses/condos
- 299no vehicle
- 2,1891 vehicle
- 3,8892 vehicles
- 1,9833 vehicles
- 5954 vehicles
- 2365+ vehicles
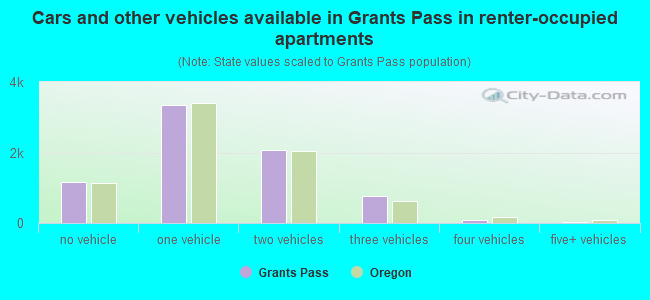
- Cars and other vehicles available in Grants Pass in renter-occupied apartments
- 1,174no vehicle
- 3,3541 vehicle
- 2,0612 vehicles
- 7733 vehicles
- 824 vehicles
- 325+ vehicles
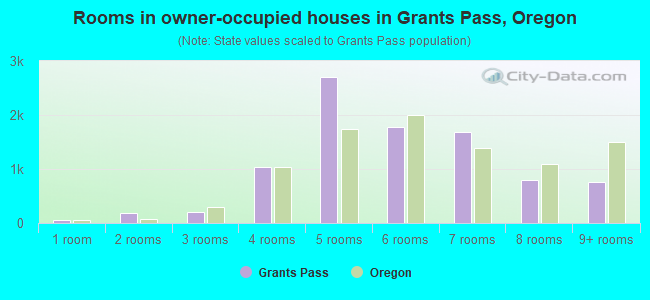
- Rooms in owner-occupied houses in Grants Pass, Oregon
- 511 room
- 1832 rooms
- 1973 rooms
- 1,0304 rooms
- 2,7125 rooms
- 1,7796 rooms
- 1,6817 rooms
- 8048 rooms
- 7549+ rooms
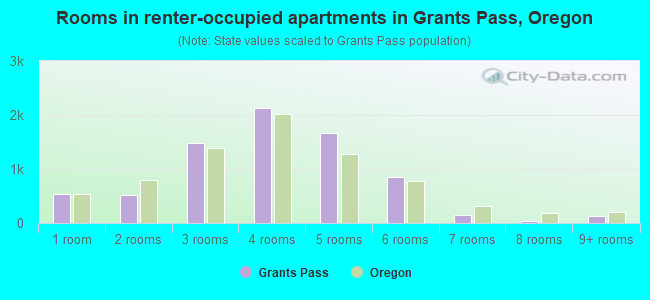
- Rooms in renter-occupied apartments in Grants Pass, Oregon
- 5391 room
- 5142 rooms
- 1,4773 rooms
- 2,1314 rooms
- 1,6695 rooms
- 8476 rooms
- 1397 rooms
- 288 rooms
- 1329+ rooms
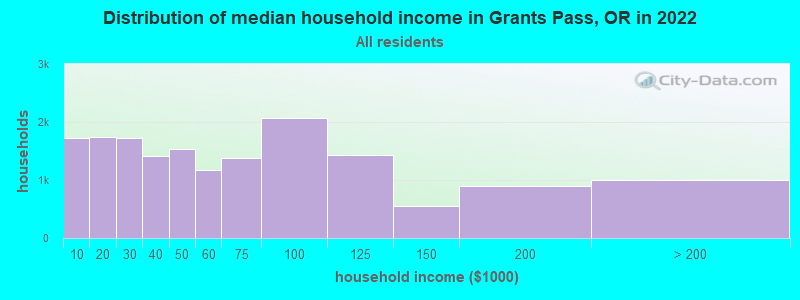
Grants Pass, OR household income distribution

- 1,721Less than $10,000
- 1,745$10,000 to $19,999
- 1,725$20,000 to $29,999
- 1,416$30,000 to $39,999
- 1,535$40,000 to $49,999
- 1,174$50,000 to $59,999
- 1,375$60,000 to $74,999
- 2,074$75,000 to $99,999
- 1,424$100,000 to $124,999
- 545$125,000 to $149,999
- 898$150,000 to $199,999
- 992$200,000 or more
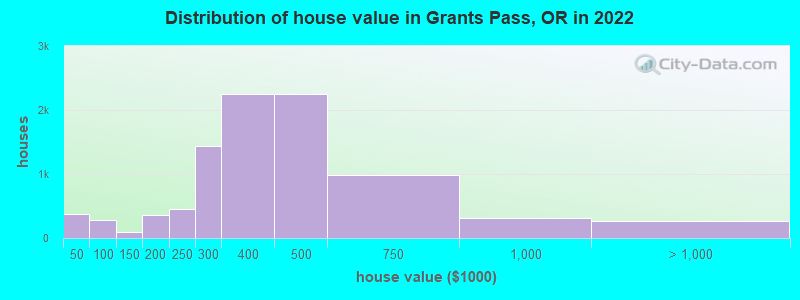
Home value of owner - occupied houses in 2022 in Grants Pass, OR
-
- 80Less than $10,000
- 94$10,000 to $14,999
- 31$20,000 to $24,999
- 45$25,000 to $29,999
- 18$30,000 to $34,999
- 44$35,000 to $39,999
- 54$40,000 to $49,999
- 111$50,000 to $59,999
- 66$60,000 to $69,999
- 14$70,000 to $79,999
- 27$80,000 to $89,999
- 7$90,000 to $99,999
- 60$100,000 to $124,999
- 30$125,000 to $149,999
- 256$150,000 to $174,999
- 104$175,000 to $199,999
- 454$200,000 to $249,999
- 1,436$250,000 to $299,999
- 2,245$300,000 to $399,999
- 2,255$400,000 to $499,999
- 991$500,000 to $749,999
- 304$750,000 to $999,999
- 127$1,000,000 to $1,499,999
- 132$2,000,000 or more
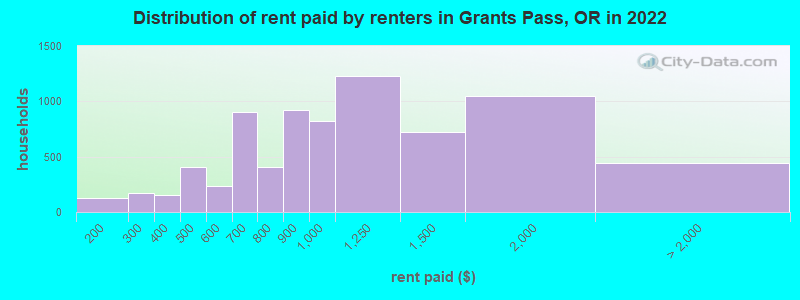
Rent paid by renters in 2022 in Grants Pass, OR
-
- 49$100 to $149
- 78$150 to $199
- 113$200 to $249
- 54$250 to $299
- 87$300 to $349
- 70$350 to $399
- 289$400 to $449
- 114$450 to $499
- 99$500 to $549
- 135$550 to $599
- 306$600 to $649
- 597$650 to $699
- 200$700 to $749
- 202$750 to $799
- 919$800 to $899
- 819$900 to $999
- 1,232$1,000 to $1,249
- 719$1,250 to $1,499
- 1,051$1,500 to $1,999
- 96$2,000 to $2,499
- 14$2,500 to $2,999
- 53$3,500 or more
- 274No cash rent
Percentage of workers working in this county: 85.0%
Number of people working at home: 1,867 (11.1% of all workers)
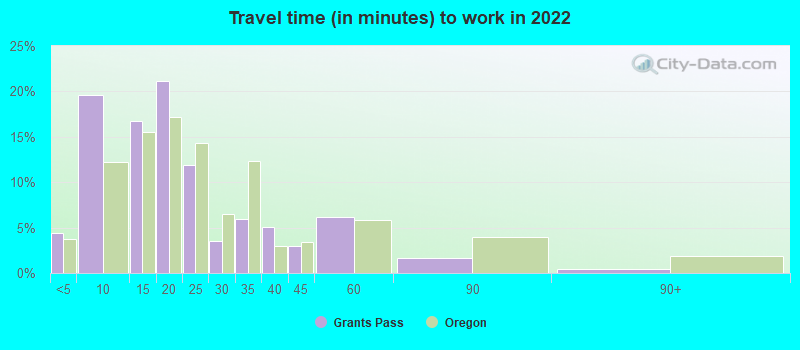
Travel time to work (commute)
- Less than 5 minutes: 767
- 5 to 9 minutes: 3,939
- 10 to 14 minutes: 3,157
- 15 to 19 minutes: 2,195
- 20 to 24 minutes: 930
- 25 to 29 minutes: 418
- 30 to 34 minutes: 793
- 35 to 39 minutes: 371
- 40 to 44 minutes: 260
- 45 to 59 minutes: 964
- 60 to 89 minutes: 117
- 90 or more minutes: 193
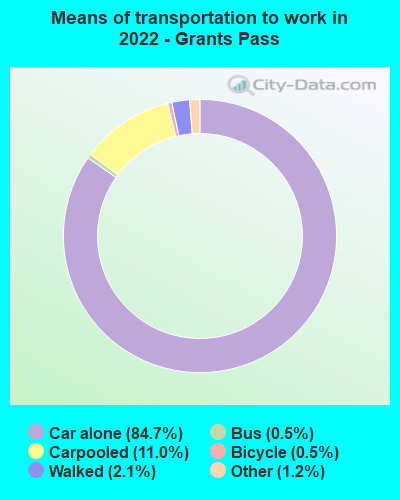
Means of transportation to work:
- Drove a car alone: 18,542 (76.3%)
- Carpooled: 2,445 (10.1%)
- Bus: 81 (0.3%)
- Taxi: 295 (1.2%)
- Bicycle: 90 (0.4%)
- Walked: 517 (2.1%)
- Worked at home: 1,867 (7.7%)
- Unemployment by race in 2022
- Unemployment rate for White non-Hispanic residents
- 6.1%Males
- 2.2%Females
- Unemployment rate for American Indian and Alaska Native residents
- 11.4%Males
- Unemployment rate for two or more race residents
- 5.6%Males
- 8.2%Females
- Unemployment rate for Hispanic or Latino residents
- 11.0%Males
- 15.9%Females
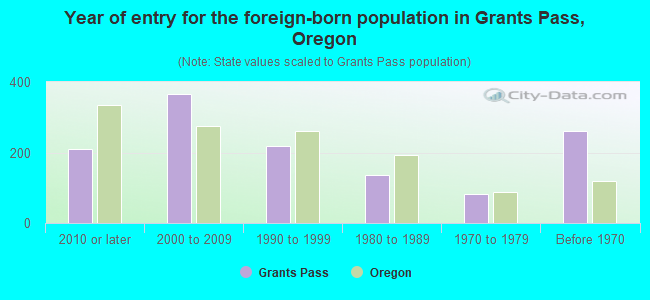
- Year of entry for the foreign-born population in Grants Pass, Oregon
- 2102010 or later
- 3672000 to 2009
- 2191990 to 1999
- 1371980 to 1989
- 821970 to 1979
- 262Before 1970
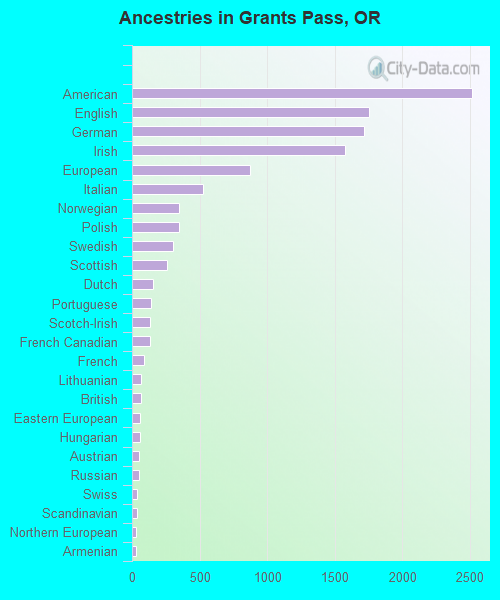
First ancestries reported:
- American: 2,518 (16.5%)
- English: 1,758 (11.5%)
- German: 1,721 (11.3%)
- Irish: 1,576 (10.3%)
- European: 873 (5.7%)
- Italian: 527 (3.5%)
- Norwegian: 349 (2.3%)
- Polish: 347 (2.3%)
- Swedish: 302 (2.0%)
- Scottish: 260 (1.7%)
- Dutch: 158 (1.0%)
- Portuguese: 138 (0.9%)
- Scotch-Irish: 135 (0.9%)
- French Canadian: 135 (0.9%)
- French: 91 (0.6%)
- Lithuanian: 64 (0.4%)
- British: 63 (0.4%)
- Eastern European: 61 (0.4%)
- Hungarian: 58 (0.4%)
- Austrian: 52 (0.3%)
- Russian: 49 (0.3%)
- Swiss: 36 (0.2%)
- Scandinavian: 35 (0.2%)
- Northern European: 32 (0.2%)
- Armenian: 32 (0.2%)
- Danish: 27 (0.2%)
- Welsh: 21 (0.1%)
- African: 20 (0.1%)
- Canadian: 17 (0.1%)
- Finnish: 14 (0.09%)
- Estonian: 12 (0.08%)
- Lebanese: 11 (0.07%)
- Romanian: 8 (0.05%)
- Czech: 6 (0.04%)
- South African: 5 (0.03%)
Most common places of birth for foreign-born residents (%):
| Grants Pass: | 35.5% (536) |
| Oregon: | 33.9% (140,109) |
| Grants Pass: | 12.7% (191) |
| Oregon: | 1.5% (6,313) |
| Grants Pass: | 9.3% (140) |
| Oregon: | 3.7% (15,229) |
| Grants Pass: | 5.4% (81) |
| Oregon: | 1.9% (8,005) |
| Grants Pass: | 4.4% (66) |
| Oregon: | 0.3% (1,089) |
| Grants Pass: | 3.4% (51) |
| Oregon: | 0.8% (3,218) |
| Grants Pass: | 2.7% (41) |
| Oregon: | 5.5% (22,563) |
| Grants Pass: | 2.6% (39) |
| Oregon: | 3.5% (14,530) |
| Grants Pass: | 2.3% (35) |
| Oregon: | 0.2% (943) |
| Grants Pass: | 2.2% (33) |
| Oregon: | 0.5% (2,055) |
| Grants Pass: | 2.1% (31) |
| Oregon: | 0.8% (3,190) |
| Grants Pass: | 1.9% (29) |
| Oregon: | 0.4% (1,625) |
| Grants Pass: | 1.6% (24) |
| Oregon: | 0.5% (2,096) |
| Grants Pass: | 1.6% (24) |
| Oregon: | 1.0% (4,175) |
Place of birth for U.S.-born residents:
- This state: 15,798
- Other state: 21,437
- Northeast: 779
- Midwest: 2,900
- South: 1,931
- West: 15,791
83.4% of Grants Pass residents lived in the same house 1 years ago.
Out of people who lived in different houses, 33.0% lived in this county.
Out of people who lived in different counties, 60.6% lived in Oregon.
| Grants Pass: | 83.4% |
| State average: | 85.5% |
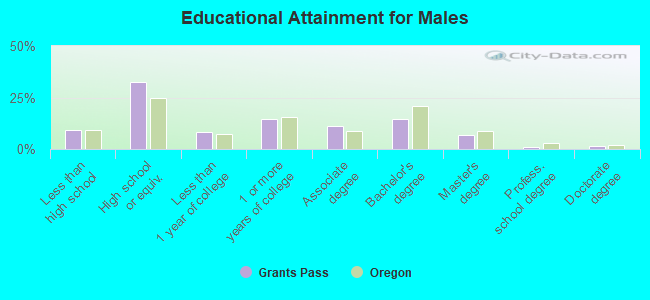
Education attainment for males 25 years and older:
- No schooling: 70
- Nursery to 4th grade: 0
- 5th and 6th grade: 73
- 7th and 8th grade: 78
- 9th grade: 182
- 10th grade: 153
- 11th grade: 249
- 12th grade, no diploma: 392
- High school graduate (or equivalency): 4,257
- Less than 1 year of college: 1,051
- Some college more than 1 year, no degree: 1,893
- Associate degree: 1,455
- Bachelor's degree: 1,877
- Master's degree: 901
- Professional school degree: 151
- Doctorate degree: 211
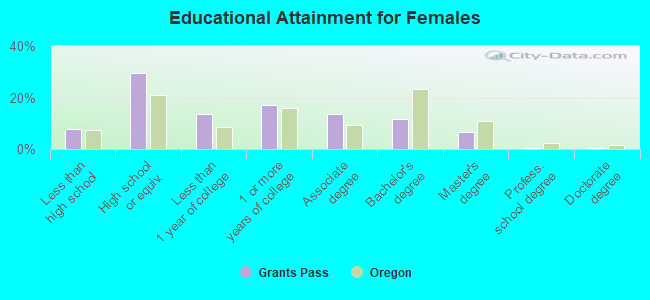
Education attainment for females 25 years and older:
- No schooling: 94
- Nursery to 4th grade: 38
- 5th and 6th grade: 100
- 7th and 8th grade: 108
- 9th grade: 73
- 10th grade: 60
- 11th grade: 539
- 12th grade, no diploma: 139
- High school graduate (or equivalency): 4,335
- Less than 1 year of college: 2,008
- Some college more than 1 year, no degree: 2,530
- Associate degree: 1,987
- Bachelor's degree: 1,697
- Master's degree: 949
- Professional school degree: 36
- Doctorate degree: 53
Housing units in structures:
- One, detached: 11,880
- One, attached: 1,077
- Two: 604
- 3 or 4: 1,176
- 5 to 9: 555
- 10 to 19: 245
- 20 to 49: 370
- 50 or more: 493
- Mobile homes: 882
- Boats, RVs, vans, etc.: 209
Median worth of mobile homes: $57,435
Housing units lacking complete kitchen facilities in 2022: 2.4%
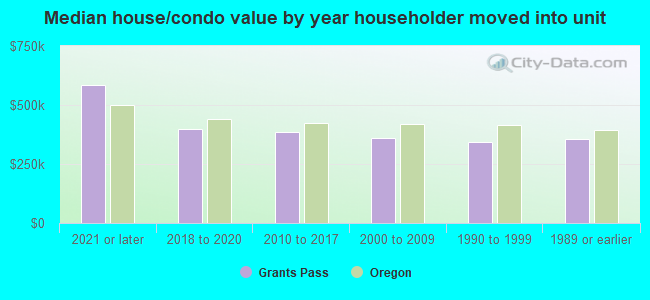
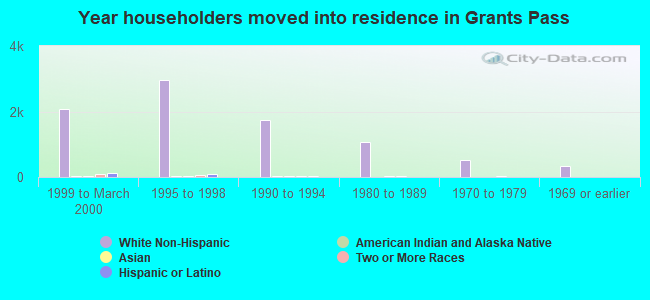
House/condo owner moved in on average 10 years ago
Renter moved in on average 1 years ago
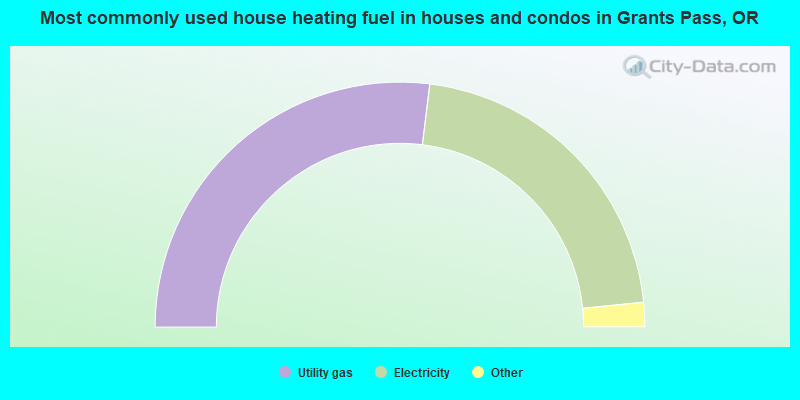
- 53.9%Utility gas
- 42.9%Electricity
- 1.0%Wood
- 1.0%Bottled, tank, or LP gas
- 0.8%Fuel oil, kerosene, etc.
- 0.2%Other fuel
- 0.2%No fuel used
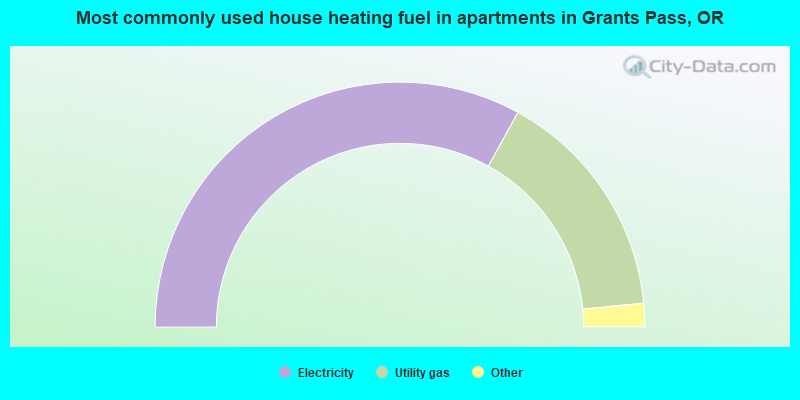
- 66.0%Electricity
- 30.9%Utility gas
- 1.3%Wood
- 1.0%No fuel used
- 0.4%Fuel oil, kerosene, etc.
- 0.2%Bottled, tank, or LP gas
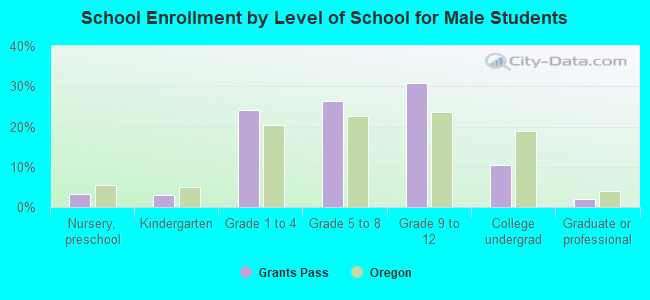
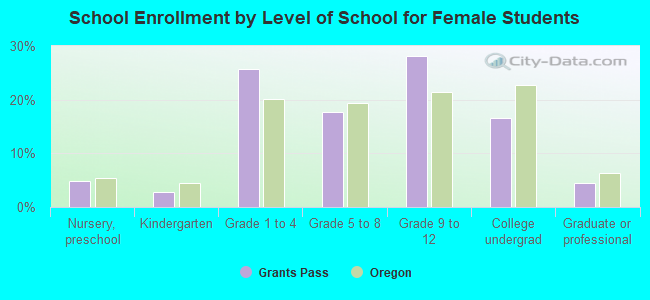
Private vs. public school enrollment:
| Here: | 16.2% |
| Oregon: | 13.7% |
| Here: | 8.8% |
| Oregon: | 8.8% |
| Here: | 28.6% |
| Oregon: | 17.7% |