Housing density: 184 houses/condos per square mile
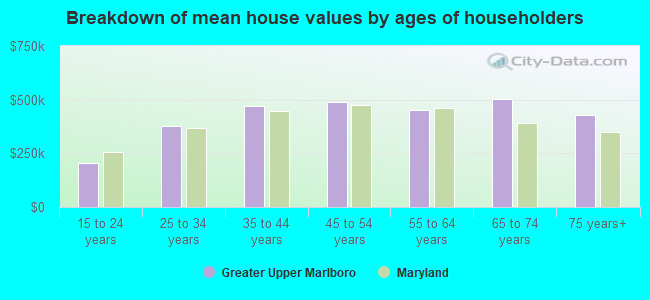
Median price asked for vacant for-sale houses and condos in 2022 in this county: $422,373.
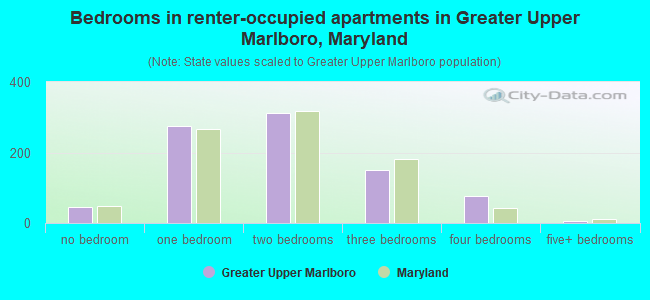
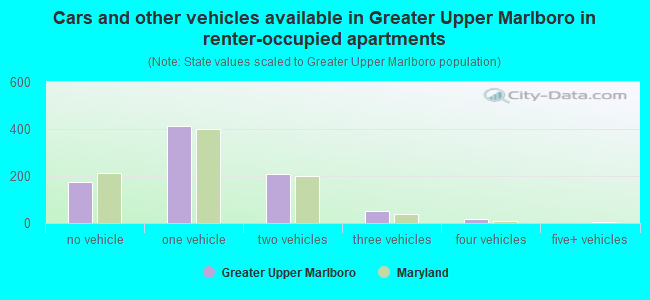
Median contract rent in 2022: $1,945 (lower quartile is $1,010, upper quartile is over $2,000)
Median rent asked for vacant for-rent units in 2022: $2,078
Median gross rent in Greater Upper Marlboro, MD in 2022: over $2,000
Housing units in Greater Upper Marlboro with a mortgage: 4,789 (567 second mortgage, 561 home equity loan, 35 both second mortgage and home equity loan) Houses without a mortgage: 333
Compare current foreclosures near Greater Upper Marlboro, MD:
In family households: 710,220 (114,456 male householders, 89,064 female householders)
122,000 spouses, 253,142 children (236,469 natural, 5,681 adopted, 10,992 stepchildren), 29,677 grandchildren, 18,092 brothers or sisters, 12,087 parents, foster children, 29,298 other relatives, 35,579 non-relatives
In nonfamily households: 133,872 (44,509 male householders (32,938 living alone)), 56,013 female householders (46,437 living alone)), 33,350 nonrelatives
In group quarters: 19,328 (4,283 institutionalized population)
114,918 married couples with children.
64,724 single-parent households (11,519 men, 53,205 women).
93.8% of residents of Greater Upper Marlboro speak English at home.
3.2% of residents speak Spanish at home (67% speak English very well, 22% speak English well, 9% speak English not well, 2% don't speak English at all).
1.7% of residents speak other Indo-European language at home (61% speak English very well, 24% speak English well, 15% speak English not well).
0.6% of residents speak Asian or Pacific Island language at home (69% speak English very well, 31% speak English well).
0.7% of residents speak other language at home (94% speak English very well, 6% speak English well).
Foreign born population: 1,596 (7.2%)
(82.1% of them are naturalized citizens)
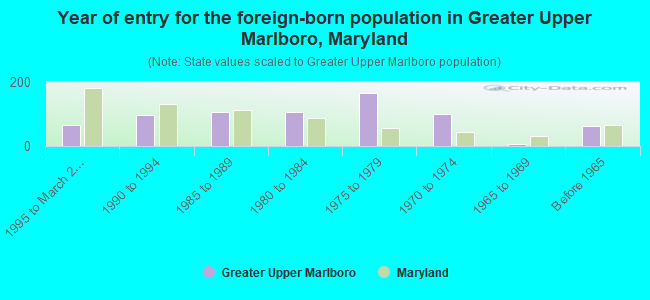
Year of entry for the foreign-born population in Greater Upper Marlboro, Maryland
651995 to March 2000
961990 to 1994
1051985 to 1989
1051980 to 1984
1651975 to 1979
1011970 to 1974
71965 to 1969
63Before 1965
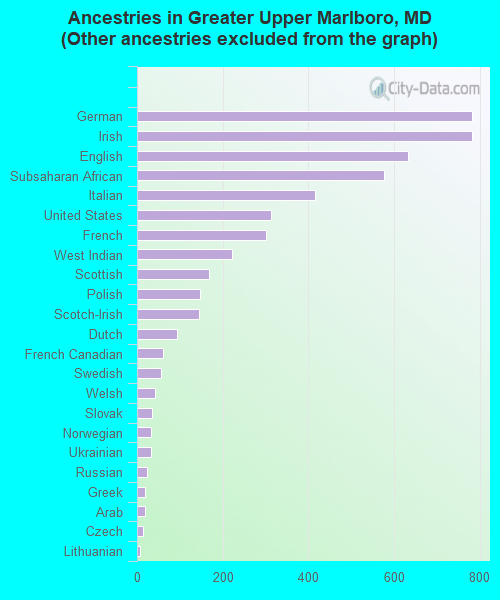
First ancestries reported:
Other: 12,036 (71.0%)
German: 783 (4.6%)
Irish: 783 (4.6%)
English: 633 (3.7%)
Subsaharan African: 576 (3.4%)
Italian: 415 (2.4%)
United States: 312 (1.8%)
French: 302 (1.8%)
West Indian: 223 (1.3%)
Scottish: 169 (1.0%)
Polish: 146 (0.9%)
Scotch-Irish: 144 (0.8%)
Dutch: 93 (0.5%)
French Canadian: 60 (0.4%)
Swedish: 56 (0.3%)
Welsh: 43 (0.3%)
Slovak: 34 (0.2%)
Norwegian: 33 (0.2%)
Ukrainian: 32 (0.2%)
Russian: 24 (0.1%)
Greek: 19 (0.1%)
Arab: 18 (0.1%)
Czech: 15 (0.09%)
Lithuanian: 8 (0.05%)
Swiss: 6 (0.04%)
Most common places of birth for foreign-born residents (%):
Philippines
Greater Upper Marlboro:
15.4% (109)
Maryland:
4.1% (21,007)
Jamaica
Greater Upper Marlboro:
10.5% (74)
Maryland:
3.7% (18,988)
Panama
Greater Upper Marlboro:
8.2% (58)
Maryland:
0.5% (2,850)
Nigeria
Greater Upper Marlboro:
6.4% (45)
Maryland:
2.9% (15,071)
Other Western Africa
Greater Upper Marlboro:
5.5% (39)
Maryland:
1.7% (8,678)
Other Caribbean
Greater Upper Marlboro:
5.2% (37)
Maryland:
0.8% (4,105)
Trinidad and Tobago
Greater Upper Marlboro:
5.1% (36)
Maryland:
2.1% (11,050)
Ghana
Greater Upper Marlboro:
4.7% (33)
Maryland:
1.3% (6,550)
China, excluding Hong Kong and Taiwan
Greater Upper Marlboro:
4.0% (28)
Maryland:
4.4% (22,741)
Dominican Republic
Greater Upper Marlboro:
3.8% (27)
Maryland:
1.0% (5,419)
United Kingdom
Greater Upper Marlboro:
3.5% (25)
Maryland:
2.7% (14,206)
Sierra Leone
Greater Upper Marlboro:
3.3% (23)
Maryland:
1.0% (5,156)
Spain
Greater Upper Marlboro:
2.8% (20)
Maryland:
0.4% (1,949)
Iran
Greater Upper Marlboro:
2.4% (17)
Maryland:
1.9% (9,733)
Italy
Greater Upper Marlboro:
2.3% (16)
Maryland:
1.2% (6,266)
Vietnam
Greater Upper Marlboro:
2.1% (15)
Maryland:
2.9% (14,807)
El Salvador
Greater Upper Marlboro:
2.0% (14)
Maryland:
8.1% (41,818)
Canada
Greater Upper Marlboro:
2.0% (14)
Maryland:
1.7% (9,019)
Middle Africa
Greater Upper Marlboro:
1.6% (11)
Maryland:
0.8% (4,212)
Place of birth for U.S.-born residents:
This state: 5,264
Other state: 12,528
Northeast: 1,623
Midwest: 766
South: 9,764
West: 375
54% of Greater Upper Marlboro residents lived in the same house 5 years ago. Out of people who lived in different houses, 57% lived in this county. Out of people who lived in different counties, 26% lived in Maryland.
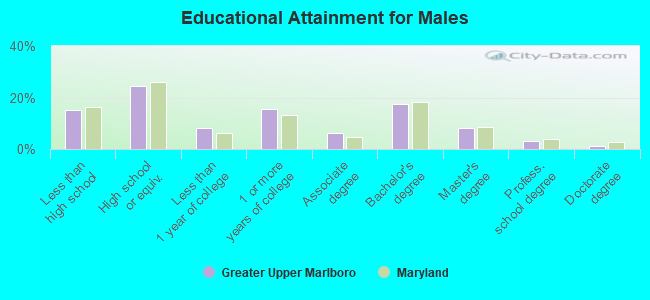
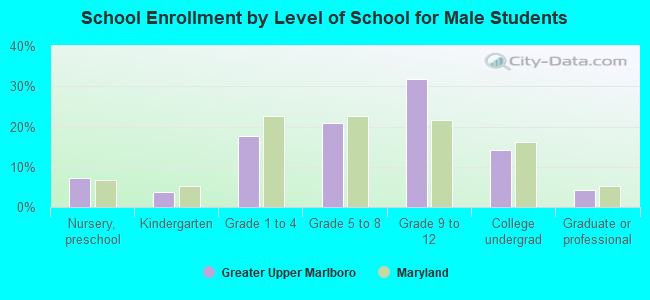
Education attainment for males 25 years and older:
No schooling: 31
Nursery to 4th grade: 28
5th and 6th grade: 17
7th and 8th grade: 149
9th grade: 47
10th grade: 203
11th grade: 183
12th grade, no diploma: 240
High school graduate (or equivalency): 1,450
Less than 1 year of college: 490
Some college more than 1 year, no degree: 909
Associate degree: 376
Bachelor's degree: 1,019
Master's degree: 477
Professional school degree: 192
Doctorate degree: 75
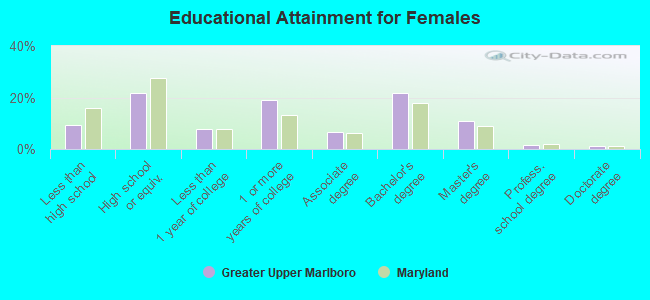
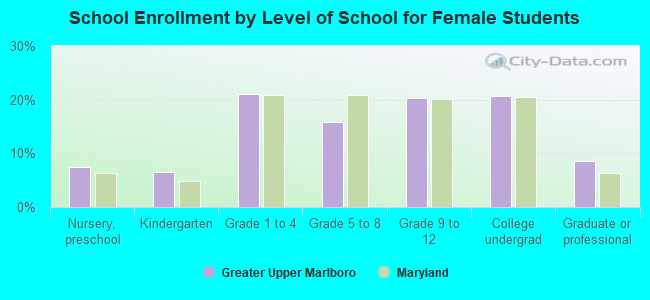
Education attainment for females 25 years and older:
No schooling: 43
Nursery to 4th grade: 20
5th and 6th grade: 50
7th and 8th grade: 111
9th grade: 32
10th grade: 49
11th grade: 144
12th grade, no diploma: 164
High school graduate (or equivalency): 1,409
Less than 1 year of college: 508
Some college more than 1 year, no degree: 1,232
Associate degree: 431
Bachelor's degree: 1,389
Master's degree: 689
Professional school degree: 94
Doctorate degree: 78
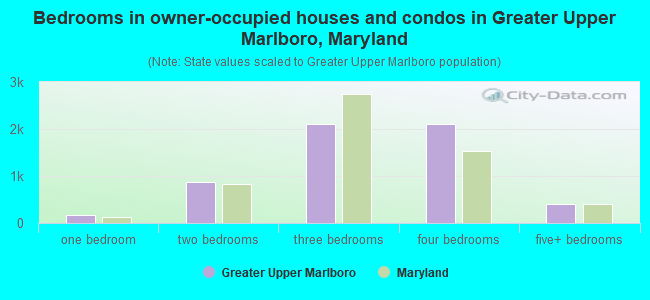
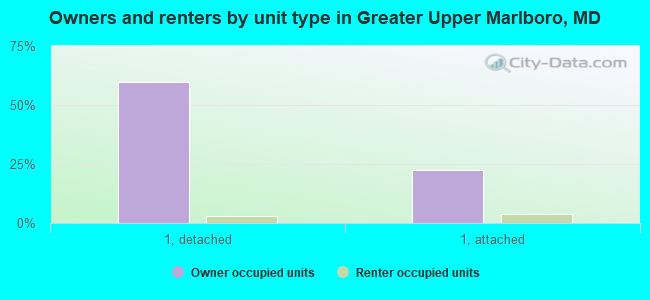
Housing units in structures:
One, detached: 4,304
One, attached: 1,794
Two: 17
3 or 4: 41
5 to 9: 170
10 to 19: 186
20 to 49: 167
50 or more: 141
Mobile homes: 21
Median worth of mobile homes: $37,125
Housing units lacking complete plumbing facilities: 0.8%
Housing units lacking complete kitchen facilities: 0.5%