Greenfield, IN (Indiana) Houses and Residents
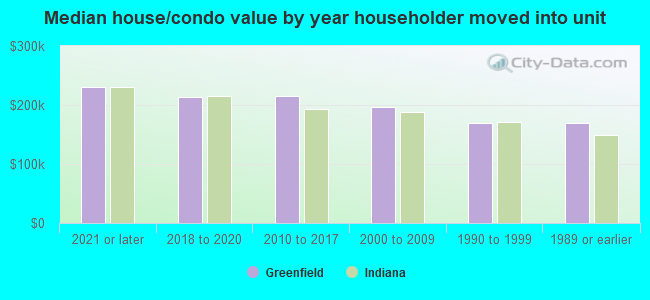
| Greenfield: | $211,095 |
| Indiana: | $208,700 |
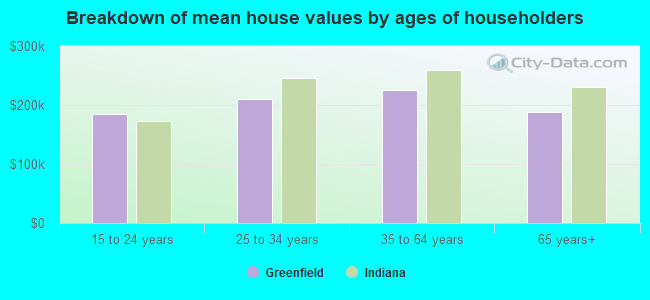
Mean price in 2022:
Detached houses: $228,020
Here: $228,020 State: $257,916 Townhouses or other attached units: $177,824
Here: $177,824 State: $224,114 In 2-unit structures: $315,905
Here: $315,905 State: $175,375 Mobile homes: $73,565
Here: $73,565 State: $67,116
Total population: 21,398 (Urban population: 14,229 (all inside urban clusters), Rural population: 316 (27 farm, 289 nonfarm))
Houses: 10,542 (10,317 occupied: 6,431 owner occupied, 3,703 renter occupied)
| % of renters here: | 37% |
| State: | 29% |
Housing density: 1,313 houses/condos per square mile
Median price asked for vacant for-sale houses and condos in 2022: $1,915,784.
Median contract rent in 2022: $939 (lower quartile is $796, upper quartile is $1,177)
Median rent asked for vacant for-rent units in 2022: $976
Median gross rent in Greenfield, IN in 2022: $1,174
Housing units in Greenfield with a mortgage: 4,837 (367 second mortgage, 0 home equity loan, 317 both second mortgage and home equity loan)
Houses without a mortgage: 379
Median household income for houses/condos with a mortgage: $90,206
Median household income for apartments without a mortgage: $72,770
Median monthly housing costs: $1,096
Compare current foreclosures in Greenfield, IN:
| Photo | Address | Area | Beds / Baths | Price | Details |
|---|---|---|---|---|---|

|
#1
W Weber Rd
Greenfield, IN 46140
|
1,647 sq. feet
|
1 baths 3 beds |
show details | |

|
#2
N 25 W
Greenfield, IN 46140
|
2,549 sq. feet
|
2 baths 4 beds |
show details | |

|
#3
S Meridian Rd
Greenfield, IN 46140
|
1,470 sq. feet
|
1 baths 3 beds |
show details | |

|
#4
Chapman Blvd
Greenfield, IN 46140
|
3,926 sq. feet
|
3 baths 4 beds |
show details | |

|
#5
W Sixth St
Greenfield, IN 46140
|
1,043 sq. feet
|
1 baths 3 beds |
show details | |

|
#6
N 400 E
Greenfield, IN 46140
|
1,476 sq. feet
|
2 baths 6 beds |
show details | |

|
#7
N Spring St
Greenfield, IN 46140
|
2,128 sq. feet
|
2 baths 4 beds |
show details | |

|
#8
E Fifth St
Greenfield, IN 46140
|
1,260 sq. feet
|
1 baths 3 beds |
show details | |

|
#9
E Mckenzie Rd
Greenfield, IN 46140
|
960 sq. feet
|
1 baths 2 beds |
show details | |

|
#10
Streamside Dr
Greenfield, IN 46140
|
2,852 sq. feet
|
2 baths 4 beds |
show details |
| Photo | Address | Area | Beds / Baths | Price | Details |
|---|---|---|---|---|---|

|
#11
Carlton Dr
Greenfield, IN 46140
|
1,696 sq. feet
|
2 baths 3 beds |
show details | |

|
#12
S Brandywine Ln
Greenfield, IN 46140
|
1,244 sq. feet
|
2 baths 3 beds |
show details | |

|
#13
N Fortville Pike
Greenfield, IN 46140
|
988 sq. feet
|
1 baths 2 beds |
show details | |

|
#14
S Morristown Pike
Greenfield, IN 46140
|
2,000 sq. feet
|
2 baths 3 beds |
show details | |

|
#15
Lavender Dr
Greenfield, IN 46140
|
1,504 sq. feet
|
2 baths 3 beds |
show details | |

|
#16
N Winchester Dr
Greenfield, IN 46140
|
1,641 sq. feet
|
3 baths 3 beds |
show details | |

|
#17
Sweetheart Ct
Greenfield, IN 46140
|
1,304 sq. feet
|
2 baths 3 beds |
show details | |

|
#18
Independence Rd
Greenfield, IN 46140
|
1,577 sq. feet
|
2 baths 3 beds |
show details | |

|
#19
N 350 W
Greenfield, IN 46140
|
1,656 sq. feet
|
2 baths 3 beds |
show details | |

|
#20
N 700 W
Greenfield, IN 46140
|
1,749 sq. feet
|
2 baths 3 beds |
show details |
| Photo | Address | Area | Beds / Baths | Price | Details |
|---|---|---|---|---|---|

|
#21
Lake View Ct S
Greenfield, IN 46140
|
2,024 sq. feet
|
2 baths 3 beds |
show details | |

|
#22
Rosemary Ct
Greenfield, IN 46140
|
2,108 sq. feet
|
2 baths 3 beds |
show details | |

|
#23
N Meridian Rd
Greenfield, IN 46140
|
2,108 sq. feet
|
2 baths 3 beds |
show details | |

|
#24
W 300 N
Greenfield, IN 46140
|
1,269 sq. feet
|
1 baths 3 beds |
show details | |

|
#25
W North St
Greenfield, IN 46140
|
1,594 sq. feet
|
1 baths 3 beds |
show details | |

|
#26
Founders Dr
Greenfield, IN 46140
|
2,333 sq. feet
|
2 baths 3 beds |
show details | |

|
#27
W 100 N
Greenfield, IN 46140
|
2,874 sq. feet
|
1 baths 4 beds |
show details | |

|
#28
Cortland Ct
Greenfield, IN 46140
|
1,514 sq. feet
|
2 baths 3 beds |
show details | |

|
#29
E 300 N
Greenfield, IN 46140
|
2,465 sq. feet
|
2 baths 4 beds |
show details | |

|
#30
Madison Dr
Greenfield, IN 46140
|
1,613 sq. feet
|
1 baths 3 beds |
show details |
| Photo | Address | Area | Beds / Baths | Price | Details |
|---|---|---|---|---|---|

|
#31
Brookview Cir
Greenfield, IN 46140
|
1,970 sq. feet
|
2 baths 4 beds |
show details | |

|
#32
Mimosa Ct
Greenfield, IN 46140
|
1,395 sq. feet
|
2 baths 3 beds |
show details | |

|
#33
S 750 E
Greenfield, IN 46140
|
2,010 sq. feet
|
2 baths 3 beds |
show details | |

|
#34
S State St
Greenfield, IN 46140
|
2,815 sq. feet
|
1 baths 4 beds |
show details | |

|
#35
W Mckenzie Rd
Greenfield, IN 46140
|
1,800 sq. feet
|
2 baths 3 beds |
show details | |

|
#36
W 200 N # 617
Greenfield, IN 46140
|
2,584 sq. feet
|
2 baths 3 beds |
show details | |

|
#37
Geronimo Dr
Greenfield, IN 46140
|
- sq. feet
|
- baths - beds |
show details | |

|
#38
Van Buren St
Greenfield, IN 46140
|
- sq. feet
|
- baths - beds |
show details | |

|
#39
Lexington Trl
Greenfield, IN 46140
|
- sq. feet
|
- baths - beds |
show details | |

|
#40
Deldin Ct Apt 3
Greenfield, IN 46140
|
- sq. feet
|
- baths - beds |
show details |
| Photo | Address | Area | Beds / Baths | Price | Details |
|---|---|---|---|---|---|

|
#41
W Springhurst Blvd
Greenfield, IN 46140
|
- sq. feet
|
- baths - beds |
show details | |

|
#42
W Fifth St, Apt 4
Greenfield, IN 46140
|
- sq. feet
|
- baths - beds |
show details | |

|
#43
Prospector Dr
Greenfield, IN 46140
|
- sq. feet
|
- baths - beds |
show details | |

|
#44
Woodland East Dr
Greenfield, IN 46140
|
- sq. feet
|
- baths - beds |
show details | |

|
#45
Meek St
Greenfield, IN 46140
|
- sq. feet
|
- baths - beds |
show details | |

|
#46
Ginny Trce, Apt 302
Greenfield, IN 46140
|
- sq. feet
|
- baths - beds |
show details | |

|
#47
Streamside Dr
Greenfield, IN 46140
|
- sq. feet
|
- baths - beds |
show details | |

|
#48
Boots Trl
Greenfield, IN 46140
|
- sq. feet
|
- baths - beds |
show details | |

|
#49
W Harmony Trl
Greenfield, IN 46140
|
- sq. feet
|
- baths - beds |
show details | |

|
Check over 1 million property listings on Foreclosure.com!
|
browse all offers | |||

Latest news about housing in Greenfield, IN collected exclusively by city-data.com from local newspapers, TV, and radio stations

 | Packing up House Soon in Greenfield, IN (5 replies) |
| Is my impression of Indianapolis accurate? (167 replies) |
| Elanco moving HQ to near downtown Indianapolis from Greenfield (5 replies) |
| Housing prices by suburb? (14 replies) |
| Someone please talk to me about Muncie. (22 replies) |
| Thoughts on Wabash, Indiana? (17 replies) |

Median year apartment built: 1991
Household type by relationship:
Households: 24,525- Male householders: 5,287 (1,007 living alone), Female householders: 4,770 (1,831 living alone)
4,727 spouses (4,708 opposite-sex spouses), 878 unmarried partners, (790 opposite-sex unmarried partners), 6,094 children (5,544 natural, 35 adopted, 514 stepchildren), 1,177 grandchildren, 37 brothers or sisters, 214 parents, 15 foster children, 247 other relatives, 481 non-relatives
- In group quarters: 592
Size of family households: 2,946 2-persons, 1,727 3-persons, 1,237 4-persons, 709 5-persons, 212 6-persons, 41 7-or-more-persons.
Size of nonfamily households: 2,902 1-person, 253 2-persons, 100 3-persons.
3,192 married couples with children.
927 single-parent households (184 men, 743 women).
94.8% of residents of Greenfield speak English at home.
1.0% of residents speak Spanish at home (37% speak English very well, 13% speak English well, 49% speak English not well).
2.3% of residents speak other Indo-European language at home (93% speak English very well, 7% speak English not well).
0.5% of residents speak Asian or Pacific Island language at home (67% speak English very well, 25% speak English well, 8% speak English not well).
1.2% of residents speak other language at home (69% speak English very well, 31% speak English well).
Foreign born population: 742 (3.0%)
(64.8% of them are naturalized citizens)
| Here: | 6.2 |
| State: | 6.6 |
| Here: | 5.0 |
| State: | 4.3 |
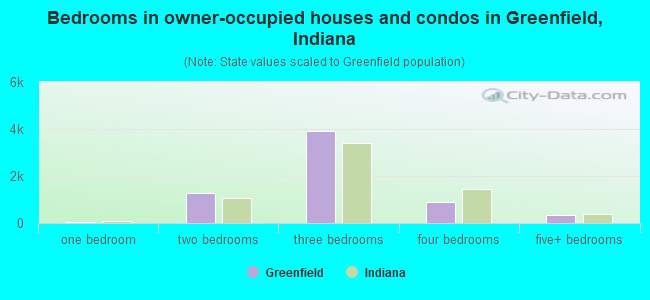
- Bedrooms in owner-occupied houses and condos in Greenfield, Indiana
- 0no bedroom
- 541 bedroom
- 1,2602 bedrooms
- 3,8963 bedrooms
- 8754 bedrooms
- 3475+ bedrooms
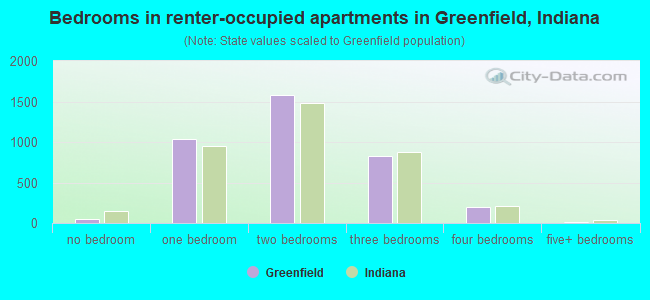
- Bedrooms in renter-occupied apartments in Greenfield, Indiana
- 47no bedroom
- 1,0371 bedroom
- 1,5762 bedrooms
- 8313 bedrooms
- 1954 bedrooms
- 185+ bedrooms
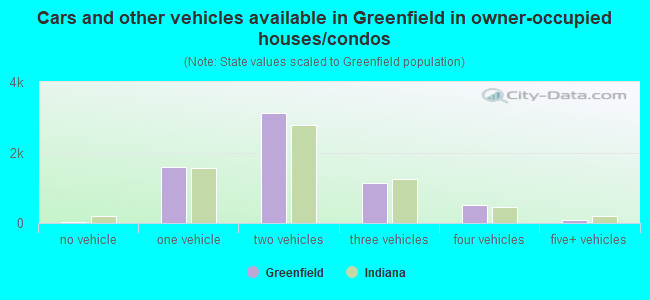
- Cars and other vehicles available in Greenfield in owner-occupied houses/condos
- 26no vehicle
- 1,5831 vehicle
- 3,1072 vehicles
- 1,1213 vehicles
- 5064 vehicles
- 885+ vehicles
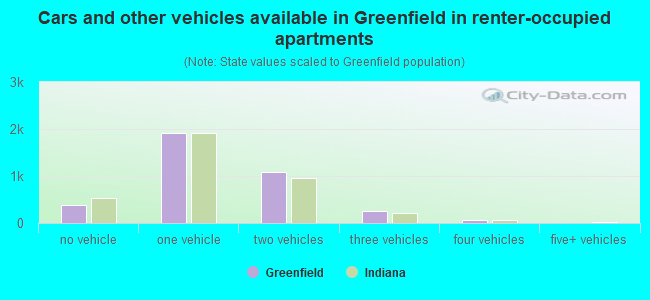
- Cars and other vehicles available in Greenfield in renter-occupied apartments
- 378no vehicle
- 1,9211 vehicle
- 1,0902 vehicles
- 2593 vehicles
- 554 vehicles
- 05+ vehicles
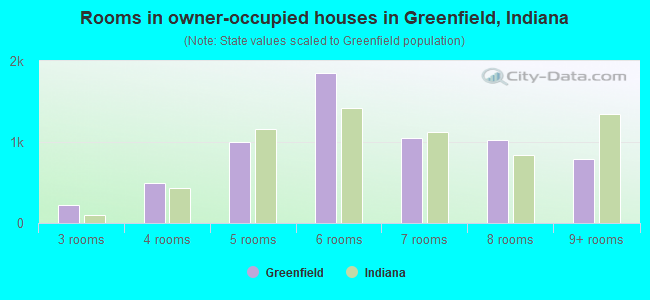
- Rooms in owner-occupied houses in Greenfield, Indiana
- 01 room
- 02 rooms
- 2233 rooms
- 4934 rooms
- 1,0035 rooms
- 1,8516 rooms
- 1,0457 rooms
- 1,0218 rooms
- 7959+ rooms
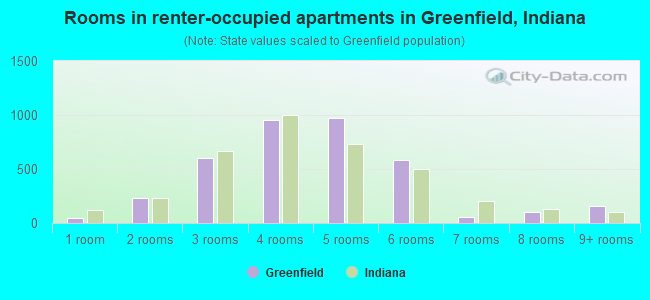
- Rooms in renter-occupied apartments in Greenfield, Indiana
- 471 room
- 2342 rooms
- 6013 rooms
- 9554 rooms
- 9715 rooms
- 5826 rooms
- 547 rooms
- 1028 rooms
- 1579+ rooms
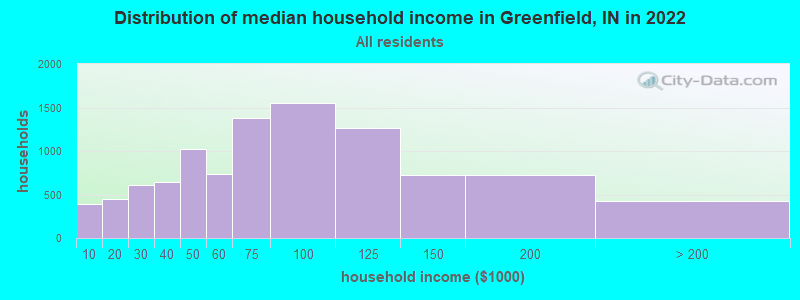
Greenfield, IN household income distribution

- 387Less than $10,000
- 446$10,000 to $19,999
- 608$20,000 to $29,999
- 641$30,000 to $39,999
- 1,021$40,000 to $49,999
- 739$50,000 to $59,999
- 1,379$60,000 to $74,999
- 1,552$75,000 to $99,999
- 1,265$100,000 to $124,999
- 721$125,000 to $149,999
- 725$150,000 to $199,999
- 428$200,000 or more
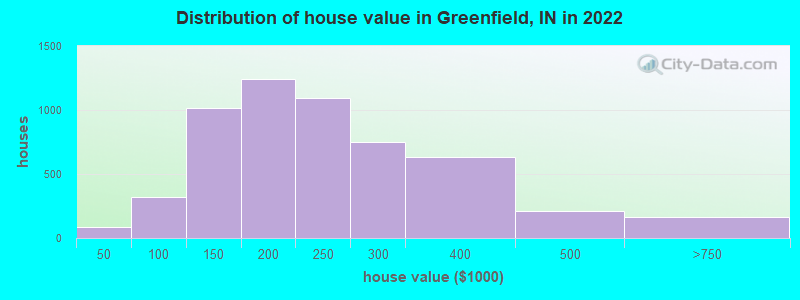
Home value of owner - occupied houses in 2022 in Greenfield, IN
-
- 25Less than $10,000
- 18$10,000 to $14,999
- 33$15,000 to $19,999
- 9$30,000 to $34,999
- 23$50,000 to $59,999
- 10$60,000 to $69,999
- 51$70,000 to $79,999
- 80$80,000 to $89,999
- 156$90,000 to $99,999
- 613$100,000 to $124,999
- 400$125,000 to $149,999
- 772$150,000 to $174,999
- 467$175,000 to $199,999
- 1,095$200,000 to $249,999
- 752$250,000 to $299,999
- 630$300,000 to $399,999
- 207$400,000 to $499,999
- 162$500,000 to $749,999
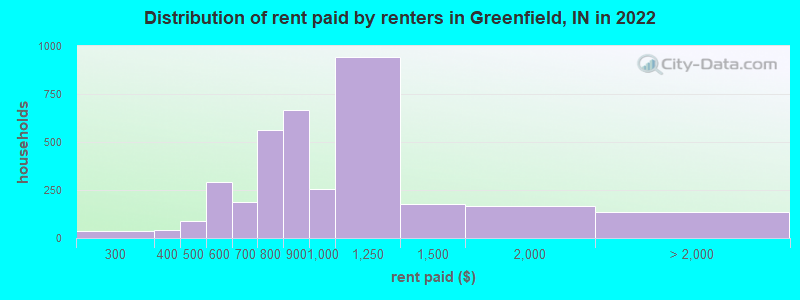
Rent paid by renters in 2022 in Greenfield, IN
-
- 35$250 to $299
- 32$300 to $349
- 9$350 to $399
- 9$400 to $449
- 77$450 to $499
- 65$500 to $549
- 227$550 to $599
- 116$600 to $649
- 67$650 to $699
- 225$700 to $749
- 334$750 to $799
- 667$800 to $899
- 256$900 to $999
- 942$1,000 to $1,249
- 177$1,250 to $1,499
- 167$1,500 to $1,999
- 19$2,000 to $2,499
- 117No cash rent
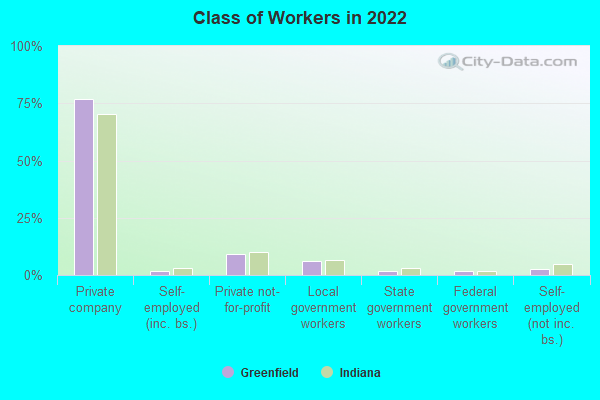
Percentage of workers working in this county: 70.7%
Number of people working at home: 1,208 (9.9% of all workers)
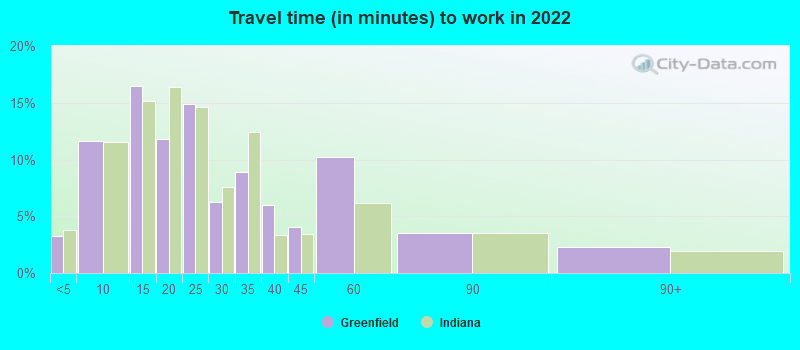
Travel time to work (commute)
- Less than 5 minutes: 586
- 5 to 9 minutes: 1,538
- 10 to 14 minutes: 2,615
- 15 to 19 minutes: 1,045
- 20 to 24 minutes: 1,516
- 25 to 29 minutes: 325
- 30 to 34 minutes: 855
- 35 to 39 minutes: 298
- 40 to 44 minutes: 522
- 45 to 59 minutes: 1,354
- 60 to 89 minutes: 313
- 90 or more minutes: 176
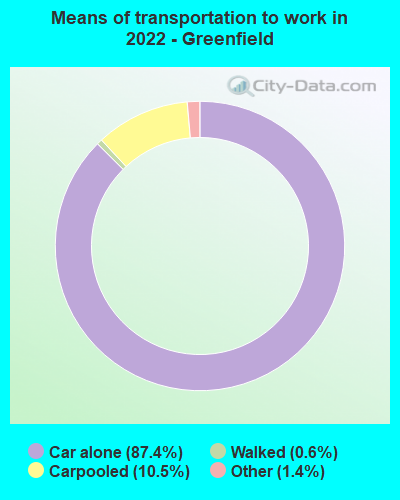
Means of transportation to work:
- Drove a car alone: 12,041 (78.9%)
- Carpooled: 1,598 (10.5%)
- Taxi: 233 (1.5%)
- Bicycle: 4 (0.0%)
- Walked: 85 (0.6%)
- Worked at home: 1,208 (7.9%)
- Unemployment by race in 2022
- Unemployment rate for White non-Hispanic residents
- 2.6%Males
- 2.1%Females
- Unemployment rate for two or more race residents
- 1.8%Females
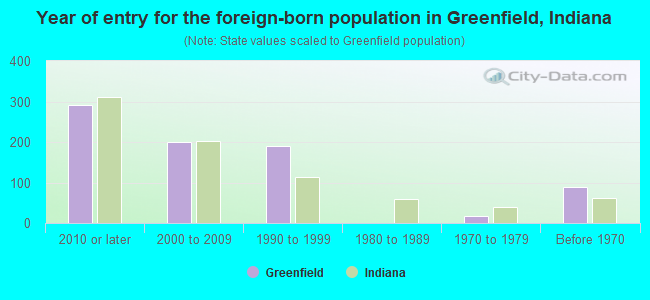
- Year of entry for the foreign-born population in Greenfield, Indiana
- 2922010 or later
- 2012000 to 2009
- 1891990 to 1999
- 01980 to 1989
- 171970 to 1979
- 89Before 1970
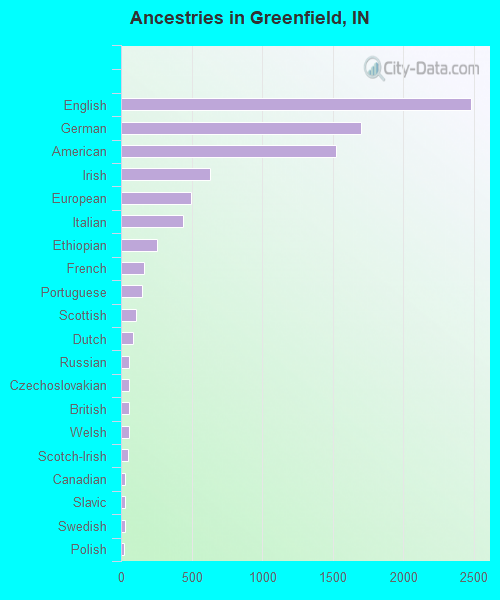
First ancestries reported:
- English: 2,483 (23.3%)
- German: 1,703 (16.0%)
- American: 1,521 (14.3%)
- Irish: 633 (5.9%)
- European: 495 (4.6%)
- Italian: 441 (4.1%)
- Ethiopian: 252 (2.4%)
- French: 162 (1.5%)
- Portuguese: 148 (1.4%)
- Scottish: 104 (1.0%)
- Dutch: 82 (0.8%)
- Russian: 59 (0.6%)
- Czechoslovakian: 57 (0.5%)
- British: 55 (0.5%)
- Welsh: 55 (0.5%)
- Scotch-Irish: 53 (0.5%)
- Canadian: 30 (0.3%)
- Slavic: 28 (0.3%)
- Swedish: 28 (0.3%)
- Polish: 24 (0.2%)
- Serbian: 19 (0.2%)
- Scandinavian: 12 (0.1%)
Most common places of birth for foreign-born residents (%):
| Greenfield: | 38.6% (316) |
| Indiana: | 0.7% (2,532) |
| Greenfield: | 25.3% (207) |
| Indiana: | 8.5% (32,127) |
| Greenfield: | 10.5% (86) |
| Indiana: | 27.0% (101,996) |
| Greenfield: | 9.8% (80) |
| Indiana: | 2.0% (7,653) |
| Greenfield: | 6.8% (56) |
| Indiana: | 0.7% (2,626) |
| Greenfield: | 4.2% (34) |
| Indiana: | 4.3% (16,289) |
| Greenfield: | 2.8% (23) |
| Indiana: | 1.8% (6,645) |
| Greenfield: | 2.6% (21) |
| Indiana: | 0.0% (174) |
| Greenfield: | 2.1% (17) |
| Indiana: | 1.4% (5,446) |
Place of birth for U.S.-born residents:
- This state: 17,512
- Other state: 6,152
- Northeast: 282
- Midwest: 2,771
- South: 2,385
- West: 747
83.7% of Greenfield residents lived in the same house 1 years ago.
Out of people who lived in different houses, 35.2% lived in this county.
Out of people who lived in different counties, 76.7% lived in Indiana.
| Greenfield: | 83.7% |
| State average: | 87.1% |
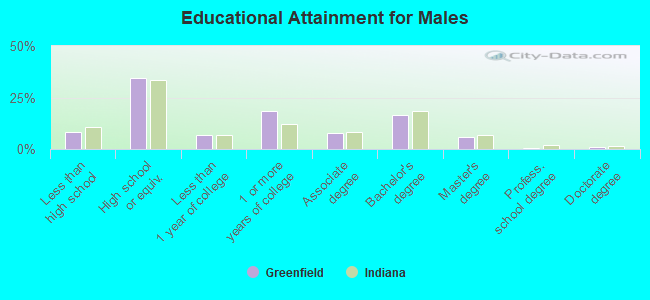
Education attainment for males 25 years and older:
- No schooling: 123
- Nursery to 4th grade: 0
- 5th and 6th grade: 0
- 7th and 8th grade: 107
- 9th grade: 103
- 10th grade: 72
- 11th grade: 62
- 12th grade, no diploma: 175
- High school graduate (or equivalency): 2,624
- Less than 1 year of college: 511
- Some college more than 1 year, no degree: 1,418
- Associate degree: 581
- Bachelor's degree: 1,260
- Master's degree: 445
- Professional school degree: 45
- Doctorate degree: 86
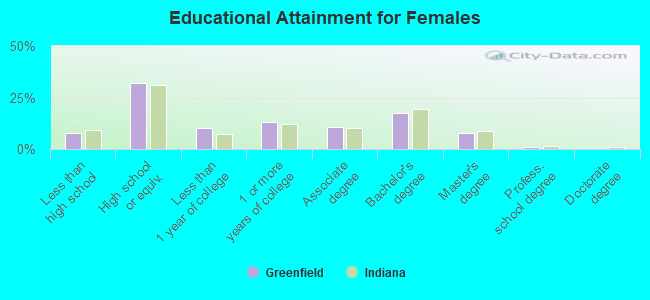
Education attainment for females 25 years and older:
- No schooling: 250
- Nursery to 4th grade: 0
- 5th and 6th grade: 10
- 7th and 8th grade: 18
- 9th grade: 184
- 10th grade: 105
- 11th grade: 104
- 12th grade, no diploma: 26
- High school graduate (or equivalency): 2,966
- Less than 1 year of college: 940
- Some college more than 1 year, no degree: 1,216
- Associate degree: 973
- Bachelor's degree: 1,620
- Master's degree: 717
- Professional school degree: 77
- Doctorate degree: 0


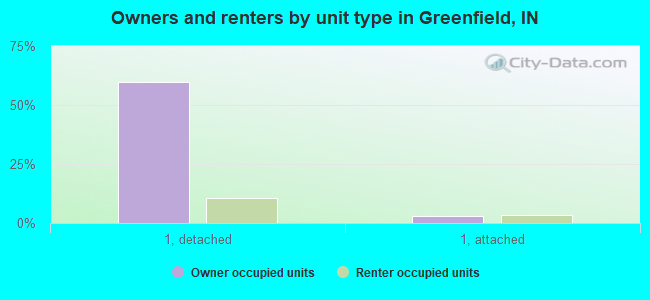
Housing units in structures:
- One, detached: 7,289
- One, attached: 682
- Two: 514
- 3 or 4: 218
- 5 to 9: 741
- 10 to 19: 411
- 20 to 49: 170
- 50 or more: 266
- Mobile homes: 247
Median worth of mobile homes: $59,014
Housing units lacking complete kitchen facilities in 2022: 2.0%
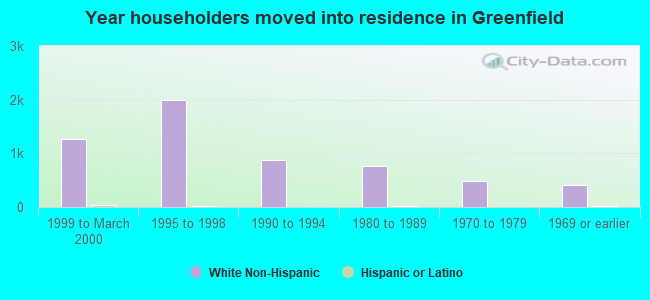
House/condo owner moved in on average 8 years ago
Renter moved in on average 3 years ago
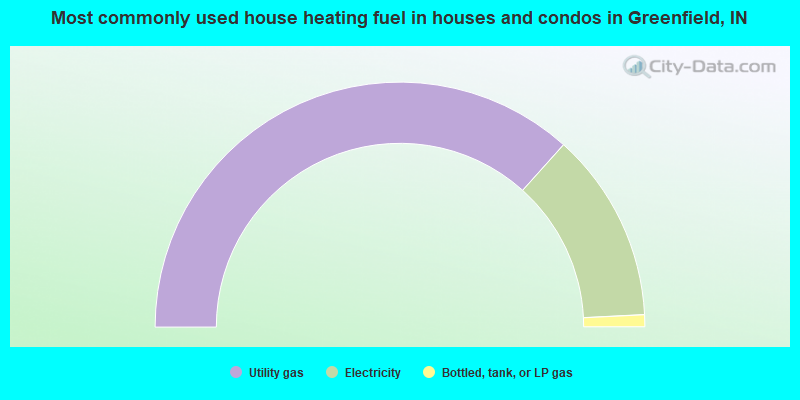
- 73.3%Utility gas
- 25.1%Electricity
- 1.6%Bottled, tank, or LP gas
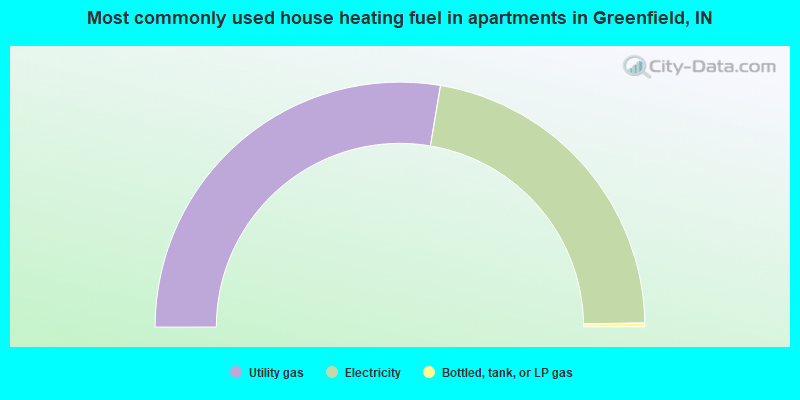
- 55.3%Utility gas
- 44.2%Electricity
- 0.5%Bottled, tank, or LP gas
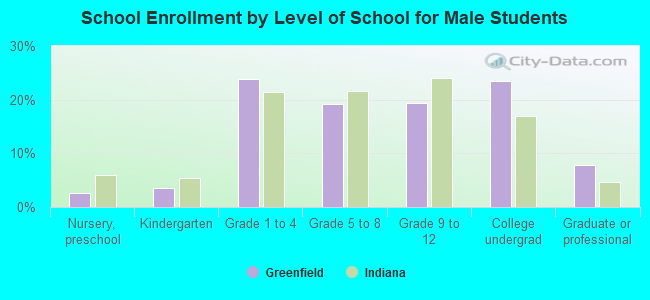
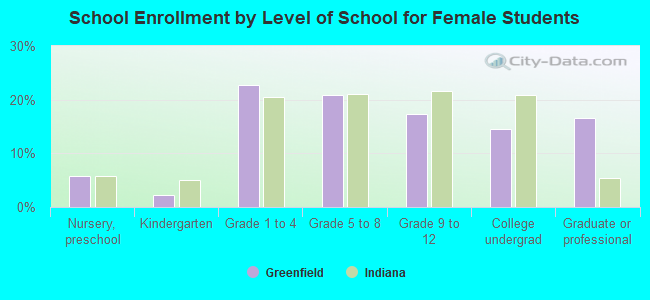
Private vs. public school enrollment:
| Here: | 13.0% |
| Indiana: | 14.9% |
| Here: | 14.4% |
| Indiana: | 11.4% |
| Here: | 6.5% |
| Indiana: | 22.3% |