Housing density: 451 houses/condos per square mile
Median price asked for vacant for-sale houses and condos in 2022 in this county: $106,377.
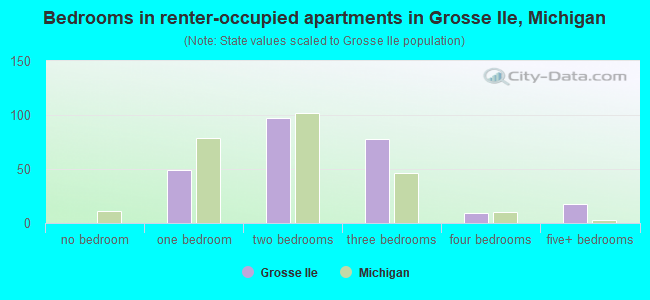
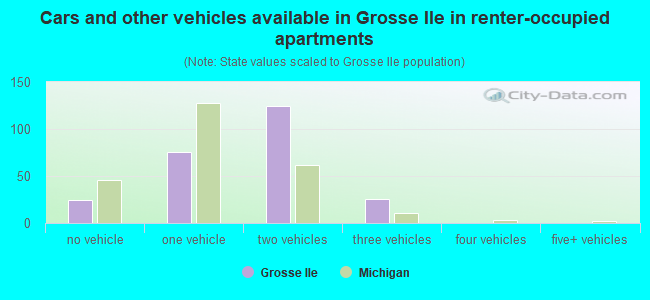
Median contract rent in 2022: $1,572 (lower quartile is $1,139, upper quartile is over $2,000)
Median rent asked for vacant for-rent units in 2022: $1,096
Median gross rent in Grosse Ile, MI in 2022: $1,819
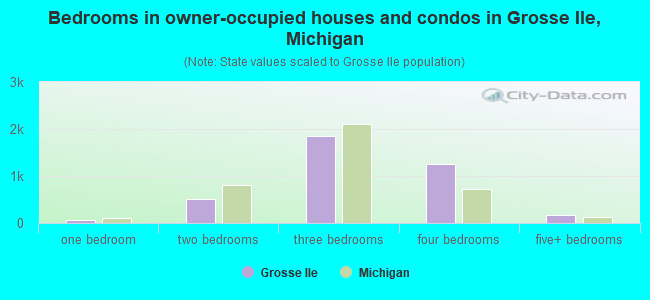
Housing units in Grosse Ile with a mortgage: 2,516 (138 second mortgage, 567 home equity loan, 39 both second mortgage and home equity loan) Houses without a mortgage: 893
In family households: 1,498,789 (258,506 male householders, 192,145 female householders)
262,559 spouses, 587,748 children (552,691 natural, 12,983 adopted, 22,074 stepchildren), 59,857 grandchildren, 29,796 brothers or sisters, 18,494 parents, foster children, 33,994 other relatives, 46,947 non-relatives
In nonfamily households: 297,946 (119,035 male householders (98,486 living alone)), 133,063 female householders (117,224 living alone)), 45,848 nonrelatives
In group quarters: 23,849 (12,226 institutionalized population)
286,927 married couples with children.
201,029 single-parent households (28,311 men, 172,718 women).
92.0% of residents of Grosse Ile speak English at home.
1.1% of residents speak Spanish at home (79% speak English very well, 6% speak English well, 15% speak English not well).
4.7% of residents speak other Indo-European language at home (77% speak English very well, 18% speak English well, 5% speak English not well).
1.3% of residents speak Asian or Pacific Island language at home (46% speak English very well, 21% speak English well, 22% speak English not well, 11% don't speak English at all).
0.9% of residents speak other language at home (65% speak English very well, 16% speak English well, 19% don't speak English at all).
Foreign born population: 892 (9.6%)
(86.4% of them are naturalized citizens)
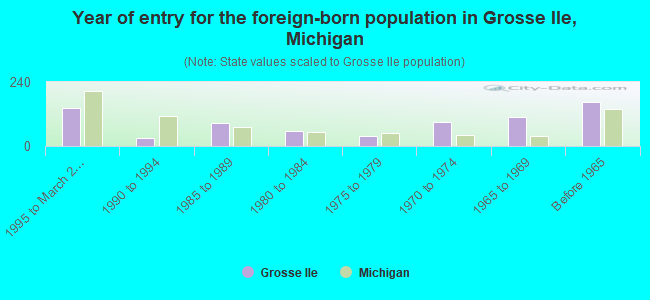
Year of entry for the foreign-born population in Grosse Ile, Michigan
1411995 to March 2000
291990 to 1994
881985 to 1989
561980 to 1984
371975 to 1979
901970 to 1974
1071965 to 1969
165Before 1965
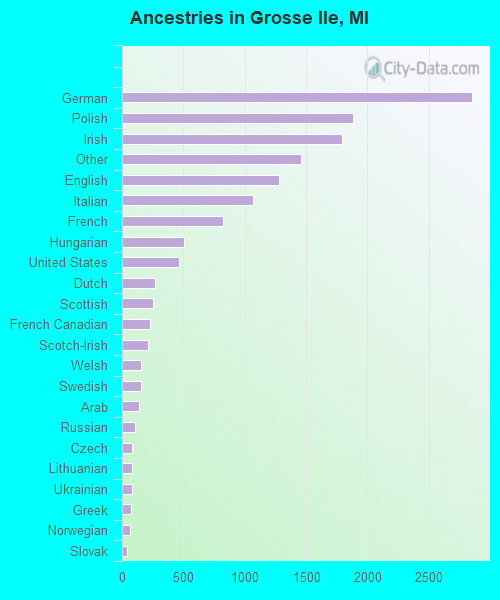
First ancestries reported:
German: 2,849 (20.2%)
Polish: 1,883 (13.3%)
Irish: 1,794 (12.7%)
Other: 1,460 (10.4%)
English: 1,282 (9.1%)
Italian: 1,068 (7.6%)
French: 826 (5.9%)
Hungarian: 508 (3.6%)
United States: 465 (3.3%)
Dutch: 271 (1.9%)
Scottish: 249 (1.8%)
French Canadian: 229 (1.6%)
Scotch-Irish: 214 (1.5%)
Welsh: 156 (1.1%)
Swedish: 153 (1.1%)
Arab: 138 (1.0%)
Russian: 107 (0.8%)
Czech: 82 (0.6%)
Lithuanian: 82 (0.6%)
Ukrainian: 78 (0.6%)
Greek: 74 (0.5%)
Norwegian: 64 (0.5%)
Slovak: 37 (0.3%)
Swiss: 20 (0.1%)
Danish: 17 (0.1%)
Most common places of birth for foreign-born residents (%):
Germany
Grosse Ile:
18.5% (132)
Michigan:
4.4% (22,814)
Canada
Grosse Ile:
12.3% (88)
Michigan:
9.5% (49,515)
Korea
Grosse Ile:
9.0% (64)
Michigan:
3.5% (18,107)
Japan
Grosse Ile:
6.7% (48)
Michigan:
1.6% (8,460)
Yugoslavia
Grosse Ile:
6.6% (47)
Michigan:
1.8% (9,425)
Syria
Grosse Ile:
6.5% (46)
Michigan:
0.5% (2,851)
Other Eastern Africa
Grosse Ile:
5.6% (40)
Michigan:
0.7% (3,429)
United Kingdom
Grosse Ile:
4.8% (34)
Michigan:
3.9% (20,614)
Other Eastern Europe
Grosse Ile:
4.8% (34)
Michigan:
2.9% (14,958)
Other Southern Europe
Grosse Ile:
3.5% (25)
Michigan:
0.4% (2,119)
Poland
Grosse Ile:
3.5% (25)
Michigan:
2.9% (15,303)
Philippines
Grosse Ile:
2.7% (19)
Michigan:
2.6% (13,679)
Argentina
Grosse Ile:
2.2% (16)
Michigan:
0.3% (1,418)
Taiwan
Grosse Ile:
2.1% (15)
Michigan:
0.9% (4,631)
Netherlands
Grosse Ile:
1.7% (12)
Michigan:
1.2% (6,403)
Hong Kong
Grosse Ile:
1.7% (12)
Michigan:
0.4% (2,041)
Place of birth for U.S.-born residents:
This state: 8,148
Other state: 1,961
Northeast: 602
Midwest: 726
South: 475
West: 158
64% of Grosse Ile residents lived in the same house 5 years ago. Out of people who lived in different houses, 78% lived in this county. Out of people who lived in different counties, 48% lived in Michigan.
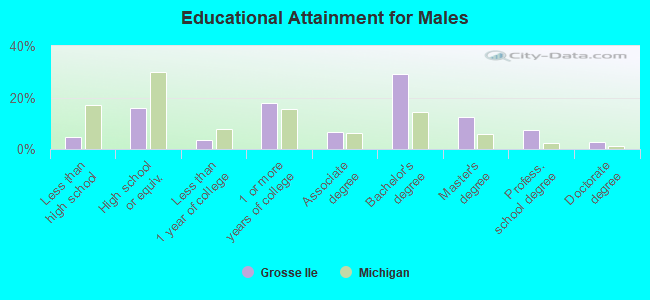
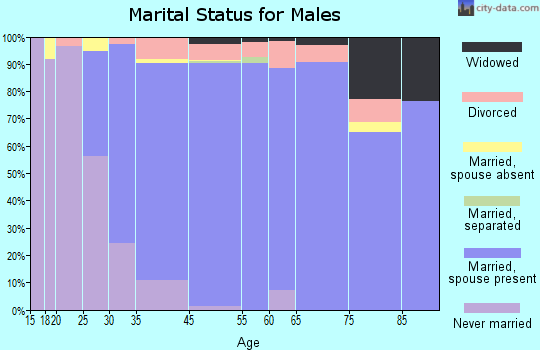
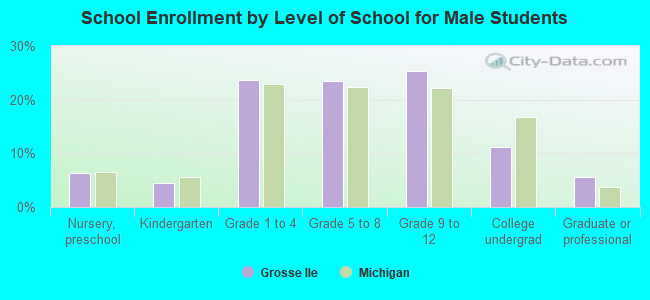
Education attainment for males 25 years and older:
No schooling: 12
Nursery to 4th grade: 0
5th and 6th grade: 0
7th and 8th grade: 20
9th grade: 17
10th grade: 42
11th grade: 25
12th grade, no diploma: 55
High school graduate (or equivalency): 593
Less than 1 year of college: 134
Some college more than 1 year, no degree: 662
Associate degree: 251
Bachelor's degree: 1,085
Master's degree: 458
Professional school degree: 276
Doctorate degree: 96
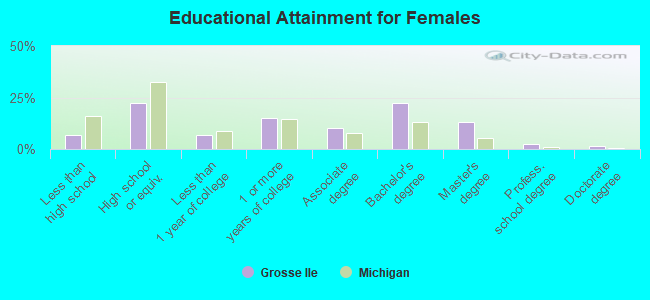
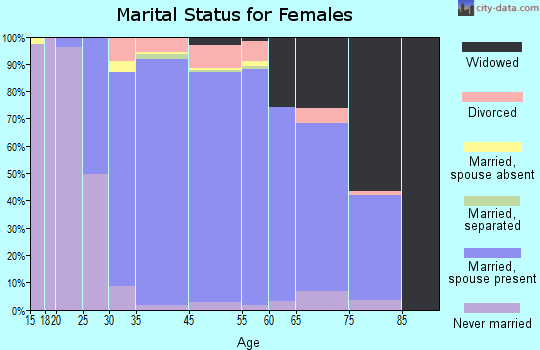
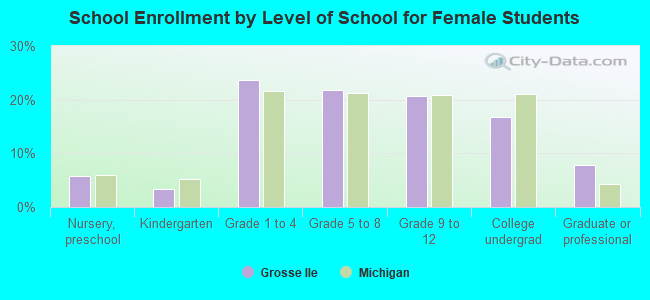
Education attainment for females 25 years and older: