Hampton Township, PA (Pennsylvania) Houses and Residents
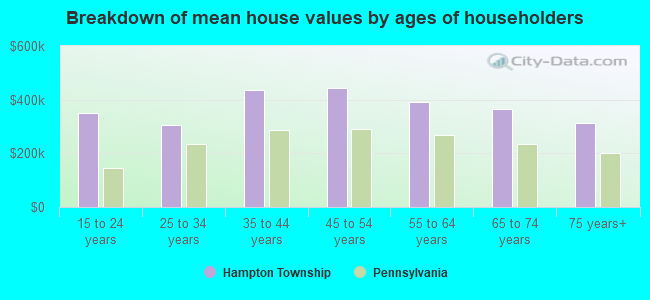
| Hampton Township: | $354,189 |
| Pennsylvania: | $245,500 |
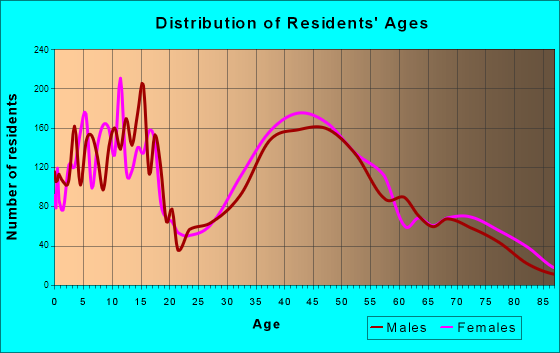
Total population: 16,704 (All urban)
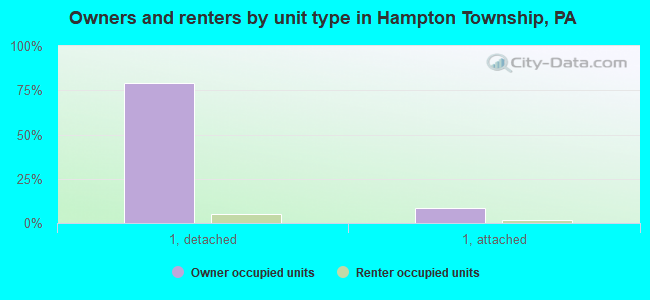
Houses: 6,627 (6,253 occupied: 5,548 owner occupied, 705 renter occupied)
| % of renters here: | 11% |
| State: | 31% |
Housing density: 413 houses/condos per square mile
Median price asked for vacant for-sale houses and condos in 2022 in this county: $195,117.
Median contract rent in 2022: $1,281 (lower quartile is $942, upper quartile is $1,693)
Median rent asked for vacant for-rent units in 2022: $3,433
Median gross rent in Hampton Township, PA in 2022: $1,618
Housing units in Hampton Township with a mortgage: 3,856 (307 second mortgage, 886 home equity loan, 19 both second mortgage and home equity loan)
Houses without a mortgage: 1,476
Compare current foreclosures near Hampton Township, PA:
| Photo | Address | Area | Beds / Baths | Price | Details |
|---|---|---|---|---|---|

|
#1
Leslie St
East Mc Keesport, PA 15035
|
1,144 sq. feet
|
1 baths 2 beds |
$64,900
|
show details |

|
#2
Semicir St
Pittsburgh, PA 15214
|
537 sq. feet
|
1 baths 1 beds |
$21,000
|
show details |

|
#3
Kirk Ave
Pittsburgh, PA 15227
|
1,500 sq. feet
|
2 baths 3 beds |
$197,500
|
show details |

|
#4
Punta Gorda St
East Mc Keesport, PA 15035
|
1,200 sq. feet
|
1 baths 3 beds |
$171,500
|
show details |

|
#5
Brinwood Ave
Pittsburgh, PA 15227
|
1,000 sq. feet
|
2 baths 3 beds |
$229,900
|
show details |

|
#6
Olga St
Ambridge, PA 15003
|
2,629 sq. feet
|
2 baths 4 beds |
$144,900
|
show details |

|
#7
Dorothy Dr
Pittsburgh, PA 15235
|
956 sq. feet
|
1 baths 3 beds |
$66,500
|
show details |

|
#8
Triana St
Pittsburgh, PA 15210
|
1,184 sq. feet
|
1 baths 3 beds |
$157,500
|
show details |

|
#9
Muirfield Dr
Presto, PA 15142
|
4,801 sq. feet
|
4 baths 5 beds |
$709,500
|
show details |

|
#10
Grant St
Carnegie, PA 15106
|
1,345 sq. feet
|
2 baths 4 beds |
$225,500
|
show details |
| Photo | Address | Area | Beds / Baths | Price | Details |
|---|---|---|---|---|---|

|
#11
Riverside Dr
Freeport, PA 16229
|
1,060 sq. feet
|
1 baths 3 beds |
$97,941
|
show details |

|
#12
Adams Ave
West Mifflin, PA 15122
|
3,106 sq. feet
|
4 baths 5 beds |
show details | |

|
#13
Catherine St
Mc Kees Rocks, PA 15136
|
2,688 sq. feet
|
2 baths 4 beds |
show details | |

|
#14
Carrington Ct
Monroeville, PA 15146
|
3,018 sq. feet
|
2 baths 5 beds |
show details | |

|
#15
Progress St
Mc Kees Rocks, PA 15136
|
1,477 sq. feet
|
2 baths 3 beds |
show details | |

|
#16
Evaline St
Pittsburgh, PA 15235
|
1,724 sq. feet
|
1 baths 3 beds |
show details | |

|
#17
Woodbine St
Pittsburgh, PA 15201
|
1,668 sq. feet
|
1 baths 3 beds |
show details | |

|
#18
W 8th Ave
Tarentum, PA 15084
|
1,676 sq. feet
|
2 baths 3 beds |
show details | |

|
#19
High Ridge Ct
New Kensington, PA 15068
|
2,504 sq. feet
|
2 baths 3 beds |
show details | |

|
#20
9th St
Mc Kees Rocks, PA 15136
|
1,380 sq. feet
|
1 baths 2 beds |
show details |
| Photo | Address | Area | Beds / Baths | Price | Details |
|---|---|---|---|---|---|

|
#21
Greensburg Pike
North Versailles, PA 15137
|
1,109 sq. feet
|
1 baths 2 beds |
show details | |

|
#22
Calhoun Ave
Pittsburgh, PA 15210
|
1,746 sq. feet
|
2 baths 3 beds |
show details | |

|
#23
Azalea Dr
Pittsburgh, PA 15235
|
956 sq. feet
|
2 baths 3 beds |
show details | |

|
#24
Kenzie Dr # K-7
Pittsburgh, PA 15205
|
1,582 sq. feet
|
2 baths 3 beds |
show details | |

|
#25
Hatfield St
Pittsburgh, PA 15201
|
1,798 sq. feet
|
1 baths 2 beds |
show details | |

|
#26
Woodward Ave
Mc Kees Rocks, PA 15136
|
1,958 sq. feet
|
2 baths 6 beds |
show details | |

|
#27
Rodgers St
Pittsburgh, PA 15207
|
2,048 sq. feet
|
2 baths 4 beds |
show details | |

|
#28
Deer Dr
New Kensington, PA 15068
|
2,477 sq. feet
|
3 baths 4 beds |
show details | |

|
#29
Margaret St
Pittsburgh, PA 15210
|
806 sq. feet
|
1 baths 1 beds |
show details | |

|
#30
Bluff St
Pittsburgh, PA 15236
|
1,386 sq. feet
|
1 baths 4 beds |
show details |
| Photo | Address | Area | Beds / Baths | Price | Details |
|---|---|---|---|---|---|

|
#31
Lehr Ave
Pittsburgh, PA 15223
|
1,242 sq. feet
|
1 baths 3 beds |
show details | |

|
#32
Donmor Dr
Pittsburgh, PA 15237
|
1,802 sq. feet
|
1 baths 3 beds |
show details | |

|
#33
Greenway Dr
Pittsburgh, PA 15204
|
956 sq. feet
|
1 baths 3 beds |
show details | |

|
#34
Wilson St
Pittsburgh, PA 15223
|
1,681 sq. feet
|
2 baths 3 beds |
show details | |

|
#35
Walnut Ave
Pittsburgh, PA 15209
|
1,585 sq. feet
|
1 baths 3 beds |
show details | |

|
#36
Washington St
Aliquippa, PA 15001
|
1,800 sq. feet
|
1 baths 3 beds |
show details | |

|
#37
Ohio Ave
West Mifflin, PA 15122
|
2,048 sq. feet
|
3 baths 3 beds |
show details | |

|
#38
Juniata St
Natrona Heights, PA 15065
|
1,080 sq. feet
|
1 baths 2 beds |
show details | |

|
#39
Fort Duquesne Blvd Apt 4a
Pittsburgh, PA 15222
|
1,032 sq. feet
|
1 baths 1 beds |
show details | |

|
#40
Deer Creek Rd
Gibsonia, PA 15044
|
1,734 sq. feet
|
2 baths 3 beds |
show details |
| Photo | Address | Area | Beds / Baths | Price | Details |
|---|---|---|---|---|---|

|
#41
Rich Hill Rd
Cheswick, PA 15024
|
1,550 sq. feet
|
1 baths 3 beds |
show details | |

|
#42
W Steuben St
Pittsburgh, PA 15205
|
4,748 sq. feet
|
3 baths 4 beds |
show details | |

|
#43
Mckenzie Dr
Pittsburgh, PA 15235
|
1,428 sq. feet
|
1 baths 3 beds |
show details | |

|
#44
Washington St
Pittsburgh, PA 15223
|
1,488 sq. feet
|
1 baths 4 beds |
show details | |

|
#45
13th St
Mc Kees Rocks, PA 15136
|
1,404 sq. feet
|
1 baths 3 beds |
show details | |

|
#46
Brownsville Rd
Pittsburgh, PA 15210
|
1,072 sq. feet
|
1 baths 3 beds |
show details | |

|
#47
Wayne Ave
Mc Kees Rocks, PA 15136
|
1,440 sq. feet
|
1 baths 3 beds |
show details | |

|
#48
Woodward Ave
Mc Kees Rocks, PA 15136
|
1,958 sq. feet
|
2 baths 4 beds |
show details | |

|
#49
State St
Baden, PA 15005
|
1,011 sq. feet
|
1 baths 2 beds |
show details | |

|
Check over 1 million property listings on Foreclosure.com!
|
browse all offers | |||

 | 5 People Shot Within 24 Hours In Allegheny County (3431 replies) |
| Pittsburgh best school district (61 replies) |
| Hampton Township (above or below Turnpike and other questions) (14 replies) |
| Suburb of the week: West Deer Township (35 replies) |
| Asian family looking for your advice to find a house (53 replies) |
| Why live in Hampton Township? (72 replies) |
Household type by relationship:
Households: 1,188,294- In family households: 913,516 (208,635 male householders, 99,374 female householders)
222,332 spouses, 315,393 children (298,168 natural, 7,619 adopted, 9,606 stepchildren), 18,457 grandchildren, 9,985 brothers or sisters, 8,652 parents, foster children, 7,846 other relatives, 18,452 non-relatives
- In nonfamily households: 274,778 (100,758 male householders (79,382 living alone)), 125,193 female householders (107,576 living alone)), 48,827 nonrelatives
- In group quarters: 35,054 (13,287 institutionalized population)
186,963 married couples with children.
71,829 single-parent households (11,403 men, 60,426 women).
95.9% of residents of Hampton Township speak English at home.
0.5% of residents speak Spanish at home (67% speak English very well, 7% speak English well, 27% speak English not well).
2.3% of residents speak other Indo-European language at home (77% speak English very well, 12% speak English well, 10% speak English not well).
1.0% of residents speak Asian or Pacific Island language at home (52% speak English very well, 28% speak English well, 20% speak English not well).
0.1% of residents speak other language at home (100% speak English very well).
Foreign born population: 647 (3.8%)
(54.4% of them are naturalized citizens)
| Here: | 7.8 |
| State: | 6.8 |
| Here: | 5.1 |
| State: | 4.3 |
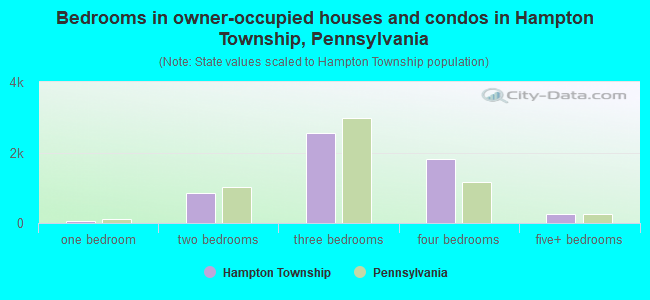
- Bedrooms in owner-occupied houses and condos in Hampton Township, Pennsylvania
- 0no bedroom
- 621 bedroom
- 8422 bedrooms
- 2,5653 bedrooms
- 1,8274 bedrooms
- 2525+ bedrooms
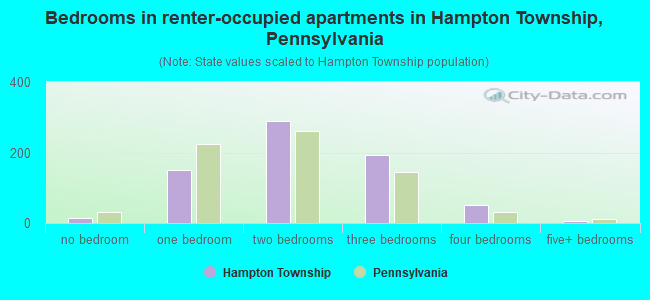
- Bedrooms in renter-occupied apartments in Hampton Township, Pennsylvania
- 15no bedroom
- 1511 bedroom
- 2882 bedrooms
- 1923 bedrooms
- 524 bedrooms
- 75+ bedrooms
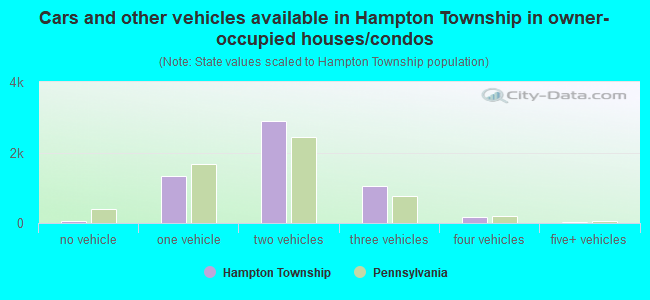
- Cars and other vehicles available in Hampton Township in owner-occupied houses/condos
- 68no vehicle
- 1,3341 vehicle
- 2,9022 vehicles
- 1,0533 vehicles
- 1654 vehicles
- 265+ vehicles
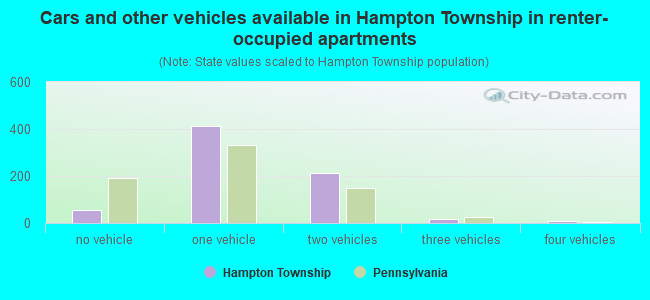
- Cars and other vehicles available in Hampton Township in renter-occupied apartments
- 54no vehicle
- 4141 vehicle
- 2122 vehicles
- 153 vehicles
- 104 vehicles
- 05+ vehicles
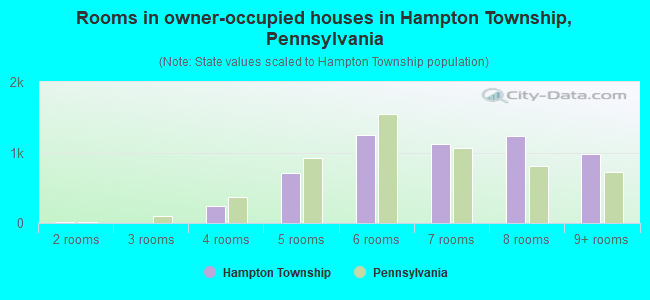
- Rooms in owner-occupied houses in Hampton Township, Pennsylvania
- 01 room
- 102 rooms
- 03 rooms
- 2374 rooms
- 7105 rooms
- 1,2556 rooms
- 1,1257 rooms
- 1,2338 rooms
- 9789+ rooms
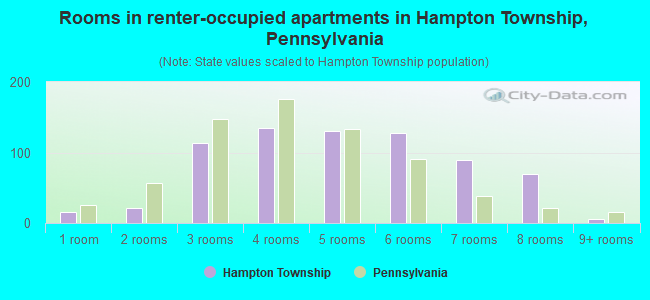
- Rooms in renter-occupied apartments in Hampton Township, Pennsylvania
- 151 room
- 212 rooms
- 1133 rooms
- 1354 rooms
- 1305 rooms
- 1276 rooms
- 907 rooms
- 698 rooms
- 59+ rooms
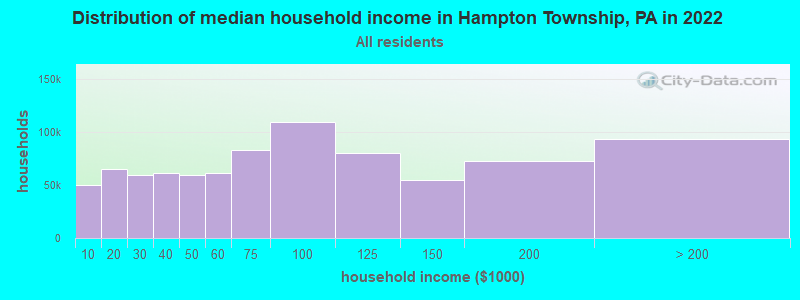
Hampton Township, PA household income distribution

- 49,765Less than $10,000
- 65,304$10,000 to $19,999
- 59,417$20,000 to $29,999
- 61,499$30,000 to $39,999
- 59,112$40,000 to $49,999
- 61,127$50,000 to $59,999
- 82,769$60,000 to $74,999
- 109,142$75,000 to $99,999
- 79,647$100,000 to $124,999
- 54,636$125,000 to $149,999
- 72,765$150,000 to $199,999
- 92,881$200,000 or more
Percentage of workers working in this county: 89.3%
Number of people working at home: 1,919 (20.9% of all workers)
Travel time to work (commute)
- Less than 5 minutes: 147
- 5 to 9 minutes: 777
- 10 to 14 minutes: 1,051
- 15 to 19 minutes: 822
- 20 to 24 minutes: 1,174
- 25 to 29 minutes: 612
- 30 to 34 minutes: 1,597
- 35 to 39 minutes: 316
- 40 to 44 minutes: 498
- 45 to 59 minutes: 827
- 60 to 89 minutes: 376
- 90 or more minutes: 99
Means of transportation to work:
- Drove a car alone: 7,211 (84.6%)
- Carpooled: 688 (8.1%)
- Bus or trolley bus: 277 (3.2%)
- Taxi: 7 (0.1%)
- Walked: 80 (0.9%)
- Other means: 33 (0.4%)
- Worked at home: 230 (2.7%)
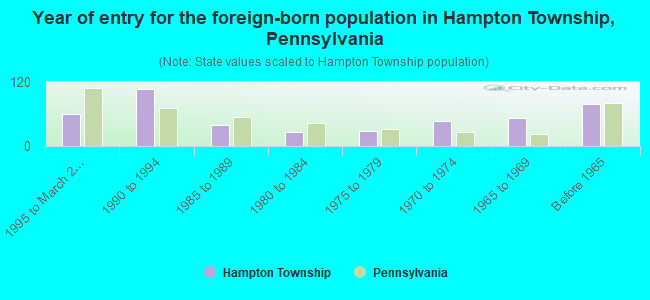
- Year of entry for the foreign-born population in Hampton Township, Pennsylvania
- 601995 to March 2000
- 1071990 to 1994
- 391985 to 1989
- 261980 to 1984
- 291975 to 1979
- 471970 to 1974
- 521965 to 1969
- 78Before 1965
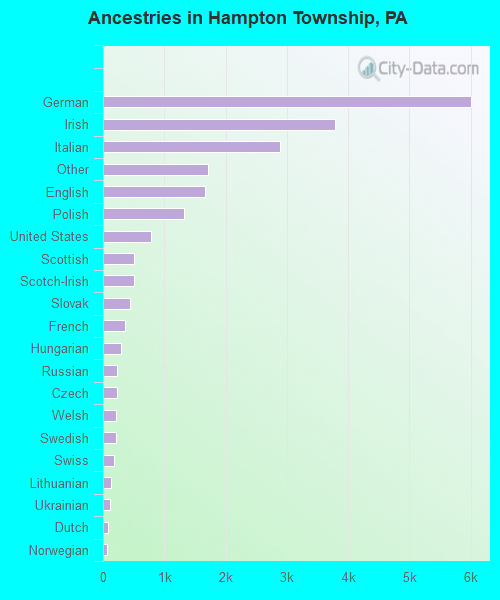
First ancestries reported:
- German: 6,001 (27.5%)
- Irish: 3,785 (17.3%)
- Italian: 2,887 (13.2%)
- Other: 1,714 (7.9%)
- English: 1,662 (7.6%)
- Polish: 1,322 (6.1%)
- United States: 779 (3.6%)
- Scottish: 508 (2.3%)
- Scotch-Irish: 502 (2.3%)
- Slovak: 436 (2.0%)
- French: 353 (1.6%)
- Hungarian: 292 (1.3%)
- Russian: 236 (1.1%)
- Czech: 227 (1.0%)
- Welsh: 217 (1.0%)
- Swedish: 207 (0.9%)
- Swiss: 176 (0.8%)
- Lithuanian: 124 (0.6%)
- Ukrainian: 110 (0.5%)
- Dutch: 89 (0.4%)
- Norwegian: 68 (0.3%)
- Greek: 50 (0.2%)
- French Canadian: 29 (0.1%)
- Arab: 21 (0.10%)
- West Indian: 14 (0.06%)
- Danish: 7 (0.03%)
Most common places of birth for foreign-born residents (%):
| Hampton Township: | 15.3% (67) |
| Pennsylvania: | 7.4% (37,541) |
| Hampton Township: | 13.5% (59) |
| Pennsylvania: | 6.0% (30,559) |
| Hampton Township: | 10.3% (45) |
| Pennsylvania: | 5.3% (26,703) |
| Hampton Township: | 9.1% (40) |
| Pennsylvania: | 5.1% (25,685) |
| Hampton Township: | 7.5% (33) |
| Pennsylvania: | 4.6% (23,171) |
| Hampton Township: | 7.1% (31) |
| Pennsylvania: | 3.0% (15,200) |
| Hampton Township: | 5.9% (26) |
| Pennsylvania: | 4.6% (23,478) |
| Hampton Township: | 5.5% (24) |
| Pennsylvania: | 1.1% (5,442) |
| Hampton Township: | 3.7% (16) |
| Pennsylvania: | 0.4% (2,023) |
| Hampton Township: | 3.2% (14) |
| Pennsylvania: | 0.8% (4,181) |
| Hampton Township: | 3.2% (14) |
| Pennsylvania: | 2.4% (12,390) |
| Hampton Township: | 3.0% (13) |
| Pennsylvania: | 0.7% (3,762) |
| Hampton Township: | 2.5% (11) |
| Pennsylvania: | 0.7% (3,451) |
| Hampton Township: | 2.3% (10) |
| Pennsylvania: | 0.2% (1,095) |
| Hampton Township: | 2.1% (9) |
| Pennsylvania: | 1.4% (7,362) |
| Hampton Township: | 1.8% (8) |
| Pennsylvania: | 2.2% (11,411) |
| Hampton Township: | 1.8% (8) |
| Pennsylvania: | 0.5% (2,475) |
Place of birth for U.S.-born residents:
- This state: 14,289
- Other state: 2,758
- Northeast: 698
- Midwest: 987
- South: 796
- West: 277
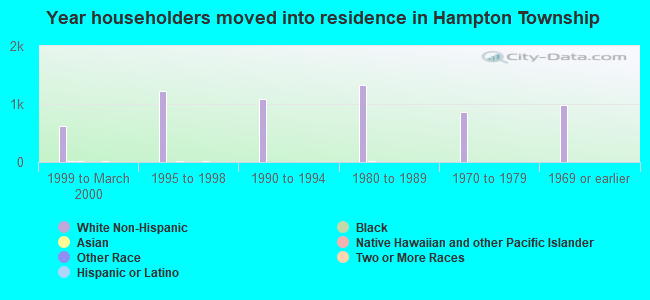
69% of Hampton Township residents lived in the same house 5 years ago.
Out of people who lived in different houses, 70% lived in this county.
Out of people who lived in different counties, 31% lived in Pennsylvania.
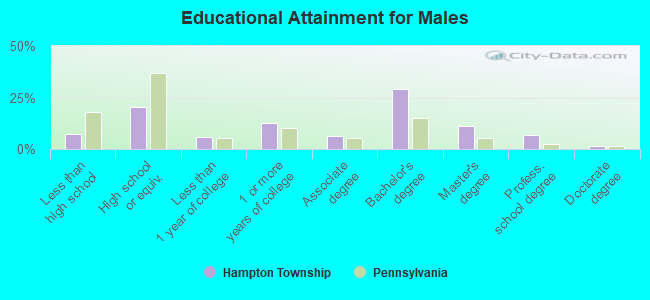
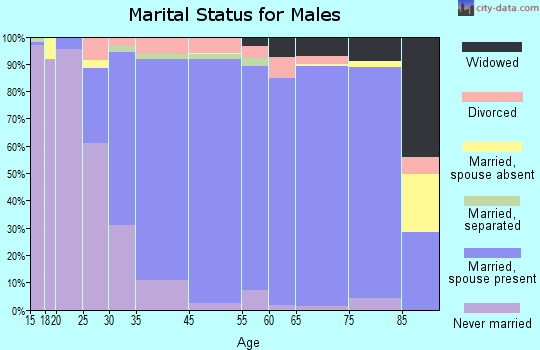
Education attainment for males 25 years and older:
- No schooling: 7
- Nursery to 4th grade: 0
- 5th and 6th grade: 11
- 7th and 8th grade: 133
- 9th grade: 26
- 10th grade: 83
- 11th grade: 35
- 12th grade, no diploma: 98
- High school graduate (or equivalency): 1,134
- Less than 1 year of college: 314
- Some college more than 1 year, no degree: 691
- Associate degree: 351
- Bachelor's degree: 1,617
- Master's degree: 624
- Professional school degree: 369
- Doctorate degree: 78
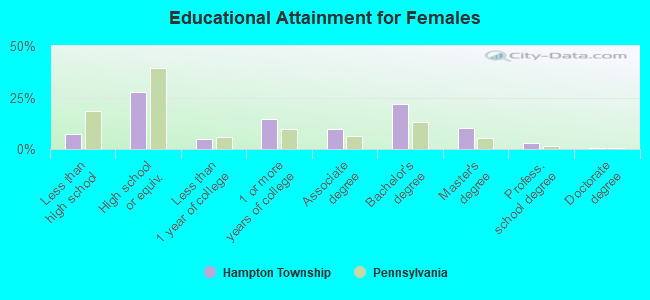
Education attainment for females 25 years and older:
- No schooling: 35
- Nursery to 4th grade: 13
- 5th and 6th grade: 16
- 7th and 8th grade: 98
- 9th grade: 65
- 10th grade: 111
- 11th grade: 43
- 12th grade, no diploma: 64
- High school graduate (or equivalency): 1,699
- Less than 1 year of college: 312
- Some college more than 1 year, no degree: 892
- Associate degree: 612
- Bachelor's degree: 1,338
- Master's degree: 626
- Professional school degree: 193
- Doctorate degree: 41
Housing units in structures:
- One, detached: 5,395
- One, attached: 706
- Two: 57
- 3 or 4: 34
- 5 to 9: 105
- 10 to 19: 146
- 20 to 49: 22
- 50 or more: 138
- Mobile homes: 24
Median worth of mobile homes: $117,471
Housing units lacking complete kitchen facilities: 2.4%
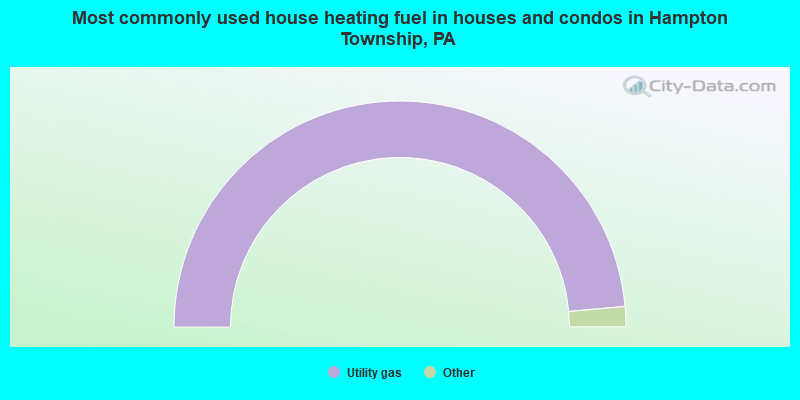
- 97.1%Utility gas
- 2.6%Electricity
- 0.2%Wood
- 0.1%Fuel oil, kerosene, etc.
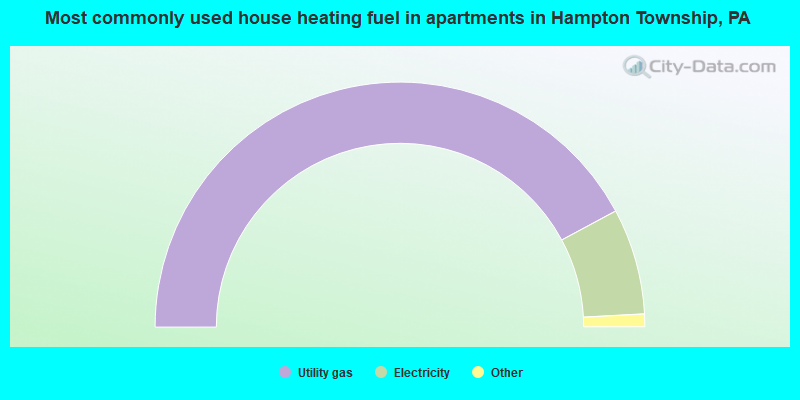
- 84.3%Utility gas
- 14.0%Electricity
- 0.9%Bottled, tank, or LP gas
- 0.9%Fuel oil, kerosene, etc.
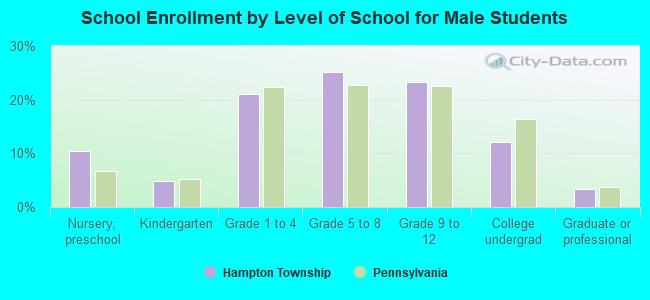
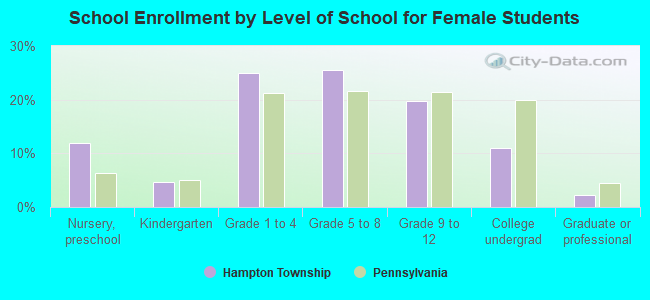
Private vs. public school enrollment:
| Here: | 18.5% |
| Pennsylvania: | 16.0% |
| Here: | 5.8% |
| Pennsylvania: | 13.1% |
| Here: | 20.8% |
| Pennsylvania: | 37.3% |