Hanahan, SC (South Carolina) Houses and Residents
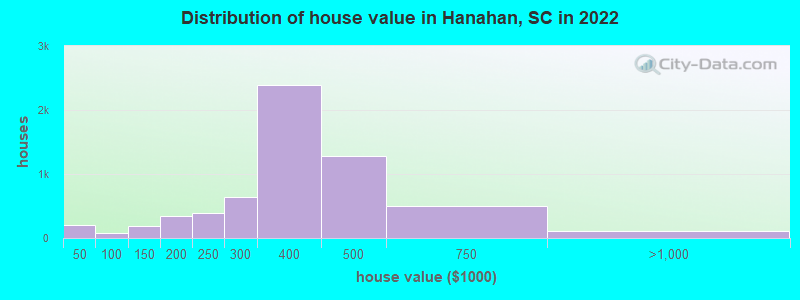
Estimated median house or condo value in 2022: $382,787 (it was $99,300 in 2000 )
Hanahan:
$382,787South Carolina:
$254,600
Lower value quartile - upper value quartile: $248,565 - $439,391Mean price in 2022: Detached houses: $324,741 Here:
$324,741State:
$368,255
Townhouses or other attached units: $192,241 Here:
$192,241State:
$292,023
In 5-or-more-unit structures: $137,244 Here:
$137,244State:
$326,361
Mobile homes: $171,747 Here:
$171,747State:
$102,531
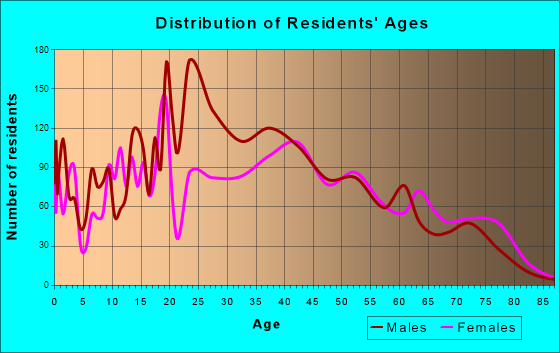
Total population: 19,865 (Urban population: 12,071, Rural population: 819 (all nonfarm) )
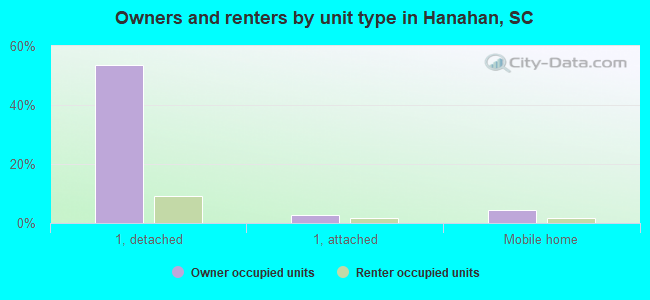
Houses: 8,550 (7,846 occupied: 5,421 owner occupied, 2,558 renter occupied )
% of renters here:
32%State:
28%
Housing density: 849 houses/condos per square mile
Median price asked for vacant for-sale houses and condos in 2022: $121,828.
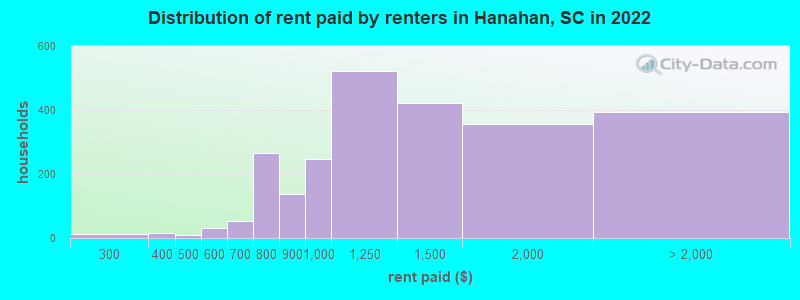
Median contract rent in 2022: $1,266 (lower quartile is $1,057, upper quartile is $1,647)
Median rent asked for vacant for-rent units in 2022: $1,104
Median gross rent in Hanahan, SC in 2022: $1,420
Housing units in Hanahan with a mortgage: 3,977 (192 second mortgage, 19 home equity loan, 137 both second mortgage and home equity loan )Houses without a mortgage: 353
Median household income for houses/condos with a mortgage: $112,430
Median household income for apartments without a mortgage: $62,539
Median monthly housing costs: $1,419
Data:
Median house or condo value ($)
Median house or condo value ($ change since 2000)
Median house or condo value ($) - White
Median house or condo value ($) - Black or African American
Median house or condo value ($) - Asian
Median house or condo value ($) - Hispanic or Latino
Median house or condo value ($) - American Indian and Alaska Native
Median house or condo value ($) - Multirace
Median house or condo value ($) - Other Race
Median price asked for mobile homes ($)
Household density (households per square mile)
Mean house or condo value by units in structure - 1, detached ($)
Mean house or condo value by units in structure - 1, attached ($)
Mean house or condo value by units in structure - 2 ($)
Mean house or condo value by units in structure by units in structure - 3 or 4 ($)
Mean house or condo value by units in structure - 5 or more ($)
Mean house or condo value by units in structure - Boat, RV, van, etc. ($)
Mean house or condo value by units in structure - Mobile home ($)
Median contract rent ($)
Median contract rent - Lower quartile ($)
Median contract rent - Upper quartile ($)
Median gross rent ($)
Urban houses (%)
Rural houses (%)
Houses occupied (%)
Houses occupied (% change since 2000)
Houses owner occupied (%)
Houses owner occupied (% change since 2000)
Houses renter occupied (%)
Houses renter occupied (% change since 2000)
Vacant housing units - For rent (%)
Vacant housing units - For rent (% change since 2000)
Vacant housing units - For sale only (%)
Vacant housing units - For sale only (% change since 2000)
Vacant housing units - Rented or sold, not occupied (%)
Vacant housing units - Rented or sold, not occupied (% change since 2000)
Vacant housing units - For seasonal, recreational, or occasional use (%)
Vacant housing units - For seasonal, recreational, or occasional use (% change since 2000)
Vacant housing units - For migrant workers (%)
Vacant housing units - For migrant workers (% change since 2000)
Vacant housing units - Other vacant (%)
Vacant housing units - Other vacant (% change since 2000)
Median monthly housing costs ($)
Median household income for houses/condos with a mortgage ($)
Median household income for houses/condos without a mortgage ($)
Median household income ($)
Median household income ($) - White
Median household income ($) - Black or African American
Median household income ($) - Asian
Median household income ($) - Hispanic or Latino
Median household income ($) - American Indian and Alaska Native
Median household income ($) - Multirace
Median household income ($) - Other Race
Mortgage status - with mortgage (%)
Mortgage status - with second mortgage (%)
Mortgage status - with home equity loan (%)
Mortgage status - with both second mortgage and home equity loan (%)
Mortgage status - without a mortgage (%)
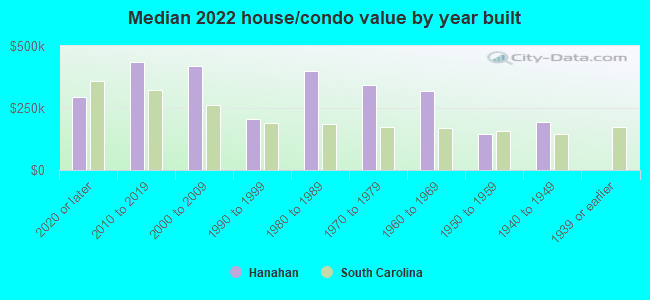
Median year house/condo built
Median year apartment built
Household type by relationship - Male householder living alone (%)
Household type by relationship - Male householder not living alone (%)
Household type by relationship - Female householder living alone (%)
Household type by relationship - Female householder not living alone (%)
Household type by relationship - Opposite-Sex spouse (%)
Household type by relationship - Same-Sex spouse (%)
Household type by relationship - Opposite-Sex unmarried partner (%)
Household type by relationship - Same-Sex unmarried partner (%)
Household type by relationship - In group quarters (%)
Size of family households - 2-person household (%)
Size of family households - 3-person household (%)
Size of family households - 4-person household (%)
Size of family households - 5-person household (%)
Size of family households - 6-person household (%)
Size of family households - 7-or-more-person household (%)
Size of nonfamily households - 1-person household (%)
Size of nonfamily households - 2-person household (%)
Size of nonfamily households - 3-person household (%)
Size of nonfamily households - 4-person household (%)
Size of nonfamily households - 5-person household (%)
Size of nonfamily households - 6-person household (%)
Size of nonfamily households - 7-or-moreperson household (%)
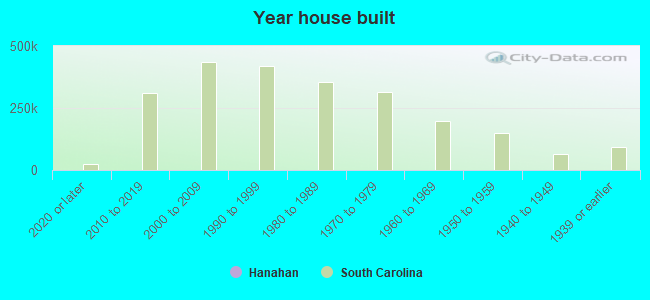
Year house built - Built 2010 or later (%)
Year house built - Built 2000 to 2009 (%)
Year house built - Built 1990 to 1999 (%)
Year house built - Built 1980 to 1989 (%)
Year house built - Built 1970 to 1979 (%)
Year house built - Built 1960 to 1969 (%)
Year house built - Built 1950 to 1959 (%)
Year house built - Built 1940 to 1949 (%)
Year house built - Built 1939 or earlier (%)
Median number of rooms in houses and condos
Median number of rooms in apartments
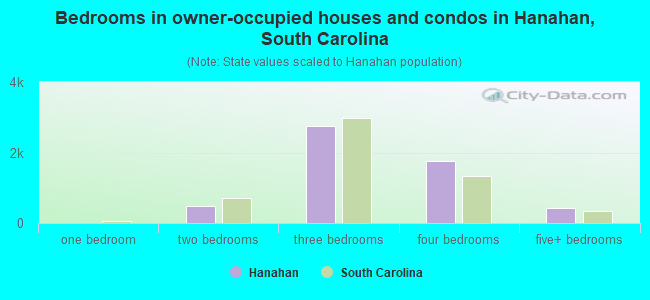
Median number of bedrooms in owner occupied houses
Mean number of bedrooms in owner occupied houses
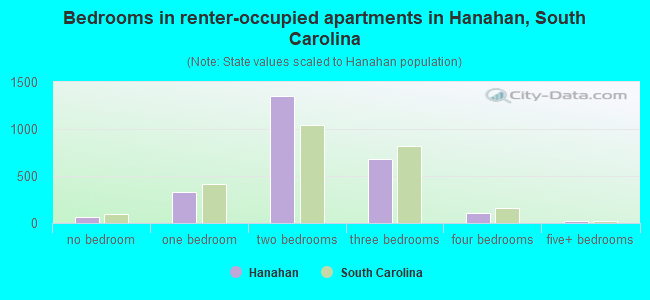
Median number of bedrooms in renter occupied houses
Mean number of bedrooms in renter occupied houses
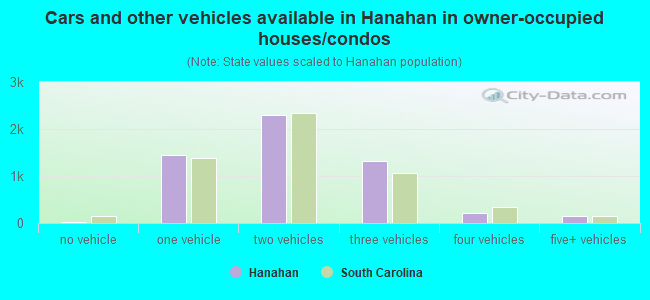
Median number of vehichles in owner occupied houses
Mean number of vehichles in owner occupied houses
Median number of vehichles in renter occupied houses
Mean number of vehichles in renter occupied houses
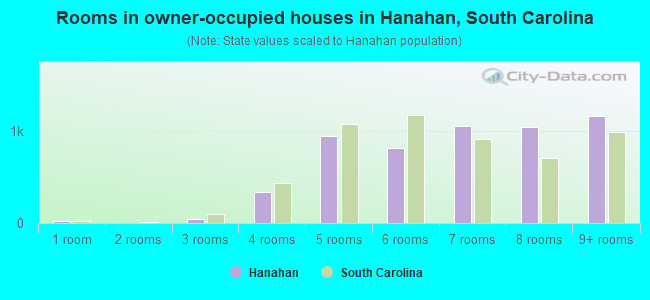
Rooms in owner-occupied houses - 1 room (%)
Rooms in owner-occupied houses - 2 rooms (%)
Rooms in owner-occupied houses - 3 rooms (%)
Rooms in owner-occupied houses - 4 rooms (%)
Rooms in owner-occupied houses - 5 rooms (%)
Rooms in owner-occupied houses - 6 rooms (%)
Rooms in owner-occupied houses - 7 rooms (%)
Rooms in owner-occupied houses - 8 rooms (%)
Rooms in owner-occupied houses - 9+ rooms (%)
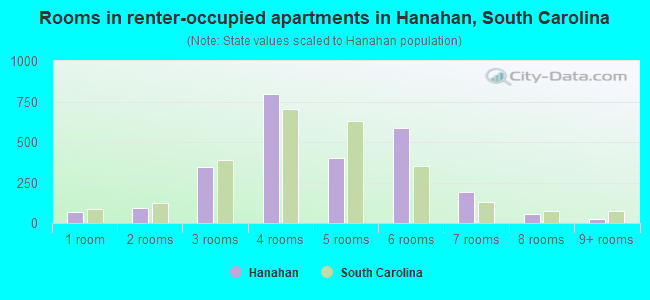
Rooms in renter-occupied houses - 1 room (%)
Rooms in renter-occupied houses - 2 rooms (%)
Rooms in renter-occupied houses - 3 rooms (%)
Rooms in renter-occupied houses - 4 rooms (%)
Rooms in renter-occupied houses - 5 rooms (%)
Rooms in renter-occupied houses - 6 rooms (%)
Rooms in renter-occupied houses - 7 rooms (%)
Rooms in renter-occupied houses - 8 rooms (%)
Rooms in renter-occupied houses - 9+ rooms (%)
Bedrooms in owner-occupied houses - no bedrooms (%)
Bedrooms in owner-occupied houses - 1 bedroom (%)
Bedrooms in owner-occupied houses - 2 bedrooms (%)
Bedrooms in owner-occupied houses - 3 bedrooms (%)
Bedrooms in owner-occupied houses - 4 bedrooms (%)
Bedrooms in owner-occupied houses - 5+ bedrooms (%)
Bedrooms in renter-occupied houses - no bedrooms (%)
Bedrooms in renter-occupied houses - 1 bedroom (%)
Bedrooms in renter-occupied houses - 2 bedrooms (%)
Bedrooms in renter-occupied houses - 3 bedrooms (%)
Bedrooms in renter-occupied houses - 4 bedrooms (%)
Bedrooms in renter-occupied houses - 5+ bedrooms (%)
Vehicles available in owner-occupied houses - no vehicle available (%)
Vehicles available in owner-occupied houses - 1 vehicle available(%)
Vehicles available in owner-occupied houses - 2 Vehicles available (%)
Vehicles available in owner-occupied houses - 3 Vehicles available (%)
Vehicles available in owner-occupied houses - 4 Vehicles available (%)
Vehicles available in owner-occupied houses - 5+ Vehicles available (%)
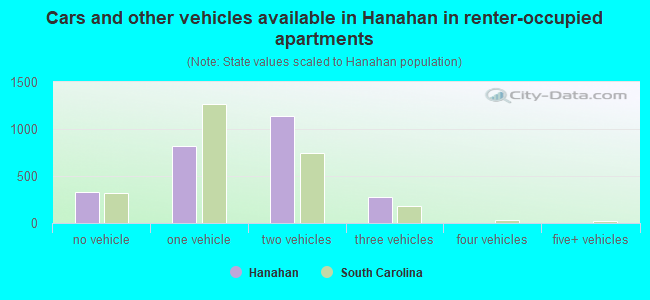
Vehicles available in renter-occupied houses - no vehicle available (%)
Vehicles available in renter-occupied houses - 1 vehicle available (%)
Vehicles available in renter-occupied houses - 2 Vehicles available (%)
Vehicles available in renter-occupied houses - 3 Vehicles available (%)
Vehicles available in renter-occupied houses - 4 Vehicles available (%)
Vehicles available in renter-occupied houses - 5+ Vehicles available (%)
Housing units in structures - 1, detached (%)
Housing units in structures - 1, attached (%)
Housing units in structures - 2 (%)
Housing units in structures - 3 or 4 (%)
Housing units in structures - 5 to 9 (%)
Housing units in structures - 10 to 19 (%)
Housing units in structures - 20 to 49 (%)
Housing units in structures - 50 or more (%)
Housing units in structures - Mobile home (%)
Housing units in structures - Boat, RV, van, etc. (%)
Housing units in structures - Owners - 1, detached (%)
Housing units in structures - Owners - 1, attached (%)
Housing units in structures - Owners - 2 (%)
Housing units in structures - Owners - 3 or 4 (%)
Housing units in structures - Owners - 5 to 9 (%)
Housing units in structures - Owners - 10 to 19 (%)
Housing units in structures - Owners - 20 to 49 (%)
Housing units in structures - Owners - 50 or more (%)
Housing units in structures - Owners - Mobile home (%)
Housing units in structures - Owners - Boat, RV, van, etc. (%)
Housing units in structures - Renters - 1, detached (%)
Housing units in structures - Renters - 1, attached (%)
Housing units in structures - Renters - 2 (%)
Housing units in structures - Renters - 3 or 4 (%)
Housing units in structures - Renters - 5 to 9 (%)
Housing units in structures - Renters - 10 to 19 (%)
Housing units in structures - Renters - 20 to 49 (%)
Housing units in structures - Renters - 50 or more (%)
Housing units in structures - Renters - Mobile home (%)
Housing units in structures - Renters - Boat, RV, van, etc. (%)
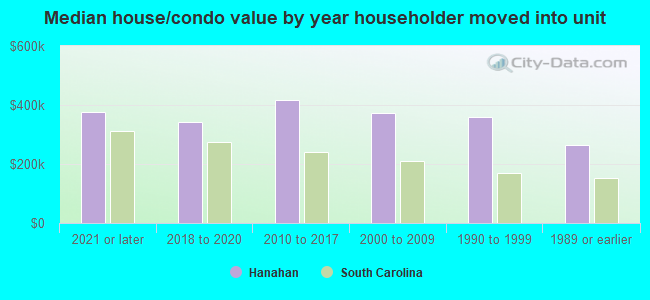
House/condo owner moved in on average (years ago)
Renter moved in on average (years ago)
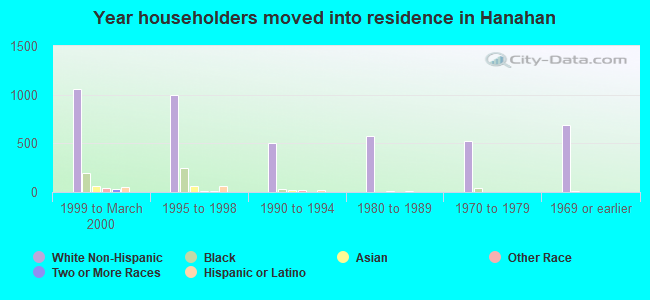
Year householder moved into unit - Moved in 1999 to March 2000 (%)
Year householder moved into unit - Moved in 1999 to March 2000 (%) - White
Year householder moved into unit - Moved in 1999 to March 2000 (%) - Black or African American
Year householder moved into unit - Moved in 1999 to March 2000 (%) - Asian
Year householder moved into unit - Moved in 1999 to March 2000 (%) - Hispanic or Latino
Year householder moved into unit - Moved in 1999 to March 2000 (%) - American Indian and Alaska Native
Year householder moved into unit - Moved in 1999 to March 2000 (%) - Multirace
Year householder moved into unit - Moved in 1999 to March 2000 (%) - Other Race
Year householder moved into unit - Moved in 1995 to 1998 (%)
Year householder moved into unit - Moved in 1995 to 1998 (%) - White
Year householder moved into unit - Moved in 1995 to 1998 (%) - Black or African American
Year householder moved into unit - Moved in 1995 to 1998 (%) - Asian
Year householder moved into unit - Moved in 1995 to 1998 (%) - Hispanic or Latino
Year householder moved into unit - Moved in 1995 to 1998 (%) - American Indian and Alaska Native
Year householder moved into unit - Moved in 1995 to 1998 (%) - Multirace
Year householder moved into unit - Moved in 1995 to 1998 (%) - Other Race
Year householder moved into unit - Moved in 1990 to 1994 (%)
Year householder moved into unit - Moved in 1990 to 1994 (%) - White
Year householder moved into unit - Moved in 1990 to 1994 (%) - Black or African American
Year householder moved into unit - Moved in 1990 to 1994 (%) - Asian
Year householder moved into unit - Moved in 1990 to 1994 (%) - Hispanic or Latino
Year householder moved into unit - Moved in 1990 to 1994 (%) - American Indian and Alaska Native
Year householder moved into unit - Moved in 1990 to 1994 (%) - Multirace
Year householder moved into unit - Moved in 1990 to 1994 (%) - Other Race
Year householder moved into unit - Moved in 1980 to 1989 (%)
Year householder moved into unit - Moved in 1980 to 1989 (%) - White
Year householder moved into unit - Moved in 1980 to 1989 (%) - Black or African American
Year householder moved into unit - Moved in 1980 to 1989 (%) - Asian
Year householder moved into unit - Moved in 1980 to 1989 (%) - Hispanic or Latino
Year householder moved into unit - Moved in 1980 to 1989 (%) - American Indian and Alaska Native
Year householder moved into unit - Moved in 1980 to 1989 (%) - Multirace
Year householder moved into unit - Moved in 1980 to 1989 (%) - Other Race
Year householder moved into unit - Moved in 1970 to 1979 (%)
Year householder moved into unit - Moved in 1970 to 1979 (%) - White
Year householder moved into unit - Moved in 1970 to 1979 (%) - Black or African American
Year householder moved into unit - Moved in 1970 to 1979 (%) - Asian
Year householder moved into unit - Moved in 1970 to 1979 (%) - Hispanic or Latino
Year householder moved into unit - Moved in 1970 to 1979 (%) - American Indian and Alaska Native
Year householder moved into unit - Moved in 1970 to 1979 (%) - Multirace
Year householder moved into unit - Moved in 1970 to 1979 (%) - Other Race
Year householder moved into unit - Moved in 1969 or earlier (%)
Year householder moved into unit - Moved in 1969 or earlier (%) - White
Year householder moved into unit - Moved in 1969 or earlier (%) - Black or African American
Year householder moved into unit - Moved in 1969 or earlier (%) - Asian
Year householder moved into unit - Moved in 1969 or earlier (%) - Hispanic or Latino
Year householder moved into unit - Moved in 1969 or earlier (%) - American Indian and Alaska Native
Year householder moved into unit - Moved in 1969 or earlier (%) - Multirace
Year householder moved into unit - Moved in 1969 or earlier (%) - Other Race
Housing units lacking complete plumbing facilities (%)
Housing units lacking complete kitchen facilities (%)
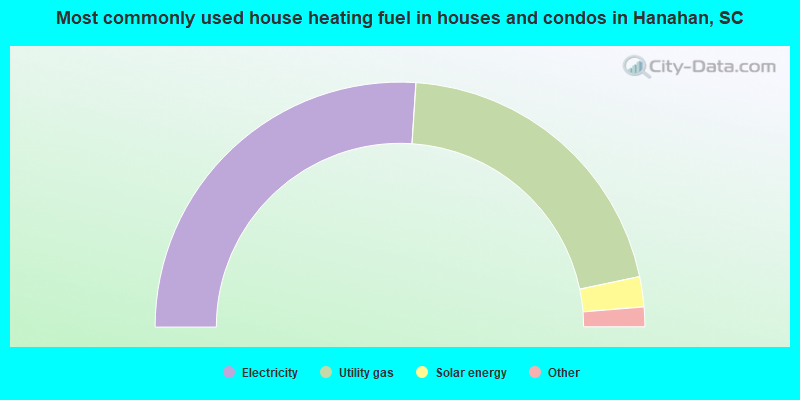
House heating fuel used in houses and condos - Utility gas (%)
House heating fuel used in houses and condos - Bottled, tank, or LP gas (%)
House heating fuel used in houses and condos - Electricity (%)
House heating fuel used in houses and condos - Fuel oil, kerosene, etc. (%)
House heating fuel used in houses and condos - Coal or coke (%)
House heating fuel used in houses and condos - Wood (%)
House heating fuel used in houses and condos - Solar energy (%)
House heating fuel used in houses and condos - Other fuel (%)
House heating fuel used in houses and condos - No fuel used (%)
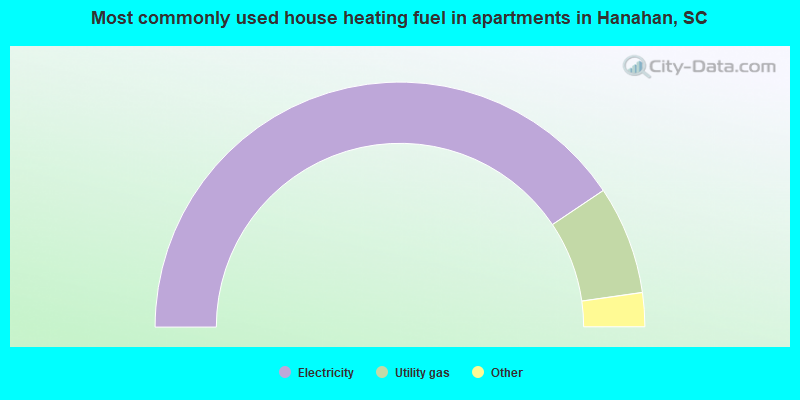
House heating fuel used in apartments - Utility gas (%)
House heating fuel used in apartments - Bottled, tank, or LP gas (%)
House heating fuel used in apartments - Electricity (%)
House heating fuel used in apartments - Fuel oil, kerosene, etc. (%)
House heating fuel used in apartments - Coal or coke (%)
House heating fuel used in apartments - Wood (%)
House heating fuel used in apartments - Solar energy (%)
House heating fuel used in apartments - Other fuel (%)
House heating fuel used in apartments - No fuel used (%)
Latest news about housing in Hanahan, SC collected exclusively by city-data.com from local newspapers, TV, and radio stations
Median year house/condo built: 1996Median year apartment built: 1990Household type by relationship:
Households: 21,958
Male householders: 3,642 (736 living alone ), Female householders: 4,153 (1,110 living alone )4,143 spouses (4,119 opposite-sex spouses ), 716 unmarried partners , (716 opposite-sex unmarried partners ), 6,676 children (6,249 natural , 164 adopted , 262 stepchildren ), 681 grandchildren , 319 brothers or sisters , 415 parents , 0 foster children , 244 other relatives , 830 non-relatives In group quarters: 135
Size of family households: 2,187 2-persons , 1,060 3-persons , 1,210 4-persons , 608 5-persons , 134 6-persons , 135 7-or-more-persons .
Size of nonfamily households: 1,876 1-person , 517 2-persons , 212 3-persons .
4,001 married couples with children. single-parent households (173 men , 756 women ).
86.5% of residents of Hanahan speak English at home. of residents speak Spanish at home (68% speak English very well , 20% speak English well , 10% speak English not well , 2% don't speak English at all ).of residents speak other Indo-European language at home (59% speak English very well , 12% speak English well , 24% speak English not well , 5% don't speak English at all ).of residents speak Asian or Pacific Island language at home (66% speak English very well , 24% speak English well , 6% speak English not well , 3% don't speak English at all ).of residents speak other language at home (100% speak English very well ).
Foreign born population: 1,622 (7.4%)of them are naturalized citizens )
Median number of rooms in houses and condos:
Median number of rooms in apartments
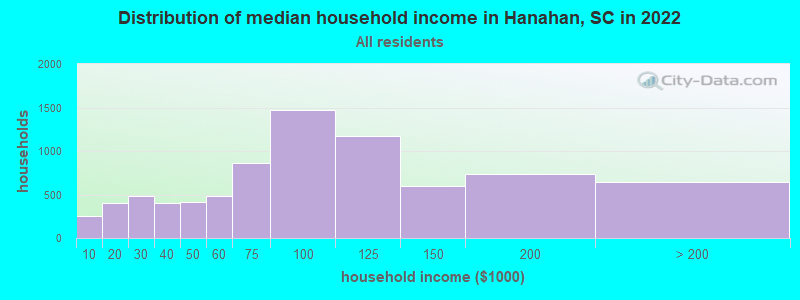
Hanahan, SC household income distribution 255 Less than $10,000405 $10,000 to $19,999488 $20,000 to $29,999403 $30,000 to $39,999411 $40,000 to $49,999480 $50,000 to $59,999867 $60,000 to $74,9991,472 $75,000 to $99,9991,172 $100,000 to $124,999600 $125,000 to $149,999730 $150,000 to $199,999648 $200,000 or more
Home value of owner - occupied houses in 2022 in Hanahan, SC 67 Less than $10,00016 $10,000 to $14,99960 $15,000 to $19,99917 $20,000 to $24,99939 $25,000 to $29,99934 $50,000 to $59,99919 $70,000 to $79,99921 $90,000 to $99,999114 $100,000 to $124,99968 $125,000 to $149,999206 $150,000 to $174,999137 $175,000 to $199,999394 $200,000 to $249,999636 $250,000 to $299,9992,386 $300,000 to $399,9991,282 $400,000 to $499,999505 $500,000 to $749,99968 $750,000 to $999,9999 $1,000,000 to $1,499,99925 $2,000,000 or moreRent paid by renters in 2022 in Hanahan, SC 11 $250 to $29915 $350 to $3997 $450 to $49930 $550 to $5991 $600 to $64953 $650 to $699121 $700 to $749145 $750 to $799138 $800 to $899246 $900 to $999521 $1,000 to $1,249422 $1,250 to $1,499355 $1,500 to $1,999128 $2,000 to $2,4993 $3,500 or more261 No cash rent
Percentage of workers working in this county: 38.0%Number of people working at home: 1,158 (10.7% of all workers )
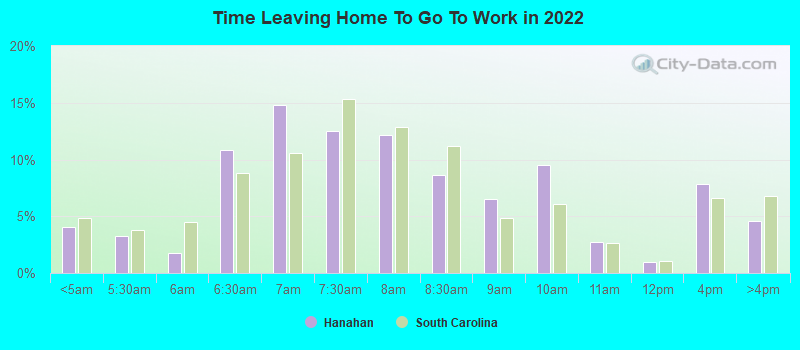
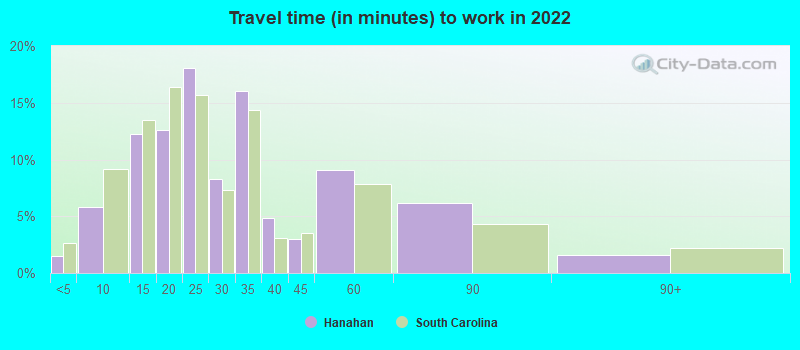
Travel time to work (commute)
Less than 5 minutes: 355 to 9 minutes: 62710 to 14 minutes: 1,17915 to 19 minutes: 2,02120 to 24 minutes: 1,69825 to 29 minutes: 1,23130 to 34 minutes: 1,71235 to 39 minutes: 27140 to 44 minutes: 30245 to 59 minutes: 48660 to 89 minutes: 35990 or more minutes: 126
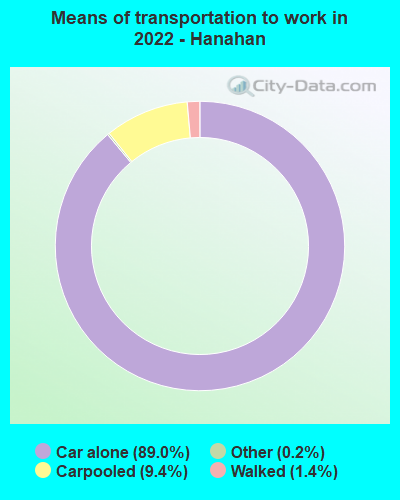
Means of transportation to work:
Drove a car alone: 4,791 (74.3%)Carpooled: 529 (8.2%)Taxi: 12 (0.2%)Walked: 70 (1.1%)Worked at home: 1,158 (17.9%)
Unemployment by race in 2022
Unemployment rate for White non-Hispanic residents 1.6% Males1.0% FemalesUnemployment rate for Asian residents 13.9% FemalesUnemployment rate for other race residents 0.8% MalesUnemployment rate for Hispanic or Latino residents 0.5% Males2.1% Females
Year of entry for the foreign-born population in Hanahan, South Carolina
652 2010 or later 406 2000 to 2009 331 1990 to 1999 143 1980 to 1989 58 1970 to 1979 69 Before 1970
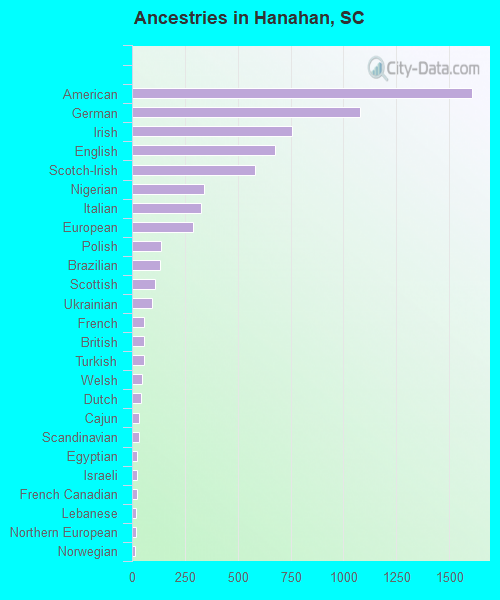
First ancestries reported:
American: 1,608 (15.7%)
German: 1,076 (10.5%)
Irish: 758 (7.4%)
English: 676 (6.6%)
Scotch-Irish: 583 (5.7%)
Nigerian: 339 (3.3%)
Italian: 327 (3.2%)
European: 287 (2.8%)
Polish: 135 (1.3%)
Brazilian: 134 (1.3%)
Scottish: 110 (1.1%)
Ukrainian: 94 (0.9%)
French: 57 (0.6%)
British: 56 (0.5%)
Turkish: 56 (0.5%)
Welsh: 47 (0.5%)
Dutch: 43 (0.4%)
Cajun: 33 (0.3%)
Scandinavian: 33 (0.3%)
Egyptian: 25 (0.2%)
Israeli: 23 (0.2%)
French Canadian: 22 (0.2%)
Lebanese: 18 (0.2%)
Northern European: 18 (0.2%)
Norwegian: 16 (0.2%)
Moroccan: 12 (0.1%)
Eastern European: 11 (0.1%)
Slovak: 11 (0.1%)
Swedish: 10 (0.10%)
Lithuanian: 7 (0.07%)
Canadian: 6 (0.06%) Most common places of birth for foreign-born residents (%): Mexico Hanahan:
22.5% (399)South Carolina:
22.5% (60,774)
Venezuela Hanahan:
13.6% (241)South Carolina:
1.4% (3,822)
Nigeria Hanahan:
12.6% (223)South Carolina:
0.6% (1,652)
Philippines Hanahan:
6.5% (115)South Carolina:
4.1% (11,031)
Egypt Hanahan:
5.6% (99)South Carolina:
0.4% (1,208)
Jordan Hanahan:
5.4% (95)South Carolina:
0.1% (353)
Brazil Hanahan:
5.1% (91)South Carolina:
2.0% (5,344)
Colombia Hanahan:
4.3% (77)South Carolina:
4.3% (11,533)
Ukraine Hanahan:
3.8% (67)South Carolina:
1.4% (3,877)
India Hanahan:
3.3% (58)South Carolina:
6.8% (18,307)
Germany Hanahan:
3.0% (53)South Carolina:
3.7% (9,982)
Turkey Hanahan:
3.0% (53)South Carolina:
0.3% (701)
Vietnam Hanahan:
2.5% (44)South Carolina:
2.3% (6,308)
Chile Hanahan:
2.1% (37)South Carolina:
0.2% (567)
Thailand Hanahan:
1.8% (32)South Carolina:
0.7% (1,840)
Place of birth for U.S.-born residents:
This state: 10,611Other state: 9,209Northeast: 2,417Midwest: 1,292South: 4,423West: 955 85.7% of Hanahan residents lived in the same house 1 years ago.
Out of people who lived in different houses, 29.1% lived in this county.
Out of people who lived in different counties, 49.5% lived in South Carolina.
Hanahan:
85.7%State average:
86.5%
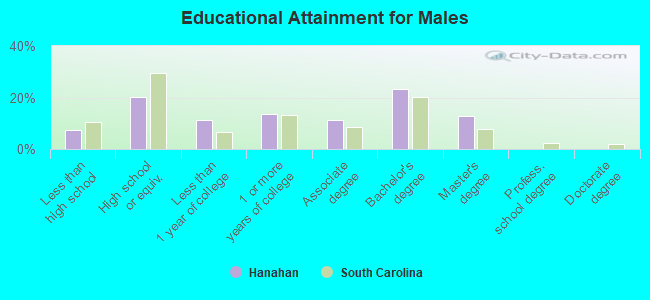
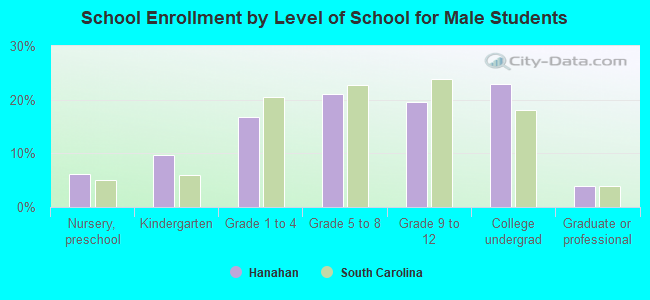
Education attainment for males 25 years and older:
No schooling: 150Nursery to 4th grade: 05th and 6th grade: 617th and 8th grade: 869th grade: 5310th grade: 5111th grade: 5912th grade, no diploma: 80High school graduate (or equivalency): 1,460Less than 1 year of college: 801Some college more than 1 year, no degree: 981Associate degree: 815Bachelor's degree: 1,671Master's degree: 913Professional school degree: 14Doctorate degree: 8
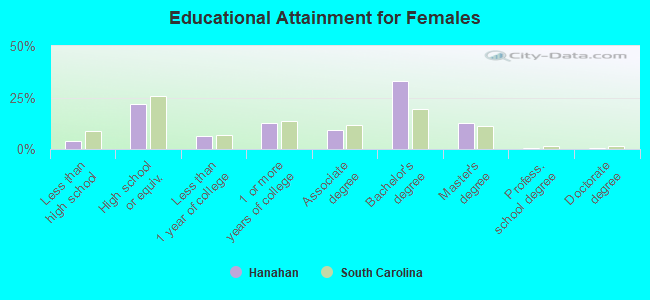
Education attainment for females 25 years and older:
No schooling: 9Nursery to 4th grade: 05th and 6th grade: 257th and 8th grade: 479th grade: 010th grade: 5211th grade: 6712th grade, no diploma: 68High school graduate (or equivalency): 1,591Less than 1 year of college: 475Some college more than 1 year, no degree: 944Associate degree: 674Bachelor's degree: 2,410Master's degree: 910Professional school degree: 30Doctorate degree: 49
Housing units in structures:
One, detached: 5,975One, attached: 266Two: 1593 or 4: 3285 to 9: 49710 to 19: 38820 to 49: 24350 or more: 173Mobile homes: 517Housing units lacking complete plumbing facilities in 2022: 0.1%Housing units lacking complete kitchen facilities in 2022: 2.5%House/condo owner moved in on average 11 years ago
Renter moved in on average 4 years ago
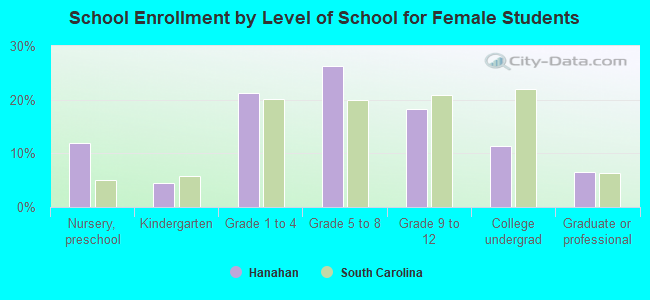
Private vs. public school enrollment:
Students in private schools in grades 1 to 8 (elementary and middle school): 384 Here:
16.2%South Carolina:
14.4%
Students in private schools in grades 9 to 12 (high school): 46 Here:
4.3%South Carolina:
11.1%
Students in private undergraduate colleges: 265 Here:
28.9%South Carolina:
21.9%