Hartford, TN (Tennessee) Houses and Residents
| Hartford: | $168,107 |
| Tennessee: | $284,800 |
Total population: 4,086 (Urban population: 0, Rural population: 3,917 (98 farm, 3,819 nonfarm))
Houses: 2,094 (1,604 occupied: 1,317 owner occupied, 287 renter occupied)
| % of renters here: | 18% |
| State: | 33% |
Housing density: 24 houses/condos per square mile
Median price asked for vacant for-sale houses and condos in 2022 in this county: $250,688.
Median contract rent in 2022: $581 (lower quartile is $510, upper quartile is $803)
Median rent asked for vacant for-rent units in 2022: $611
Median gross rent in Hartford, TN in 2022: $882
Housing units in Hartford with a mortgage: 227 (0 second mortgage, 44 home equity loan, 0 both second mortgage and home equity loan)
Houses without a mortgage: 391


Household type by relationship:
Households: 35,368- In family households: 29,826 (6,896 male householders, 3,161 female householders)
7,184 spouses, 9,019 children (8,126 natural, 289 adopted, 604 stepchildren), 1,326 grandchildren, 279 brothers or sisters, 281 parents, foster children, 456 other relatives, 995 non-relatives
- In nonfamily households: 5,542 (2,190 male householders (1,833 living alone)), 2,541 female householders (2,231 living alone)), 811 nonrelatives
- In group quarters: 294 (226 institutionalized population)
4,791 married couples with children.
1,865 single-parent households (472 men, 1,393 women).
96.1% of residents of Hartford speak English at home.
2.3% of residents speak Spanish at home (63% speak English very well, 30% speak English well, 7% speak English not well).
1.4% of residents speak other Indo-European language at home (90% speak English very well, 10% speak English well).
0.2% of residents speak Asian or Pacific Island language at home (100% speak English very well).
Foreign born population: 82 (1.8%)
(40.2% of them are naturalized citizens)
| Here: | 6.3 |
| State: | 6.5 |
| Here: | 4.9 |
| State: | 4.4 |

- Bedrooms in owner-occupied houses and condos in Hartford, Tennessee
- 0no bedroom
- 1311 bedroom
- 5442 bedrooms
- 5063 bedrooms
- 1154 bedrooms
- 215+ bedrooms

- Bedrooms in renter-occupied apartments in Hartford, Tennessee
- 0no bedroom
- 421 bedroom
- 1852 bedrooms
- 513 bedrooms
- 94 bedrooms
- 05+ bedrooms

- Cars and other vehicles available in Hartford in owner-occupied houses/condos
- 66no vehicle
- 3651 vehicle
- 5252 vehicles
- 2483 vehicles
- 754 vehicles
- 385+ vehicles

- Cars and other vehicles available in Hartford in renter-occupied apartments
- 13no vehicle
- 1351 vehicle
- 692 vehicles
- 493 vehicles
- 74 vehicles
- 145+ vehicles

- Rooms in owner-occupied houses in Hartford, Tennessee
- 01 room
- 402 rooms
- 593 rooms
- 3464 rooms
- 4545 rooms
- 2206 rooms
- 1137 rooms
- 408 rooms
- 459+ rooms

- Rooms in renter-occupied apartments in Hartford, Tennessee
- 01 room
- 202 rooms
- 283 rooms
- 1444 rooms
- 465 rooms
- 336 rooms
- 127 rooms
- 48 rooms
- 09+ rooms


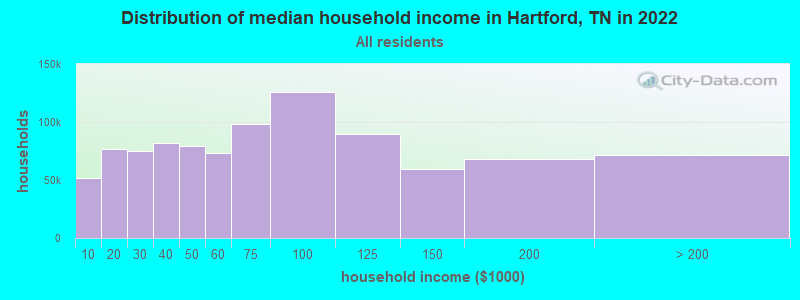
Hartford, TN household income distribution

- 34,165Less than $10,000
- 57,306$10,000 to $19,999
- 54,347$20,000 to $29,999
- 55,567$30,000 to $39,999
- 53,727$40,000 to $49,999
- 49,728$50,000 to $59,999
- 67,799$60,000 to $74,999
- 86,418$75,000 to $99,999
- 64,631$100,000 to $124,999
- 38,497$125,000 to $149,999
- 42,254$150,000 to $199,999
- 35,720$200,000 or more
Percentage of workers working in this county: 46.0%
Number of people working at home: 175 (9.8% of all workers)
Travel time to work (commute)
- Less than 5 minutes: 31
- 5 to 9 minutes: 80
- 10 to 14 minutes: 40
- 15 to 19 minutes: 162
- 20 to 24 minutes: 123
- 25 to 29 minutes: 170
- 30 to 34 minutes: 341
- 35 to 39 minutes: 82
- 40 to 44 minutes: 79
- 45 to 59 minutes: 304
- 60 to 89 minutes: 86
- 90 or more minutes: 55
Means of transportation to work:
- Drove a car alone: 1,172 (73.4%)
- Carpooled: 318 (19.9%)
- Walked: 7 (0.4%)
- Other means: 56 (3.5%)
- Worked at home: 43 (2.7%)


- Year of entry for the foreign-born population in Hartford, Tennessee
- 71995 to March 2000
- 71990 to 1994
- 141985 to 1989
- 01980 to 1984
- 121975 to 1979
- 01970 to 1974
- 01965 to 1969
- 0Before 1965
Most common places of birth for foreign-born residents (%):
| Hartford: | 52.5% (21) |
| Tennessee: | 28.1% (44,682) |
| Hartford: | 17.5% (7) |
| Tennessee: | 3.6% (5,726) |
| Hartford: | 15.0% (6) |
| Tennessee: | 3.8% (6,106) |
| Hartford: | 15.0% (6) |
| Tennessee: | 4.4% (6,981) |
Place of birth for U.S.-born residents:
- This state: 2,550
- Other state: 1,294
- Northeast: 275
- Midwest: 431
- South: 558
- West: 30
58% of Hartford residents lived in the same house 5 years ago.
Out of people who lived in different houses, 55% lived in this county.
Out of people who lived in different counties, 36% lived in Tennessee.
Education attainment for males 25 years and older:
- No schooling: 33
- Nursery to 4th grade: 55
- 5th and 6th grade: 35
- 7th and 8th grade: 191
- 9th grade: 57
- 10th grade: 95
- 11th grade: 64
- 12th grade, no diploma: 25
- High school graduate (or equivalency): 463
- Less than 1 year of college: 35
- Some college more than 1 year, no degree: 104
- Associate degree: 24
- Bachelor's degree: 74
- Master's degree: 40
- Professional school degree: 0
- Doctorate degree: 0

Education attainment for females 25 years and older:
- No schooling: 31
- Nursery to 4th grade: 18
- 5th and 6th grade: 82
- 7th and 8th grade: 162
- 9th grade: 40
- 10th grade: 96
- 11th grade: 38
- 12th grade, no diploma: 30
- High school graduate (or equivalency): 537
- Less than 1 year of college: 60
- Some college more than 1 year, no degree: 131
- Associate degree: 38
- Bachelor's degree: 48
- Master's degree: 16
- Professional school degree: 6
- Doctorate degree: 4


Housing units in structures:
- One, detached: 1,332
- One, attached: 8
- Two: 39
- 3 or 4: 22
- 5 to 9: 24
- 20 to 49: 8
- Mobile homes: 661
Median worth of mobile homes: $88,631
Housing units lacking complete kitchen facilities: 1.6%

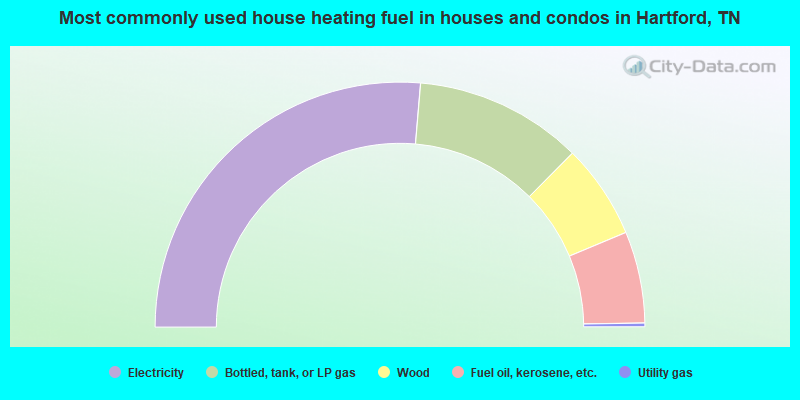
- 52.7%Electricity
- 22.2%Bottled, tank, or LP gas
- 12.5%Wood
- 12.1%Fuel oil, kerosene, etc.
- 0.5%Utility gas
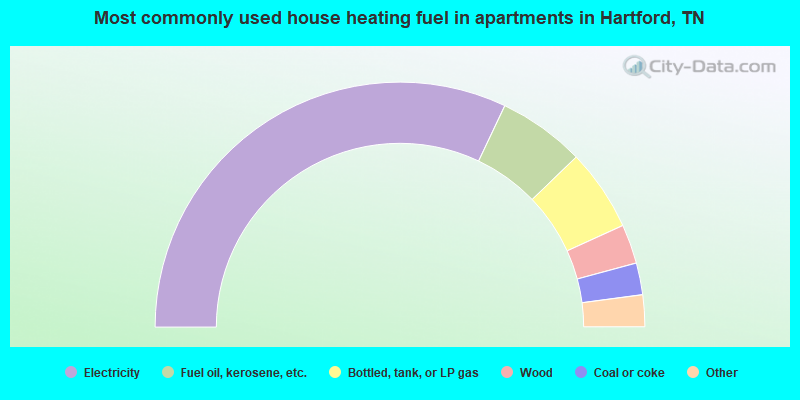
- 64.1%Electricity
- 11.5%Fuel oil, kerosene, etc.
- 10.8%Bottled, tank, or LP gas
- 5.2%Wood
- 4.2%Coal or coke
- 2.4%Utility gas
- 1.7%No fuel used
Private vs. public school enrollment:
| Here: | 0.0% |
| Tennessee: | 9.5% |
| Here: | 2.8% |
| Tennessee: | 10.4% |
| Here: | 16.4% |
| Tennessee: | 22.8% |


