Harwich Port, MA (Massachusetts) Houses and Residents
| Harwich Port: | $738,942 |
| Massachusetts: | $534,700 |
Total population: 1,644 (All urban)
Houses: 2,366 (1,206 occupied: 982 owner occupied, 303 renter occupied)
| % of renters here: | 24% |
| State: | 38% |
Housing density: 900 houses/condos per square mile
Median price asked for vacant for-sale houses and condos in 2022: $6,691,113.
Median contract rent in 2022: $1,096 (lower quartile is $415, upper quartile is $1,646)
Median rent asked for vacant for-rent units in 2022: $1,315
Median gross rent in Harwich Port, MA in 2022: $1,113
Housing units in Harwich Port with a mortgage: 464 (59 second mortgage, 0 home equity loan, 58 both second mortgage and home equity loan)
Houses without a mortgage: 64
Median household income for houses/condos with a mortgage: $93,118
Median household income for apartments without a mortgage: $44,489
Median monthly housing costs: $1,243
Compare current foreclosures near Harwich Port, MA:
| Photo | Address | Area | Beds / Baths | Price | Details |
|---|---|---|---|---|---|

|
#1
Route 28, Apt 5
Harwich Port, MA 02646
|
- sq. feet
|
- baths - beds |
show details | |

|
#2
Main St
Harwich Port, MA 02646
|
- sq. feet
|
- baths - beds |
show details | |

|
#3
Main St
Brewster, MA 02631
|
1,881 sq. feet
|
2 baths 5 beds |
show details | |

|
#4
Gosnold St
Hyannis, MA 02601
|
2,184 sq. feet
|
3 baths 4 beds |
show details | |

|
#5
Orchid Ln
West Yarmouth, MA 02673
|
888 sq. feet
|
1 baths 2 beds |
show details | |

|
#6
Mulberry St
Hyannis, MA 02601
|
950 sq. feet
|
1 baths 3 beds |
show details | |

|
#7
Murphy Rd
Hyannis, MA 02601
|
1,074 sq. feet
|
1 baths 3 beds |
show details | |

|
#8
Circuit Ave
Hyannis, MA 02601
|
864 sq. feet
|
1 baths 2 beds |
show details | |

|
#9
Highland St
West Yarmouth, MA 02673
|
1,740 sq. feet
|
2 baths 3 beds |
show details | |

|
#10
Oakmont Rd
Yarmouth Port, MA 02675
|
2,141 sq. feet
|
2 baths 3 beds |
show details |
| Photo | Address | Area | Beds / Baths | Price | Details |
|---|---|---|---|---|---|

|
#11
Camp St
West Yarmouth, MA 02673
|
832 sq. feet
|
1 baths 2 beds |
show details | |

|
#12
Spy Glass Hill Rd
Yarmouth Port, MA 02675
|
3,647 sq. feet
|
3 baths 3 beds |
show details | |

|
#13
Grant Rd
West Yarmouth, MA 02673
|
1,468 sq. feet
|
1 baths 3 beds |
show details | |

|
#14
Wharf Ln
Yarmouth Port, MA 02675
|
2,276 sq. feet
|
2 baths 4 beds |
show details | |

|
#15
Mitchells Way
Hyannis, MA 02601
|
1,040 sq. feet
|
1 baths 4 beds |
show details | |

|
#16
Lumberjack Trl
West Yarmouth, MA 02673
|
1,287 sq. feet
|
2 baths 3 beds |
show details | |

|
#17
Chickadee Ln
West Yarmouth, MA 02673
|
1,526 sq. feet
|
2 baths 2 beds |
show details | |

|
#18
Old Colony Way Apt 30
Orleans, MA 02653
|
814 sq. feet
|
1 baths 1 beds |
show details | |

|
#19
Joshua Baker Rd
West Yarmouth, MA 02673
|
1,230 sq. feet
|
1 baths 3 beds |
show details | |

|
#20
Brush Hill Rd
Yarmouth Port, MA 02675
|
1,575 sq. feet
|
2 baths 3 beds |
show details |
| Photo | Address | Area | Beds / Baths | Price | Details |
|---|---|---|---|---|---|

|
#21
Trowbridge Path
West Yarmouth, MA 02673
|
1,200 sq. feet
|
2 baths 3 beds |
show details | |

|
#22
Cobb Ave
Yarmouth Port, MA 02675
|
1,144 sq. feet
|
1 baths 3 beds |
show details | |

|
#23
Circuit Rd N
West Yarmouth, MA 02673
|
832 sq. feet
|
1 baths 2 beds |
show details | |

|
#24
Southgate Dr
Hyannis, MA 02601
|
1,152 sq. feet
|
3 baths 4 beds |
show details | |

|
#25
Pine Grove Ave
Hyannis, MA 02601
|
720 sq. feet
|
1 baths 2 beds |
show details | |

|
#26
Captain Weiler Rd
South Yarmouth, MA 02664
|
1,144 sq. feet
|
1 baths 3 beds |
show details | |

|
#27
Sachem Dr
Centerville, MA 02632
|
2,064 sq. feet
|
3 baths 4 beds |
show details | |

|
#28
N Precinct Rd
Centerville, MA 02632
|
968 sq. feet
|
1 baths 2 beds |
show details | |

|
#29
N Precinct Rd
Centerville, MA 02632
|
1,128 sq. feet
|
2 baths 3 beds |
show details | |

|
#30
Donegal Cir
Centerville, MA 02632
|
1,306 sq. feet
|
1 baths 2 beds |
show details |
| Photo | Address | Area | Beds / Baths | Price | Details |
|---|---|---|---|---|---|

|
#31
Skunknet Rd
Centerville, MA 02632
|
1,464 sq. feet
|
2 baths 4 beds |
show details | |

|
#32
Muskeget Ln
Centerville, MA 02632
|
2,052 sq. feet
|
1 baths 4 beds |
show details | |

|
#33
Nauset Ln
Centerville, MA 02632
|
1,232 sq. feet
|
2 baths 3 beds |
show details | |

|
#34
Buckskin Path
Centerville, MA 02632
|
1,235 sq. feet
|
2 baths 3 beds |
show details | |

|
#35
Gleneagle Dr
Centerville, MA 02632
|
1,400 sq. feet
|
2 baths 3 beds |
show details | |

|
#36
S Main St
Centerville, MA 02632
|
2,511 sq. feet
|
2 baths 5 beds |
show details | |

|
#37
Sea Gull Ln
Eastham, MA 02642
|
1,507 sq. feet
|
2 baths 3 beds |
show details | |

|
#38
Pond St
Centerville, MA 02632
|
980 sq. feet
|
1 baths 2 beds |
show details | |

|
#39
Bain Rd
Eastham, MA 02642
|
1,196 sq. feet
|
2 baths 3 beds |
show details | |

|
#40
Pinecrest Rd
Centerville, MA 02632
|
925 sq. feet
|
1 baths 3 beds |
show details |
| Photo | Address | Area | Beds / Baths | Price | Details |
|---|---|---|---|---|---|

|
#41
Conners Rd
Centerville, MA 02632
|
2,240 sq. feet
|
3 baths 4 beds |
show details | |

|
#42
Rudder Rd
Hyannis, MA 02601
|
1,436 sq. feet
|
1 baths 3 beds |
show details | |

|
#43
Sunset Ter
Hyannis, MA 02601
|
1,783 sq. feet
|
1 baths 3 beds |
show details | |

|
#44
Arrowhead Dr
Hyannis, MA 02601
|
832 sq. feet
|
1 baths 2 beds |
show details | |

|
#45
Wellesley Cir
Hyannis, MA 02601
|
1,056 sq. feet
|
2 baths 3 beds |
show details | |

|
#46
W Hyannisport Cir
Hyannis, MA 02601
|
2,386 sq. feet
|
2 baths 4 beds |
show details | |

|
#47
Buckwood Dr
Hyannis, MA 02601
|
1,104 sq. feet
|
1 baths 2 beds |
show details | |

|
#48
Fawcett Ln
Hyannis, MA 02601
|
1,004 sq. feet
|
1 baths 3 beds |
show details | |

|
#49
Pitchers Way
Hyannis, MA 02601
|
1,816 sq. feet
|
2 baths 2 beds |
show details | |

|
Check over 1 million property listings on Foreclosure.com!
|
browse all offers | |||


 | Cape Cod observations from a 1st timer (77 replies) |
| Surprised to see a Dunkin' now out of business. Is this becoming common during pandemic? (61 replies) |
| Cape Cod help needed!!! (11 replies) |
| Where to spend a weekend on the Cape??? (17 replies) |
| Best Coastal Vacation/mid-Sept? (6 replies) |

Median year apartment built: 1970
Household type by relationship:
Households: 2,281- Male householders: 530 (221 living alone), Female householders: 683 (376 living alone)
371 spouses (371 opposite-sex spouses), 58 unmarried partners, (58 opposite-sex unmarried partners), 482 children (471 natural, 0 adopted, 11 stepchildren), 17 grandchildren, 13 brothers or sisters, 0 parents, 18 foster children, 23 other relatives, 10 non-relatives
- In group quarters: 71
Size of family households: 411 2-persons, 118 3-persons, 24 4-persons, 6 7-or-more-persons.
Size of nonfamily households: 641 1-person, 72 2-persons.
69 married couples with children.
36 single-parent households (0 men, 36 women).
98.4% of residents of Harwich Port speak English at home.
0.8% of residents speak Spanish at home (35% speak English very well, 65% speak English well).
1.1% of residents speak other Indo-European language at home (38% speak English very well, 62% speak English well).
0.5% of residents speak Asian or Pacific Island language at home (100% speak English very well).
0.5% of residents speak other language at home (100% speak English very well).
Foreign born population: 86 (3.8%)
(79.1% of them are naturalized citizens)
| Here: | 7.0 |
| State: | 6.5 |
| Here: | 3.6 |
| State: | 4.0 |

- Bedrooms in owner-occupied houses and condos in Harwich Port, Massachusetts
- 0no bedroom
- 601 bedroom
- 2082 bedrooms
- 2973 bedrooms
- 2744 bedrooms
- 1435+ bedrooms

- Bedrooms in renter-occupied apartments in Harwich Port, Massachusetts
- 0no bedroom
- 1331 bedroom
- 832 bedrooms
- 423 bedrooms
- 344 bedrooms
- 125+ bedrooms

- Cars and other vehicles available in Harwich Port in owner-occupied houses/condos
- 43no vehicle
- 4581 vehicle
- 3542 vehicles
- 1193 vehicles
- 04 vehicles
- 95+ vehicles

- Cars and other vehicles available in Harwich Port in renter-occupied apartments
- 33no vehicle
- 1951 vehicle
- 432 vehicles
- 323 vehicles
- 04 vehicles
- 05+ vehicles

- Rooms in owner-occupied houses in Harwich Port, Massachusetts
- 01 room
- 102 rooms
- 333 rooms
- 744 rooms
- 985 rooms
- 1926 rooms
- 1817 rooms
- 1468 rooms
- 2499+ rooms

- Rooms in renter-occupied apartments in Harwich Port, Massachusetts
- 01 room
- 432 rooms
- 1043 rooms
- 344 rooms
- 215 rooms
- 346 rooms
- 207 rooms
- 238 rooms
- 249+ rooms


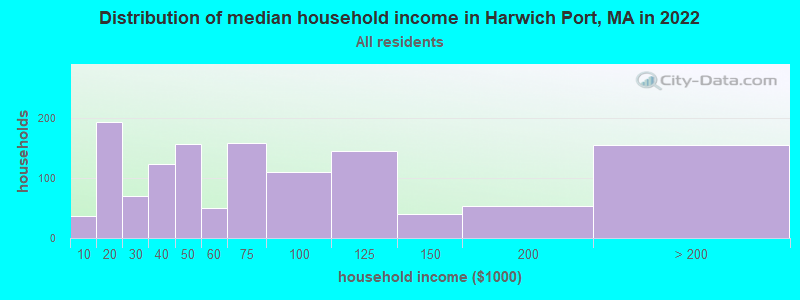
Harwich Port, MA household income distribution

- 37Less than $10,000
- 194$10,000 to $19,999
- 70$20,000 to $29,999
- 124$30,000 to $39,999
- 157$40,000 to $49,999
- 51$50,000 to $59,999
- 159$60,000 to $74,999
- 111$75,000 to $99,999
- 145$100,000 to $124,999
- 40$125,000 to $149,999
- 54$150,000 to $199,999
- 156$200,000 or more
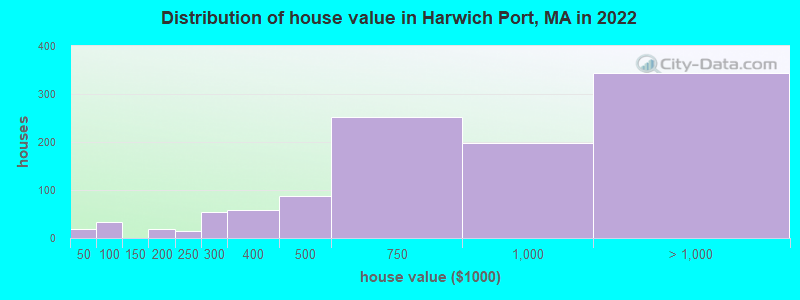
Home value of owner - occupied houses in 2022 in Harwich Port, MA
-
- 19Less than $10,000
- 34$50,000 to $59,999
- 18$175,000 to $199,999
- 14$200,000 to $249,999
- 53$250,000 to $299,999
- 58$300,000 to $399,999
- 86$400,000 to $499,999
- 252$500,000 to $749,999
- 198$750,000 to $999,999
- 215$1,000,000 to $1,499,999
- 39$1,500,000 to $1,999,999
- 89$2,000,000 or more
Rent paid by renters in 2022 in Harwich Port, MA
-
- 9$200 to $249
- 14$300 to $349
- 10$350 to $399
- 6$450 to $499
- 36$500 to $549
- 14$600 to $649
- 14$800 to $899
- 18$1,000 to $1,249
- 7$1,250 to $1,499
- 68$1,500 to $1,999
- 95No cash rent


Percentage of workers working in this county: 75.3%
Number of people working at home: 196 (18.9% of all workers)
Travel time to work (commute)
- Less than 5 minutes: 39
- 5 to 9 minutes: 93
- 10 to 14 minutes: 78
- 15 to 19 minutes: 100
- 20 to 24 minutes: 143
- 25 to 29 minutes: 157
- 30 to 34 minutes: 81
- 35 to 39 minutes: 23
- 40 to 44 minutes: 12
- 45 to 59 minutes: 103
- 60 to 89 minutes: 6
- 90 or more minutes: 10
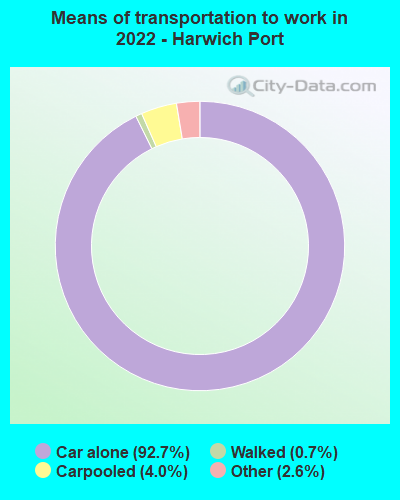
Means of transportation to work:
- Drove a car alone: 662 (72.4%)
- Carpooled: 28 (3.1%)
- Taxi: 22 (2.4%)
- Walked: 3 (0.3%)
- Worked at home: 196 (21.4%)

- Unemployment by race in 2022
- Unemployment rate for White non-Hispanic residents
- 1.6%Males
- 9.0%Females
- Unemployment rate for Black residents
- 100.0%Males

- Year of entry for the foreign-born population in Harwich Port, Massachusetts
- 342010 or later
- 132000 to 2009
- 41990 to 1999
- 01980 to 1989
- 01970 to 1979
- 47Before 1970

First ancestries reported:
- Irish: 376 (30.4%)
- American: 145 (11.7%)
- Polish: 94 (7.6%)
- English: 83 (6.7%)
- Lithuanian: 51 (4.1%)
- Italian: 47 (3.8%)
- Armenian: 41 (3.3%)
- Scottish: 41 (3.3%)
- Swedish: 30 (2.4%)
- French Canadian: 27 (2.2%)
- German: 22 (1.8%)
- European: 20 (1.6%)
- Cape Verdean: 15 (1.2%)
- Brazilian: 13 (1.1%)
- Canadian: 13 (1.1%)
- Austrian: 10 (0.8%)
- Lebanese: 9 (0.7%)
- Northern European: 9 (0.7%)
- Russian: 9 (0.7%)
- British: 6 (0.5%)
- Welsh: 6 (0.5%)
Most common places of birth for foreign-born residents (%):
| Harwich Port: | 14.3% (13) |
| Massachusetts: | 7.6% (92,959) |
| Harwich Port: | 12.1% (11) |
| Massachusetts: | 0.1% (1,002) |
| Harwich Port: | 12.1% (11) |
| Massachusetts: | 0.6% (7,364) |
| Harwich Port: | 9.9% (9) |
| Massachusetts: | 0.6% (7,349) |
| Harwich Port: | 8.8% (8) |
| Massachusetts: | 0.6% (7,064) |
| Harwich Port: | 8.8% (8) |
| Massachusetts: | 1.0% (12,709) |
| Harwich Port: | 7.7% (7) |
| Massachusetts: | 1.0% (12,529) |
| Harwich Port: | 6.6% (6) |
| Massachusetts: | 0.4% (5,265) |
| Harwich Port: | 5.5% (5) |
| Massachusetts: | 2.3% (27,810) |
| Harwich Port: | 4.4% (4) |
| Massachusetts: | 0.2% (1,959) |
Place of birth for U.S.-born residents:
- This state: 1,273
- Other state: 917
- Northeast: 650
- Midwest: 138
- South: 37
- West: 70
81.5% of Harwich Port residents lived in the same house 1 years ago.
Out of people who lived in different houses, 14.3% lived in this county.
Out of people who lived in different counties, 7.8% lived in Massachusetts.
| Harwich Port: | 81.5% |
| State average: | 87.7% |
Education attainment for males 25 years and older:
- No schooling: 0
- Nursery to 4th grade: 0
- 5th and 6th grade: 0
- 7th and 8th grade: 0
- 9th grade: 0
- 10th grade: 0
- 11th grade: 0
- 12th grade, no diploma: 27
- High school graduate (or equivalency): 88
- Less than 1 year of college: 6
- Some college more than 1 year, no degree: 65
- Associate degree: 139
- Bachelor's degree: 344
- Master's degree: 196
- Professional school degree: 22
- Doctorate degree: 15

Education attainment for females 25 years and older:
- No schooling: 0
- Nursery to 4th grade: 0
- 5th and 6th grade: 0
- 7th and 8th grade: 0
- 9th grade: 0
- 10th grade: 0
- 11th grade: 0
- 12th grade, no diploma: 6
- High school graduate (or equivalency): 100
- Less than 1 year of college: 41
- Some college more than 1 year, no degree: 57
- Associate degree: 157
- Bachelor's degree: 376
- Master's degree: 316
- Professional school degree: 34
- Doctorate degree: 11


Housing units in structures:
- One, detached: 1,892
- One, attached: 41
- Two: 41
- 3 or 4: 143
- 5 to 9: 188
- 10 to 19: 21
- 20 to 49: 38
Housing units lacking complete kitchen facilities in 2022: 0.6%
House/condo owner moved in on average 14 years ago
Renter moved in on average 6 years ago

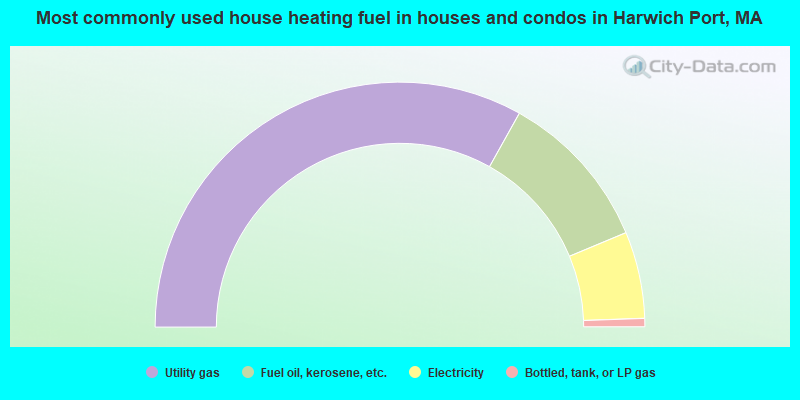
- 66.3%Utility gas
- 21.2%Fuel oil, kerosene, etc.
- 11.5%Electricity
- 1.1%Bottled, tank, or LP gas
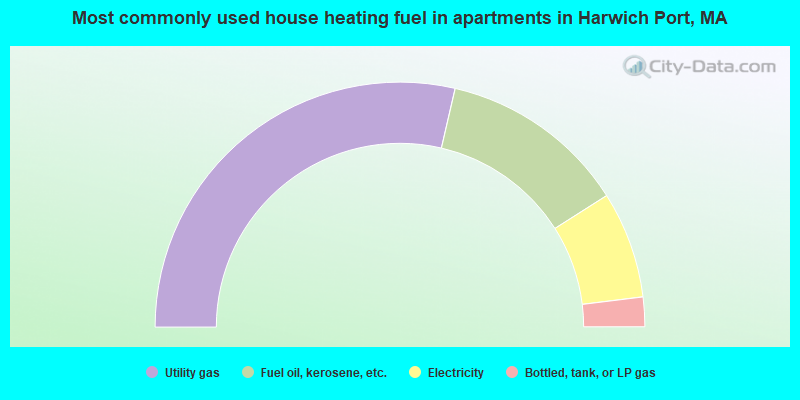
- 57.2%Utility gas
- 24.7%Fuel oil, kerosene, etc.
- 14.1%Electricity
- 3.9%Bottled, tank, or LP gas
Private vs. public school enrollment:
| Here: | 13.9% |
| Massachusetts: | 10.3% |
| Here: | 18.8% |
| Massachusetts: | 12.3% |
| Here: | 11.9% |
| Massachusetts: | 51.2% |


