Housing density: 1,372 houses/condos per square mile
Median price asked for vacant for-sale houses and condos in 2022 in this county: $858,483.
Median contract rent in 2022: $1,322 (lower quartile is $1,088, upper quartile is $1,672)
Median rent asked for vacant for-rent units in 2022: $1,517
Median gross rent in Hazel Dell South, WA in 2022: $1,468
Housing units in Hazel Dell South with a mortgage: 853 (127 second mortgage, 116 home equity loan, 0 both second mortgage and home equity loan) Houses without a mortgage: 288
Compare current foreclosures near Hazel Dell South, WA:
In family households: 360,563 (79,262 male householders, 31,410 female householders)
84,752 spouses, 131,505 children (121,185 natural, 3,296 adopted, 7,024 stepchildren), 7,226 grandchildren, 3,444 brothers or sisters, 3,549 parents, foster children, 4,498 other relatives, 12,056 non-relatives
In nonfamily households: 61,590 (22,699 male householders (16,393 living alone)), 24,728 female householders (20,133 living alone)), 14,163 nonrelatives
In group quarters: 3,210 (1,691 institutionalized population)
71,295 married couples with children.
20,273 single-parent households (5,325 men, 14,948 women).
92.9% of residents of Hazel Dell South speak English at home.
3.6% of residents speak Spanish at home (60% speak English very well, 21% speak English well, 11% speak English not well, 8% don't speak English at all).
2.3% of residents speak other Indo-European language at home (75% speak English very well, 20% speak English not well, 5% don't speak English at all).
0.7% of residents speak Asian or Pacific Island language at home (36% speak English very well, 64% speak English well).
0.4% of residents speak other language at home (100% speak English very well).
Foreign born population: 419 (4.2%)
(60.1% of them are naturalized citizens)
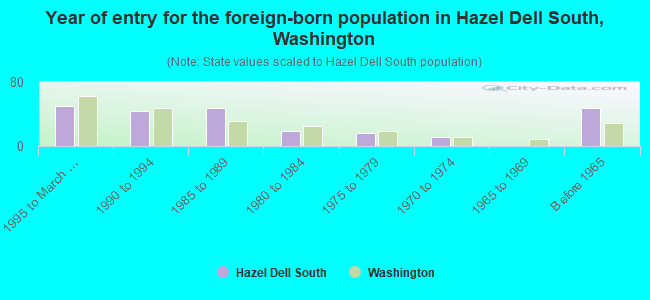
Year of entry for the foreign-born population in Hazel Dell South, Washington
501995 to March 2000
441990 to 1994
481985 to 1989
191980 to 1984
161975 to 1979
111970 to 1974
01965 to 1969
47Before 1965
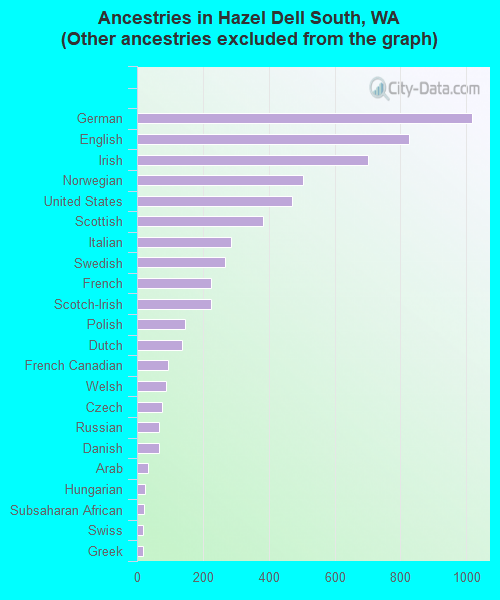
First ancestries reported:
Other: 1,583 (21.7%)
German: 1,018 (14.0%)
English: 827 (11.4%)
Irish: 700 (9.6%)
Norwegian: 504 (6.9%)
United States: 471 (6.5%)
Scottish: 384 (5.3%)
Italian: 286 (3.9%)
Swedish: 266 (3.7%)
French: 224 (3.1%)
Scotch-Irish: 224 (3.1%)
Polish: 146 (2.0%)
Dutch: 138 (1.9%)
French Canadian: 93 (1.3%)
Welsh: 87 (1.2%)
Czech: 76 (1.0%)
Russian: 67 (0.9%)
Danish: 66 (0.9%)
Arab: 32 (0.4%)
Hungarian: 24 (0.3%)
Subsaharan African: 22 (0.3%)
Swiss: 18 (0.2%)
Greek: 17 (0.2%)
Ukrainian: 8 (0.1%)
Lithuanian: 4 (0.05%)
Most common places of birth for foreign-born residents (%):
Mexico
Hazel Dell South:
19.1% (45)
Washington:
24.1% (148,115)
Russia
Hazel Dell South:
8.9% (21)
Washington:
2.5% (15,491)
Honduras
Hazel Dell South:
8.9% (21)
Washington:
0.2% (1,381)
Guatemala
Hazel Dell South:
6.8% (16)
Washington:
0.5% (3,096)
Germany
Hazel Dell South:
5.1% (12)
Washington:
3.4% (21,167)
Vietnam
Hazel Dell South:
4.7% (11)
Washington:
6.7% (40,879)
Canada
Hazel Dell South:
4.7% (11)
Washington:
7.7% (47,568)
Hungary
Hazel Dell South:
4.3% (10)
Washington:
0.2% (1,367)
Jordan
Hazel Dell South:
4.3% (10)
Washington:
0.1% (380)
United Kingdom
Hazel Dell South:
3.4% (8)
Washington:
3.3% (20,321)
Ukraine
Hazel Dell South:
3.4% (8)
Washington:
3.0% (18,572)
Other Western Asia
Hazel Dell South:
3.4% (8)
Washington:
0.4% (2,661)
Netherlands
Hazel Dell South:
3.0% (7)
Washington:
0.6% (3,795)
Japan
Hazel Dell South:
3.0% (7)
Washington:
2.8% (16,936)
Jamaica
Hazel Dell South:
3.0% (7)
Washington:
0.1% (864)
Other Northern Europe
Hazel Dell South:
2.6% (6)
Washington:
1.0% (6,393)
Taiwan
Hazel Dell South:
2.6% (6)
Washington:
1.4% (8,353)
Korea
Hazel Dell South:
2.6% (6)
Washington:
6.2% (38,172)
Ireland
Hazel Dell South:
2.1% (5)
Washington:
0.4% (2,328)
Other South Central Asia
Hazel Dell South:
2.1% (5)
Washington:
0.5% (2,889)
El Salvador
Hazel Dell South:
2.1% (5)
Washington:
0.7% (4,492)
Place of birth for U.S.-born residents:
This state: 2,193
Other state: 4,220
Northeast: 225
Midwest: 769
South: 428
West: 2,798
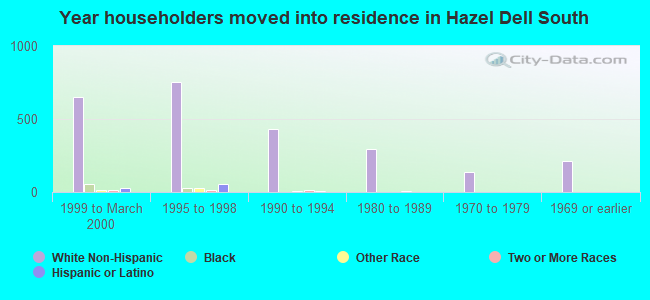
48% of Hazel Dell South residents lived in the same house 5 years ago. Out of people who lived in different houses, 55% lived in this county. Out of people who lived in different counties, 16% lived in Washington.
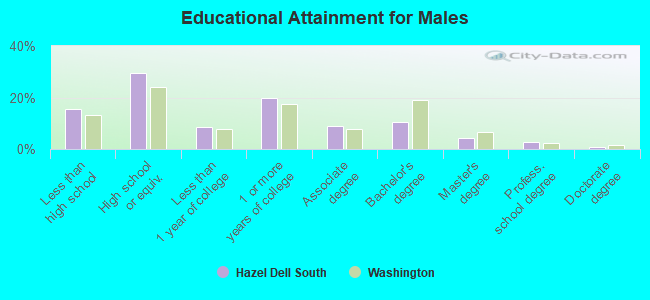
Education attainment for males 25 years and older:
No schooling: 16
Nursery to 4th grade: 0
5th and 6th grade: 22
7th and 8th grade: 69
9th grade: 41
10th grade: 44
11th grade: 29
12th grade, no diploma: 105
High school graduate (or equivalency): 622
Less than 1 year of college: 183
Some college more than 1 year, no degree: 414
Associate degree: 186
Bachelor's degree: 222
Master's degree: 86
Professional school degree: 54
Doctorate degree: 14
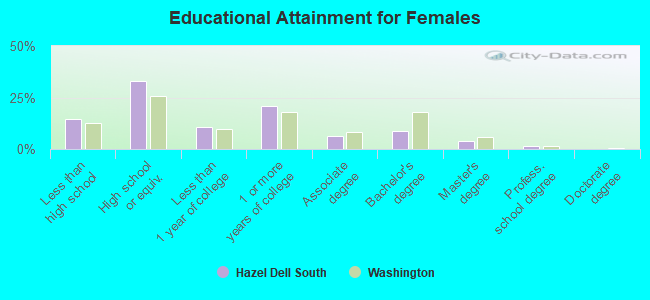
Education attainment for females 25 years and older:
No schooling: 0
Nursery to 4th grade: 24
5th and 6th grade: 26
7th and 8th grade: 61
9th grade: 64
10th grade: 49
11th grade: 38
12th grade, no diploma: 84
High school graduate (or equivalency): 775
Less than 1 year of college: 255
Some college more than 1 year, no degree: 492
Associate degree: 144
Bachelor's degree: 210
Master's degree: 92
Professional school degree: 30
Doctorate degree: 5
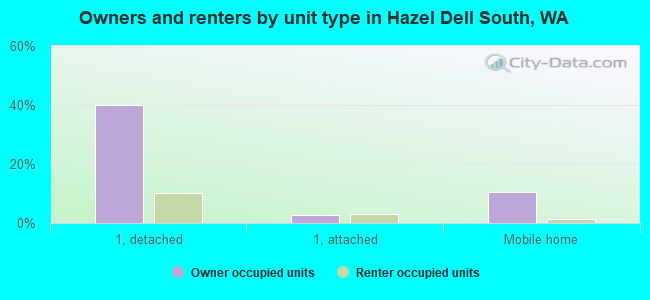
Housing units in structures:
One, detached: 1,442
One, attached: 172
Two: 85
3 or 4: 201
5 to 9: 154
10 to 19: 82
20 to 49: 129
50 or more: 304
Mobile homes: 338
Boats, RVs, vans, etc.: 61
Median worth of mobile homes: $69,926
Housing units lacking complete kitchen facilities: 2.2%