Hobart, IN (Indiana) Houses and Residents
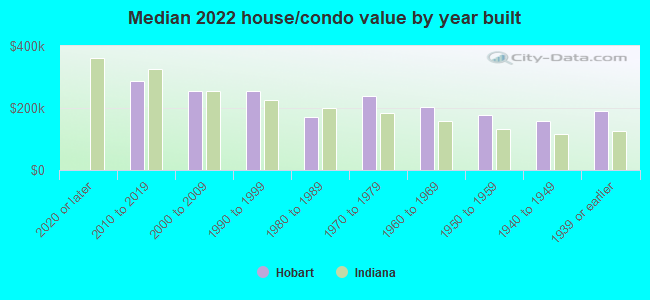
| Hobart: | $223,353 |
| Indiana: | $208,700 |
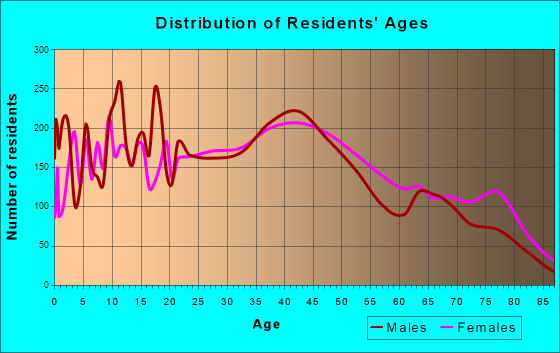
Total population: 28,635 (Urban population: 22,887, Rural population: 2,513 (all nonfarm))
Houses: 12,992 (12,157 occupied: 8,715 owner occupied, 3,453 renter occupied)
| % of renters here: | 28% |
| State: | 29% |
Housing density: 496 houses/condos per square mile
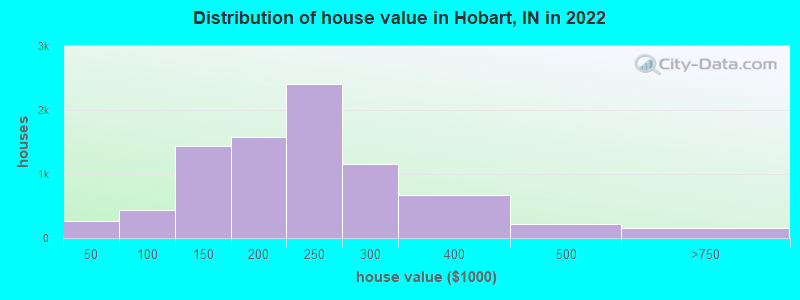
Median price asked for vacant for-sale houses and condos in 2022: $192,753.
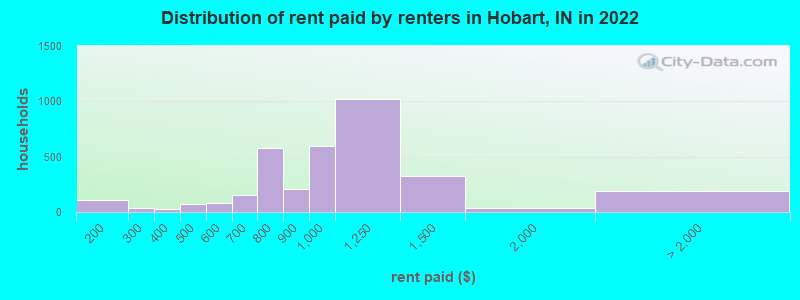
Median contract rent in 2022: $962 (lower quartile is $827, upper quartile is $1,129)
Median rent asked for vacant for-rent units in 2022: $916
Median gross rent in Hobart, IN in 2022: $1,176
Housing units in Hobart with a mortgage: 5,437 (409 second mortgage, 0 home equity loan, 331 both second mortgage and home equity loan)
Houses without a mortgage: 133
Median household income for houses/condos with a mortgage: $89,694
Median household income for apartments without a mortgage: $72,039
Median monthly housing costs: $1,115
Compare current foreclosures in Hobart, IN:
| Photo | Address | Area | Beds / Baths | Price | Details |
|---|---|---|---|---|---|

|
#1
S Virginia St
Hobart, IN 46342
|
2,166 sq. feet
|
4 baths 3 beds |
show details | |

|
#2
16th St
Hobart, IN 46342
|
1,120 sq. feet
|
1 baths 2 beds |
show details | |

|
#3
Poplar Ln
Hobart, IN 46342
|
2,020 sq. feet
|
2 baths 3 beds |
show details | |

|
#4
Lincoln St
Hobart, IN 46342
|
2,352 sq. feet
|
3 baths 2 beds |
show details | |

|
#5
N Union St
Hobart, IN 46342
|
2,275 sq. feet
|
2 baths 4 beds |
show details | |

|
#6
Michigan St
Hobart, IN 46342
|
896 sq. feet
|
1 baths 2 beds |
show details | |

|
#7
Rush Ct
Hobart, IN 46342
|
1,850 sq. feet
|
1 baths 3 beds |
show details | |

|
#8
Bracken Pkwy
Hobart, IN 46342
|
3,092 sq. feet
|
3 baths 5 beds |
show details | |

|
#9
W 38th Ave
Hobart, IN 46342
|
1,848 sq. feet
|
1 baths 2 beds |
show details | |

|
#10
Driftwood Dr
Hobart, IN 46342
|
1,945 sq. feet
|
3 baths 4 beds |
show details |
| Photo | Address | Area | Beds / Baths | Price | Details |
|---|---|---|---|---|---|

|
#11
Barberry Dr
Hobart, IN 46342
|
2,492 sq. feet
|
2 baths 4 beds |
show details | |

|
#12
Lincoln St
Hobart, IN 46342
|
3,276 sq. feet
|
1 baths 3 beds |
show details | |

|
#13
Deerpath Ct
Hobart, IN 46342
|
3,595 sq. feet
|
3 baths 3 beds |
show details | |

|
#14
W 700 N
Hobart, IN 46342
|
1,872 sq. feet
|
2 baths 1 beds |
show details | |

|
#15
N Linda St
Hobart, IN 46342
|
1,860 sq. feet
|
1 baths 3 beds |
show details | |

|
#16
Crabapple Ln
Hobart, IN 46342
|
2,256 sq. feet
|
2 baths 3 beds |
show details | |

|
#17
Rush St
Hobart, IN 46342
|
2,116 sq. feet
|
2 baths 3 beds |
show details | |

|
#18
High St
Hobart, IN 46342
|
2,640 sq. feet
|
1 baths 3 beds |
show details | |

|
#19
S Liverpool Rd
Hobart, IN 46342
|
1,716 sq. feet
|
1 baths 3 beds |
show details | |

|
#20
Diamond Dr
Hobart, IN 46342
|
2,388 sq. feet
|
2 baths 5 beds |
show details |
| Photo | Address | Area | Beds / Baths | Price | Details |
|---|---|---|---|---|---|

|
#21
Lincoln St
Hobart, IN 46342
|
1,872 sq. feet
|
1 baths 3 beds |
show details | |

|
#22
E 32nd Ct
Hobart, IN 46342
|
2,953 sq. feet
|
2 baths 4 beds |
show details | |

|
#23
E 31st Pl
Hobart, IN 46342
|
1,784 sq. feet
|
1 baths 3 beds |
show details | |

|
#24
N Indiana St
Hobart, IN 46342
|
2,402 sq. feet
|
1 baths 3 beds |
show details | |

|
#25
S Virginia St
Hobart, IN 46342
|
1,920 sq. feet
|
1 baths 3 beds |
show details | |

|
#26
Cherry Ln
Hobart, IN 46342
|
2,640 sq. feet
|
2 baths 3 beds |
show details | |

|
#27
Swift St
Hobart, IN 46342
|
1,800 sq. feet
|
1 baths 3 beds |
show details | |

|
#28
Center St
Hobart, IN 46342
|
1,330 sq. feet
|
1 baths 3 beds |
show details | |

|
#29
Crabapple Ln
Hobart, IN 46342
|
1,508 sq. feet
|
1 baths 3 beds |
show details | |

|
#30
Lincoln St
Hobart, IN 46342
|
2,464 sq. feet
|
1 baths 3 beds |
show details |
| Photo | Address | Area | Beds / Baths | Price | Details |
|---|---|---|---|---|---|

|
#31
N Kelly St
Hobart, IN 46342
|
988 sq. feet
|
2 baths 6 beds |
show details | |

|
#32
Lincoln St
Hobart, IN 46342
|
3,005 sq. feet
|
1 baths 2 beds |
show details | |

|
#33
Amber Dr
Hobart, IN 46342
|
1,714 sq. feet
|
1 baths 3 beds |
show details | |

|
#34
Dearborn St
Hobart, IN 46342
|
2,170 sq. feet
|
1 baths 4 beds |
show details | |

|
#35
E 8th St
Hobart, IN 46342
|
2,196 sq. feet
|
1 baths 3 beds |
show details | |

|
#36
Main St
Hobart, IN 46342
|
1,632 sq. feet
|
1 baths 2 beds |
show details | |

|
#37
E 34th Ln
Hobart, IN 46342
|
2,450 sq. feet
|
2 baths 3 beds |
show details | |

|
#38
S Hobart Rd
Hobart, IN 46342
|
1,216 sq. feet
|
1 baths 4 beds |
show details | |

|
#39
S Liverpool Rd
Hobart, IN 46342
|
1,750 sq. feet
|
3 baths 3 beds |
show details | |

|
#40
W 39th Ave
Hobart, IN 46342
|
988 sq. feet
|
1 baths 3 beds |
show details |
| Photo | Address | Area | Beds / Baths | Price | Details |
|---|---|---|---|---|---|

|
#41
S Wabash St
Hobart, IN 46342
|
1,976 sq. feet
|
1 baths 3 beds |
show details | |

|
#42
Alabama St
Hobart, IN 46342
|
1,490 sq. feet
|
1 baths 3 beds |
show details | |

|
#43
Pheasant Run Dr
Hobart, IN 46342
|
2,320 sq. feet
|
1 baths 3 beds |
show details | |

|
#44
Huber Blvd
Hobart, IN 46342
|
1,040 sq. feet
|
1 baths 3 beds |
show details | |

|
#45
W 1st Pl
Hobart, IN 46342
|
875 sq. feet
|
1 baths 3 beds |
show details | |

|
#46
Redbud Dr
Hobart, IN 46342
|
1,568 sq. feet
|
2 baths 3 beds |
show details | |

|
#47
E Rand St
Hobart, IN 46342
|
2,005 sq. feet
|
1 baths 2 beds |
show details | |

|
#48
W 10th St
Hobart, IN 46342
|
1,380 sq. feet
|
1 baths 3 beds |
show details | |

|
#49
Fox Trail Ct
Hobart, IN 46342
|
1,443 sq. feet
|
1 baths 3 beds |
show details | |

|
Check over 1 million property listings on Foreclosure.com!
|
browse all offers | |||

Latest news about housing in Hobart, IN collected exclusively by city-data.com from local newspapers, TV, and radio stations

 | Current Pulse of the NWI Housing Market (22 replies) |
| Hobart, IN - Houses/Apts. for Rent (9 replies) |
| Hobart's Growing Lakefront Business Corridor (1 reply) |
| Crown Point area apartments for rent (9 replies) |
| Hammond housing prices (11 replies) |
| Why do Hobart and Lake Station have such small black populations when they're next to Gary? (4 replies) |
Median year apartment built: 1974
Household type by relationship:
Households: 29,692- Male householders: 6,128 (1,659 living alone), Female householders: 5,942 (2,345 living alone)
5,356 spouses (5,298 opposite-sex spouses), 1,437 unmarried partners, (1,396 opposite-sex unmarried partners), 9,063 children (7,876 natural, 365 adopted, 821 stepchildren), 320 grandchildren, 351 brothers or sisters, 228 parents, 0 foster children, 144 other relatives, 474 non-relatives
- In group quarters: 242
Size of family households: 3,024 2-persons, 1,971 3-persons, 1,224 4-persons, 628 5-persons, 254 6-persons, 136 7-or-more-persons.
Size of nonfamily households: 4,104 1-person, 684 2-persons, 34 3-persons, 39 4-persons.
3,802 married couples with children.
1,990 single-parent households (729 men, 1,261 women).
88.7% of residents of Hobart speak English at home.
6.1% of residents speak Spanish at home (82% speak English very well, 9% speak English well, 5% speak English not well, 4% don't speak English at all).
3.4% of residents speak other Indo-European language at home (87% speak English very well, 8% speak English well, 5% speak English not well).
0.7% of residents speak Asian or Pacific Island language at home (24% speak English very well, 47% speak English well, 30% speak English not well).
0.6% of residents speak other language at home (100% speak English very well).
Foreign born population: 1,393 (4.7%)
(56.0% of them are naturalized citizens)
| Here: | 6.2 |
| State: | 6.6 |
| Here: | 4.0 |
| State: | 4.3 |
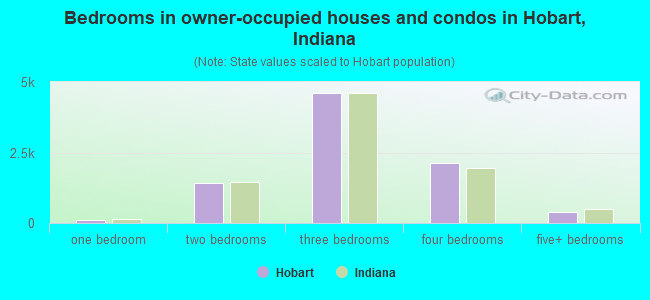
- Bedrooms in owner-occupied houses and condos in Hobart, Indiana
- 40no bedroom
- 1241 bedroom
- 1,4092 bedrooms
- 4,6153 bedrooms
- 2,1304 bedrooms
- 3965+ bedrooms
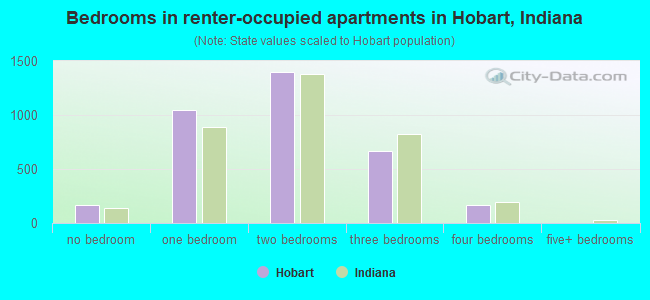
- Bedrooms in renter-occupied apartments in Hobart, Indiana
- 170no bedroom
- 1,0461 bedroom
- 1,3982 bedrooms
- 6713 bedrooms
- 1684 bedrooms
- 05+ bedrooms
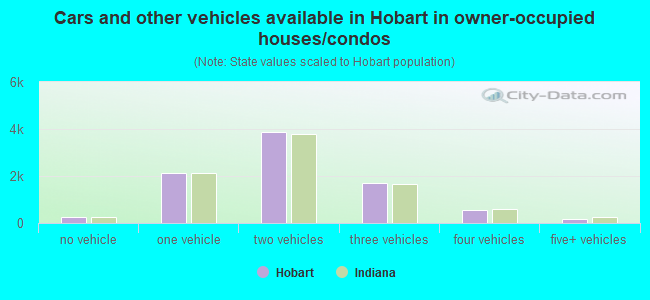
- Cars and other vehicles available in Hobart in owner-occupied houses/condos
- 258no vehicle
- 2,1251 vehicle
- 3,8812 vehicles
- 1,7233 vehicles
- 5624 vehicles
- 1665+ vehicles
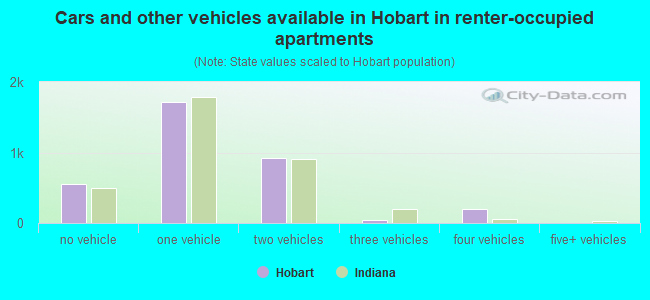
- Cars and other vehicles available in Hobart in renter-occupied apartments
- 558no vehicle
- 1,7161 vehicle
- 9282 vehicles
- 473 vehicles
- 2044 vehicles
- 05+ vehicles
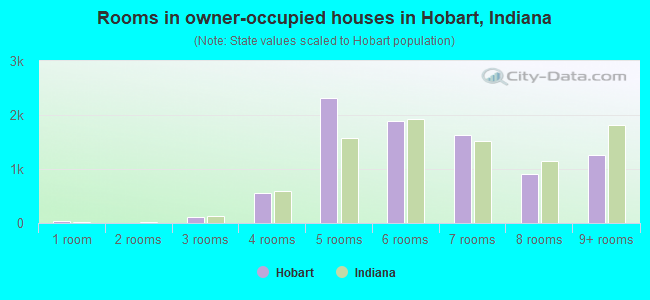
- Rooms in owner-occupied houses in Hobart, Indiana
- 401 room
- 02 rooms
- 1083 rooms
- 5644 rooms
- 2,3185 rooms
- 1,8956 rooms
- 1,6277 rooms
- 9018 rooms
- 1,2629+ rooms
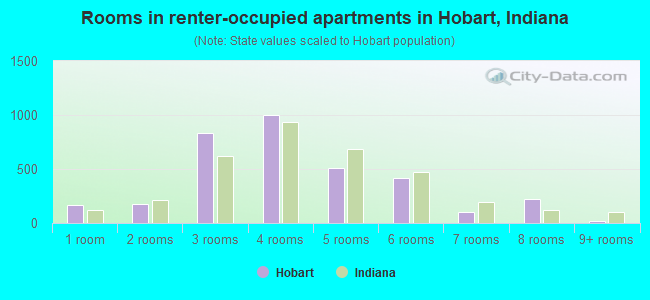
- Rooms in renter-occupied apartments in Hobart, Indiana
- 1701 room
- 1802 rooms
- 8293 rooms
- 1,0024 rooms
- 5125 rooms
- 4136 rooms
- 1067 rooms
- 2208 rooms
- 219+ rooms
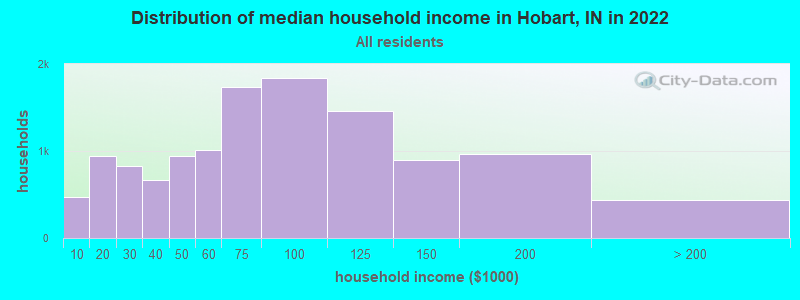
Hobart, IN household income distribution

- 472Less than $10,000
- 945$10,000 to $19,999
- 823$20,000 to $29,999
- 672$30,000 to $39,999
- 941$40,000 to $49,999
- 1,006$50,000 to $59,999
- 1,732$60,000 to $74,999
- 1,836$75,000 to $99,999
- 1,458$100,000 to $124,999
- 895$125,000 to $149,999
- 963$150,000 to $199,999
- 436$200,000 or more
Home value of owner - occupied houses in 2022 in Hobart, IN
-
- 121Less than $10,000
- 35$15,000 to $19,999
- 26$20,000 to $24,999
- 40$25,000 to $29,999
- 37$35,000 to $39,999
- 8$40,000 to $49,999
- 19$50,000 to $59,999
- 29$60,000 to $69,999
- 51$70,000 to $79,999
- 120$80,000 to $89,999
- 206$90,000 to $99,999
- 639$100,000 to $124,999
- 802$125,000 to $149,999
- 937$150,000 to $174,999
- 636$175,000 to $199,999
- 2,404$200,000 to $249,999
- 1,163$250,000 to $299,999
- 675$300,000 to $399,999
- 212$400,000 to $499,999
- 125$500,000 to $749,999
- 28$1,000,000 to $1,499,999
- 9$1,500,000 to $1,999,999
Rent paid by renters in 2022 in Hobart, IN
-
- 107$100 to $149
- 32$250 to $299
- 23$300 to $349
- 19$400 to $449
- 52$450 to $499
- 54$500 to $549
- 28$550 to $599
- 85$600 to $649
- 70$650 to $699
- 212$700 to $749
- 363$750 to $799
- 206$800 to $899
- 599$900 to $999
- 1,017$1,000 to $1,249
- 324$1,250 to $1,499
- 32$1,500 to $1,999
- 12$3,500 or more
- 177No cash rent
Percentage of workers working in this county: 73.2%
Number of people working at home: 712 (5.0% of all workers)
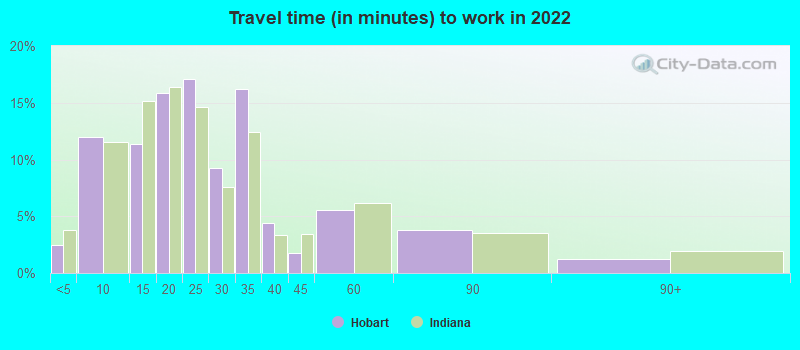
Travel time to work (commute)
- Less than 5 minutes: 567
- 5 to 9 minutes: 1,248
- 10 to 14 minutes: 1,190
- 15 to 19 minutes: 1,768
- 20 to 24 minutes: 2,426
- 25 to 29 minutes: 762
- 30 to 34 minutes: 1,795
- 35 to 39 minutes: 490
- 40 to 44 minutes: 474
- 45 to 59 minutes: 1,304
- 60 to 89 minutes: 933
- 90 or more minutes: 283
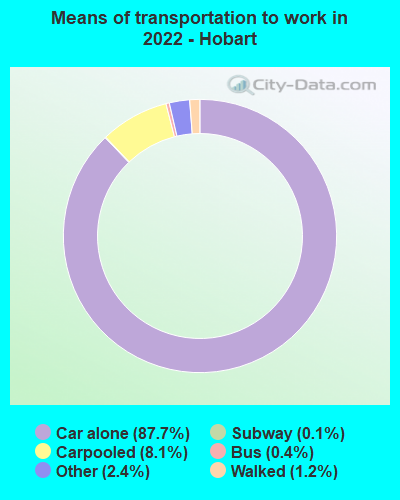
Means of transportation to work:
- Drove a car alone: 12,941 (80.5%)
- Carpooled: 1,419 (8.8%)
- Bus: 66 (0.4%)
- Long-distance train or commuter rail: 12 (0.1%)
- Taxi: 349 (2.2%)
- Bicycle: 27 (0.2%)
- Walked: 188 (1.2%)
- Worked at home: 712 (4.4%)
- Unemployment by race in 2022
- Unemployment rate for White non-Hispanic residents
- 4.7%Males
- 3.1%Females
- Unemployment rate for Black residents
- 4.6%Males
- 14.9%Females
- Unemployment rate for American Indian and Alaska Native residents
- 37.3%Males
- Unemployment rate for two or more race residents
- 5.4%Females
- Unemployment rate for Hispanic or Latino residents
- 0.5%Males
- 3.3%Females
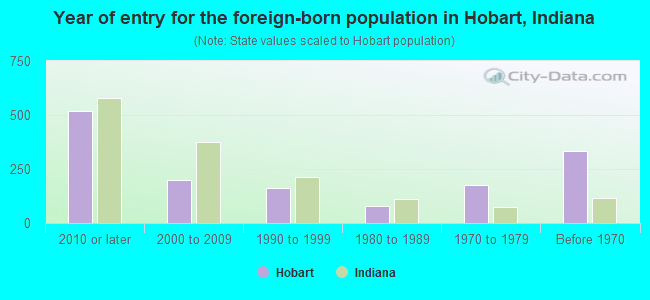
- Year of entry for the foreign-born population in Hobart, Indiana
- 5172010 or later
- 1982000 to 2009
- 1611990 to 1999
- 801980 to 1989
- 1751970 to 1979
- 334Before 1970
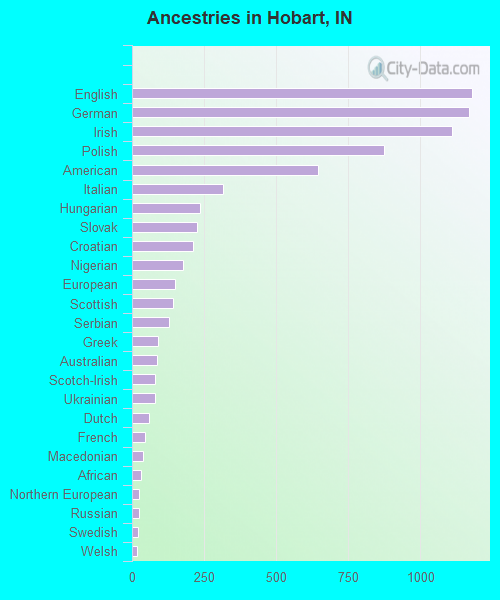
First ancestries reported:
- English: 1,180 (9.4%)
- German: 1,169 (9.3%)
- Irish: 1,112 (8.9%)
- Polish: 876 (7.0%)
- American: 647 (5.1%)
- Italian: 315 (2.5%)
- Hungarian: 236 (1.9%)
- Slovak: 227 (1.8%)
- Croatian: 210 (1.7%)
- Nigerian: 176 (1.4%)
- European: 148 (1.2%)
- Scottish: 144 (1.1%)
- Serbian: 130 (1.0%)
- Greek: 89 (0.7%)
- Australian: 88 (0.7%)
- Scotch-Irish: 80 (0.6%)
- Ukrainian: 80 (0.6%)
- Dutch: 59 (0.5%)
- French: 44 (0.4%)
- Macedonian: 37 (0.3%)
- African: 32 (0.3%)
- Northern European: 25 (0.2%)
- Russian: 23 (0.2%)
- Swedish: 20 (0.2%)
- Welsh: 18 (0.1%)
- Romanian: 15 (0.1%)
- British: 11 (0.09%)
- Belgian: 10 (0.08%)
- Scandinavian: 9 (0.07%)
- Eastern European: 8 (0.06%)
- Yugoslavian: 6 (0.05%)
Most common places of birth for foreign-born residents (%):
| Hobart: | 18.2% (261) |
| Indiana: | 27.0% (101,996) |
| Hobart: | 16.6% (239) |
| Indiana: | 8.5% (32,127) |
| Hobart: | 10.0% (144) |
| Indiana: | 0.2% (639) |
| Hobart: | 9.6% (138) |
| Indiana: | 0.8% (2,959) |
| Hobart: | 6.8% (97) |
| Indiana: | 1.7% (6,439) |
| Hobart: | 6.4% (92) |
| Indiana: | 3.1% (11,851) |
| Hobart: | 4.5% (65) |
| Indiana: | 0.2% (757) |
| Hobart: | 3.5% (50) |
| Indiana: | 1.6% (5,892) |
| Hobart: | 2.6% (38) |
| Indiana: | 5.3% (19,877) |
| Hobart: | 2.5% (36) |
| Indiana: | 0.6% (2,272) |
| Hobart: | 2.4% (35) |
| Indiana: | 0.2% (785) |
| Hobart: | 2.4% (35) |
| Indiana: | 0.2% (835) |
| Hobart: | 2.2% (32) |
| Indiana: | 0.1% (311) |
| Hobart: | 2.1% (30) |
| Indiana: | 2.3% (8,656) |
| Hobart: | 1.9% (28) |
| Indiana: | 0.8% (2,847) |
| Hobart: | 1.6% (23) |
| Indiana: | 0.3% (978) |
Place of birth for U.S.-born residents:
- This state: 19,335
- Other state: 8,607
- Northeast: 533
- Midwest: 5,851
- South: 1,433
- West: 637
90.2% of Hobart residents lived in the same house 1 years ago.
Out of people who lived in different houses, 38.6% lived in this county.
Out of people who lived in different counties, 31.3% lived in Indiana.
| Hobart: | 90.2% |
| State average: | 87.1% |
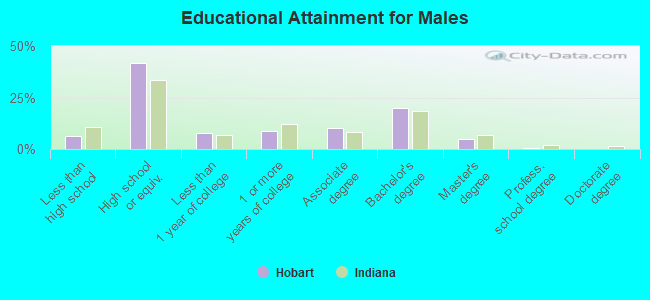
Education attainment for males 25 years and older:
- No schooling: 218
- Nursery to 4th grade: 29
- 5th and 6th grade: 0
- 7th and 8th grade: 34
- 9th grade: 58
- 10th grade: 124
- 11th grade: 28
- 12th grade, no diploma: 162
- High school graduate (or equivalency): 4,217
- Less than 1 year of college: 789
- Some college more than 1 year, no degree: 886
- Associate degree: 1,036
- Bachelor's degree: 1,998
- Master's degree: 470
- Professional school degree: 50
- Doctorate degree: 0
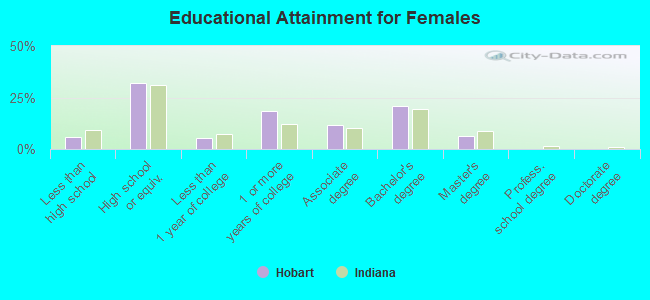
Education attainment for females 25 years and older:
- No schooling: 79
- Nursery to 4th grade: 0
- 5th and 6th grade: 22
- 7th and 8th grade: 73
- 9th grade: 23
- 10th grade: 157
- 11th grade: 94
- 12th grade, no diploma: 188
- High school graduate (or equivalency): 3,464
- Less than 1 year of college: 587
- Some college more than 1 year, no degree: 1,988
- Associate degree: 1,261
- Bachelor's degree: 2,248
- Master's degree: 698
- Professional school degree: 6
- Doctorate degree: 0
Housing units in structures:
- One, detached: 9,544
- One, attached: 430
- Two: 168
- 3 or 4: 153
- 5 to 9: 1,458
- 10 to 19: 464
- 20 to 49: 270
- 50 or more: 322
- Mobile homes: 178
Median worth of mobile homes: $7,178
Housing units lacking complete kitchen facilities in 2022: 1.0%
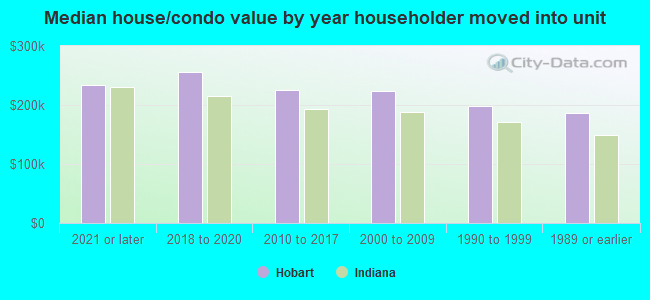
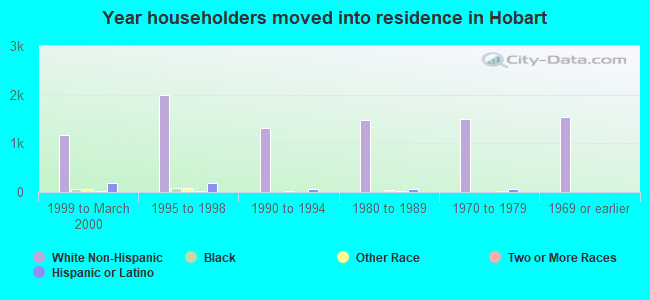
House/condo owner moved in on average 13 years ago
Renter moved in on average 1 years ago
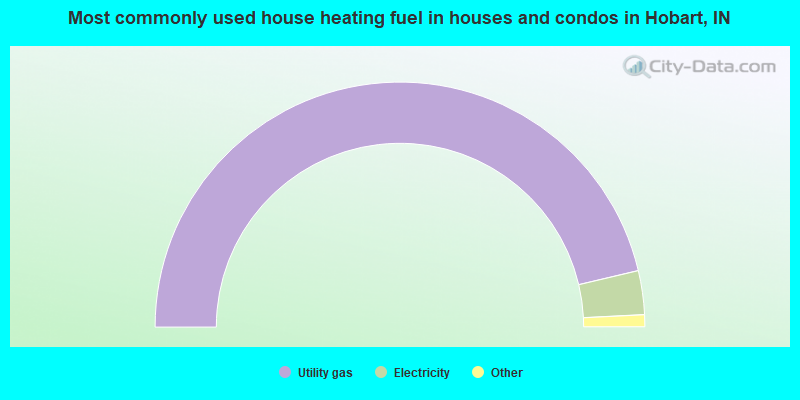
- 92.6%Utility gas
- 5.8%Electricity
- 1.3%Bottled, tank, or LP gas
- 0.2%Other fuel
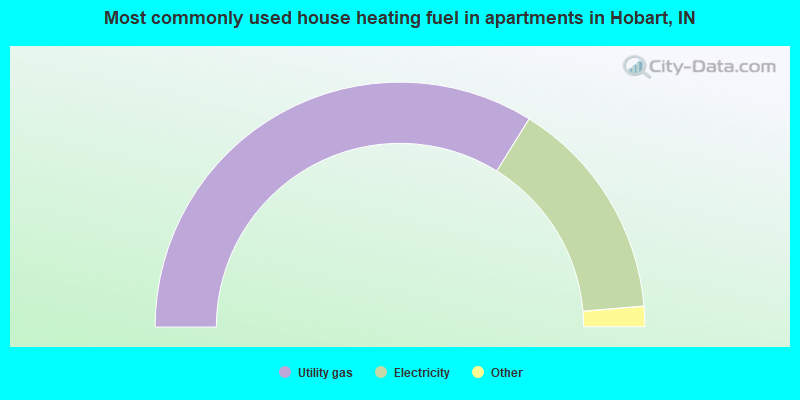
- 67.7%Utility gas
- 29.6%Electricity
- 1.1%No fuel used
- 0.8%Wood
- 0.8%Bottled, tank, or LP gas
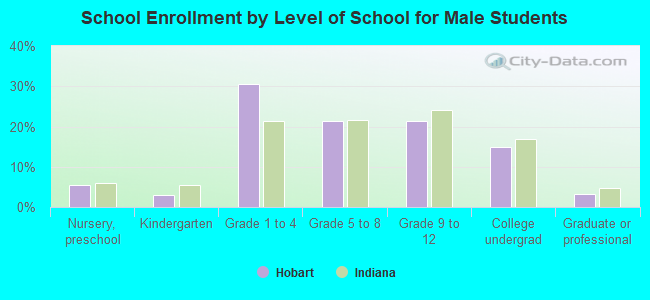
Private vs. public school enrollment:
| Here: | 5.3% |
| Indiana: | 14.9% |
| Here: | 7.0% |
| Indiana: | 11.4% |
| Here: | 15.9% |
| Indiana: | 22.3% |