Holland, MI (Michigan) Houses and Residents
| Holland: | $248,172 |
| Michigan: | $224,400 |
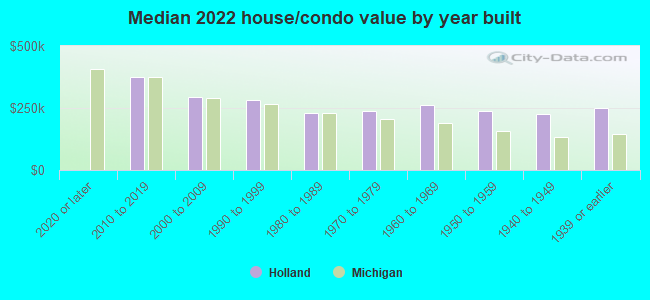
Mean price in 2022:
Detached houses: $281,552
Here: $281,552 State: $280,038 Townhouses or other attached units: $213,130
Here: $213,130 State: $239,520 In 2-unit structures: $576,982
Here: $576,982 State: $219,481 In 3-to-4-unit structures: $183,824
Here: $183,824 State: $207,067 In 5-or-more-unit structures: $249,991
Here: $249,991 State: $192,733 Mobile homes: $38,672
Here: $38,672 State: $72,868
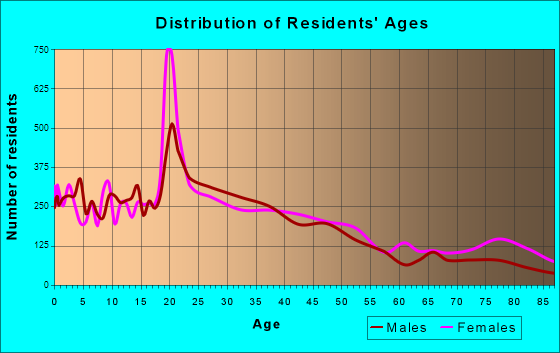
Total population: 33,644 (All urban)
Houses: 14,000 (13,004 occupied: 8,615 owner occupied, 4,413 renter occupied)
| % of renters here: | 34% |
| State: | 27% |
Housing density: 845 houses/condos per square mile
Median price asked for vacant for-sale houses and condos in 2022: $165,830.
Median contract rent in 2022: $996 (lower quartile is $823, upper quartile is $1,186)
Median rent asked for vacant for-rent units in 2022: $876
Median gross rent in Holland, MI in 2022: $1,110
Housing units in Holland with a mortgage: 4,764 (660 second mortgage, 4 home equity loan, 645 both second mortgage and home equity loan)
Houses without a mortgage: 59
Median household income for houses/condos with a mortgage: $87,490
Median household income for apartments without a mortgage: $62,669
Median monthly housing costs: $1,064
Compare current foreclosures in Holland, MI:
| Photo | Address | Area | Beds / Baths | Price | Details |
|---|---|---|---|---|---|

|
#1
N 168th Ave
Holland, MI 49424
|
1,373 sq. feet
|
3 baths 3 beds |
show details | |

|
#2
Hoover Blvd
Holland, MI 49423
|
1,222 sq. feet
|
1 baths 3 beds |
show details | |

|
#3
W 32nd St
Holland, MI 49423
|
1,522 sq. feet
|
1 baths 3 beds |
show details | |

|
#4
Aniline Ave N
Holland, MI 49424
|
1,078 sq. feet
|
2 baths - beds |
show details | |

|
#5
W 32nd St
Holland, MI 49423
|
1,008 sq. feet
|
1 baths 2 beds |
show details | |

|
#6
Shade Tree Ct
Holland, MI 49424
|
- sq. feet
|
- baths - beds |
show details | |

|
#7
E 19th St
Holland, MI 49423
|
- sq. feet
|
- baths - beds |
show details | |

|
#8
Lincoln Ave # 9
Holland, MI 49423
|
- sq. feet
|
- baths - beds |
show details | |

|
#9
N 168th Ave
Holland, MI 49424
|
- sq. feet
|
- baths - beds |
show details | |

|
#10
Butternut Dr Lot 39
Holland, MI 49424
|
- sq. feet
|
- baths - beds |
show details |
| Photo | Address | Area | Beds / Baths | Price | Details |
|---|---|---|---|---|---|

|
#11
Bay Hbr
Holland, MI 49424
|
- sq. feet
|
- baths - beds |
show details | |

|
#12
N Division Ave
Holland, MI 49424
|
- sq. feet
|
- baths - beds |
show details | |

|
#13
Dune Dr # 201
Holland, MI 49424
|
- sq. feet
|
- baths - beds |
show details | |

|
#14
E 22nd St
Holland, MI 49423
|
- sq. feet
|
- baths - beds |
show details | |

|
#15
Douglas Ave Apt 1
Holland, MI 49424
|
- sq. feet
|
- baths - beds |
show details | |

|
#16
Barbaray Way
Holland, MI 49424
|
- sq. feet
|
- baths - beds |
show details | |

|
#17
Wurtsboro Dr
Holland, MI 49424
|
- sq. feet
|
- baths - beds |
show details | |

|
#18
Riley St
Holland, MI 49424
|
- sq. feet
|
- baths - beds |
show details | |

|
#19
N Black River Dr Apt 2
Holland, MI 49424
|
- sq. feet
|
- baths - beds |
show details | |

|
#20
Waverly Hbr
Holland, MI 49424
|
- sq. feet
|
- baths - beds |
show details |
| Photo | Address | Area | Beds / Baths | Price | Details |
|---|---|---|---|---|---|

|
#21
Northern Shrs
Holland, MI 49424
|
- sq. feet
|
- baths - beds |
show details | |

|
#22
Northpointe Dr # 8
Holland, MI 49424
|
- sq. feet
|
- baths - beds |
show details | |

|
#23
Seven Pine Dr
Holland, MI 49424
|
- sq. feet
|
- baths - beds |
show details | |

|
#24
Parkview Ln Apt 2a
Holland, MI 49424
|
- sq. feet
|
- baths - beds |
show details | |

|
#25
Edgewater Ave Apt 1a
Holland, MI 49424
|
- sq. feet
|
- baths - beds |
show details | |

|
#26
Wood Ave
Holland, MI 49424
|
- sq. feet
|
- baths - beds |
show details | |

|
#27
Deer Cove Dr
Holland, MI 49424
|
- sq. feet
|
- baths - beds |
show details | |

|
#28
Waverly Shrs
Holland, MI 49424
|
- sq. feet
|
- baths - beds |
show details | |

|
#29
52nd St
Holland, MI 49423
|
- sq. feet
|
- baths - beds |
show details | |

|
#30
Boer Run
Holland, MI 49424
|
- sq. feet
|
- baths - beds |
show details |
| Photo | Address | Area | Beds / Baths | Price | Details |
|---|---|---|---|---|---|

|
#31
Elemeda St
Holland, MI 49424
|
- sq. feet
|
- baths - beds |
show details | |

|
#32
Robar Dr
Holland, MI 49424
|
- sq. feet
|
- baths - beds |
show details | |

|
#33
Apple Ave
Holland, MI 49423
|
- sq. feet
|
- baths - beds |
show details | |

|
#34
Brookdale Dr
Holland, MI 49424
|
- sq. feet
|
- baths - beds |
show details | |

|
#35
Aniline Ave N
Holland, MI 49424
|
- sq. feet
|
- baths - beds |
show details | |

|
#36
Jack St
Holland, MI 49424
|
- sq. feet
|
- baths - beds |
show details | |

|
#37
128th Ave
Holland, MI 49424
|
- sq. feet
|
- baths - beds |
show details | |

|
#38
Pineoak Dr
Holland, MI 49424
|
- sq. feet
|
- baths - beds |
show details | |

|
Check over 1 million property listings on Foreclosure.com!
|
browse all offers | |||

Latest news about housing in Holland, MI collected exclusively by city-data.com from local newspapers, TV, and radio stations

 | Looking for apartments within 30 min of Holland, MI (2 replies) |
| HOLLAND: any apartments large dog friendly?!? (2 replies) |
| Considering Move to Holland, Mi (4 replies) |
| Move to Holland Michigan (6 replies) |
| Holland Mi Vacation home (2 replies) |
| Holland, Mi CABS?!! (1 reply) |
Median year apartment built: 1977
Household type by relationship:
Households: 34,727- Male householders: 6,894 (2,002 living alone), Female householders: 5,977 (2,276 living alone)
5,498 spouses (5,472 opposite-sex spouses), 1,004 unmarried partners, (968 opposite-sex unmarried partners), 8,611 children (7,772 natural, 328 adopted, 510 stepchildren), 527 grandchildren, 308 brothers or sisters, 393 parents, 51 foster children, 251 other relatives, 1,254 non-relatives
- In group quarters: 3,953
Size of family households: 3,298 2-persons, 1,297 3-persons, 1,713 4-persons, 608 5-persons, 322 6-persons, 151 7-or-more-persons.
Size of nonfamily households: 4,282 1-person, 931 2-persons, 131 3-persons, 237 4-persons, 48 5-persons, 6 6-persons.
3,842 married couples with children.
2,358 single-parent households (902 men, 1,456 women).
84.0% of residents of Holland speak English at home.
12.7% of residents speak Spanish at home (74% speak English very well, 14% speak English well, 5% speak English not well, 7% don't speak English at all).
1.0% of residents speak other Indo-European language at home (83% speak English very well, 12% speak English well, 6% speak English not well).
2.1% of residents speak Asian or Pacific Island language at home (25% speak English very well, 49% speak English well, 20% speak English not well, 7% don't speak English at all).
0.2% of residents speak other language at home (26% speak English very well, 74% speak English well).
Foreign born population: 2,527 (7.3%)
(49.5% of them are naturalized citizens)
| Here: | 6.3 |
| State: | 6.5 |
| Here: | 4.2 |
| State: | 4.3 |
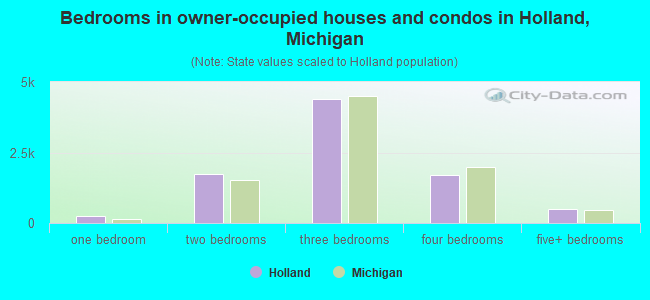
- Bedrooms in owner-occupied houses and condos in Holland, Michigan
- 35no bedroom
- 2451 bedroom
- 1,7242 bedrooms
- 4,3953 bedrooms
- 1,7194 bedrooms
- 4985+ bedrooms
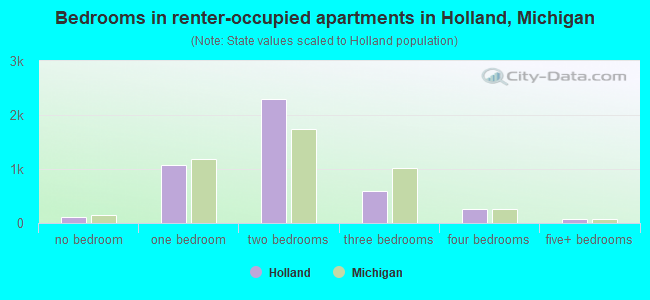
- Bedrooms in renter-occupied apartments in Holland, Michigan
- 114no bedroom
- 1,0721 bedroom
- 2,3022 bedrooms
- 5853 bedrooms
- 2614 bedrooms
- 785+ bedrooms
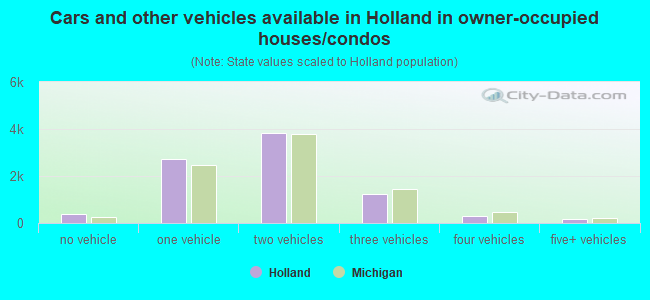
- Cars and other vehicles available in Holland in owner-occupied houses/condos
- 384no vehicle
- 2,7151 vehicle
- 3,8272 vehicles
- 1,2353 vehicles
- 2804 vehicles
- 1765+ vehicles
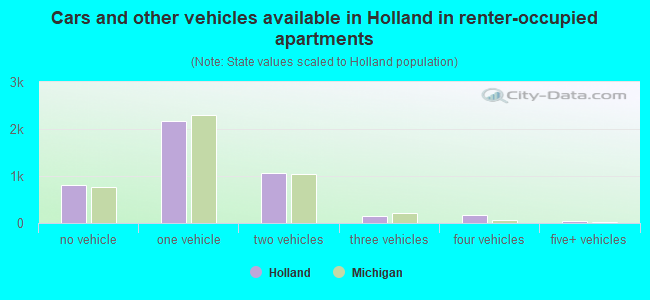
- Cars and other vehicles available in Holland in renter-occupied apartments
- 810no vehicle
- 2,1661 vehicle
- 1,0682 vehicles
- 1493 vehicles
- 1774 vehicles
- 435+ vehicles
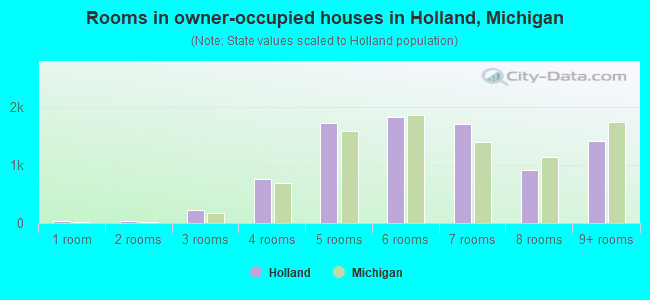
- Rooms in owner-occupied houses in Holland, Michigan
- 351 room
- 352 rooms
- 2303 rooms
- 7634 rooms
- 1,7145 rooms
- 1,8196 rooms
- 1,6957 rooms
- 9188 rooms
- 1,4079+ rooms
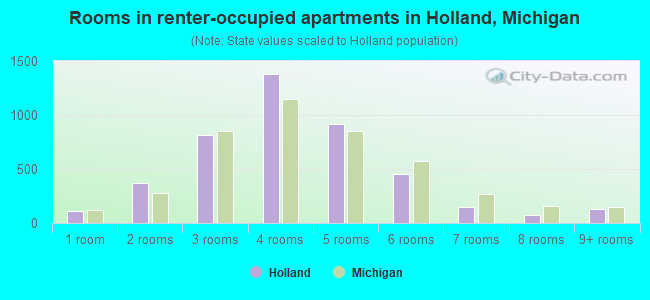
- Rooms in renter-occupied apartments in Holland, Michigan
- 1081 room
- 3682 rooms
- 8173 rooms
- 1,3844 rooms
- 9205 rooms
- 4586 rooms
- 1487 rooms
- 768 rooms
- 1349+ rooms
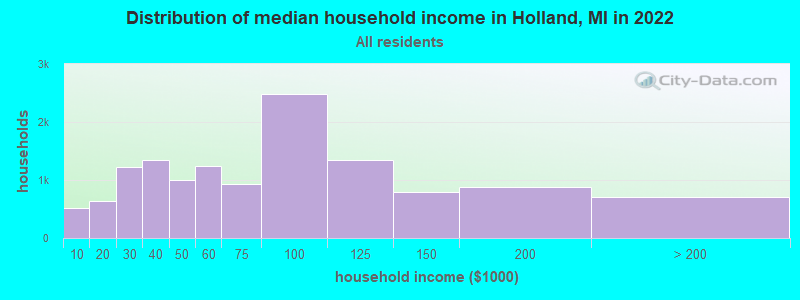
Holland, MI household income distribution

- 524Less than $10,000
- 633$10,000 to $19,999
- 1,227$20,000 to $29,999
- 1,351$30,000 to $39,999
- 993$40,000 to $49,999
- 1,250$50,000 to $59,999
- 923$60,000 to $74,999
- 2,485$75,000 to $99,999
- 1,342$100,000 to $124,999
- 793$125,000 to $149,999
- 883$150,000 to $199,999
- 715$200,000 or more
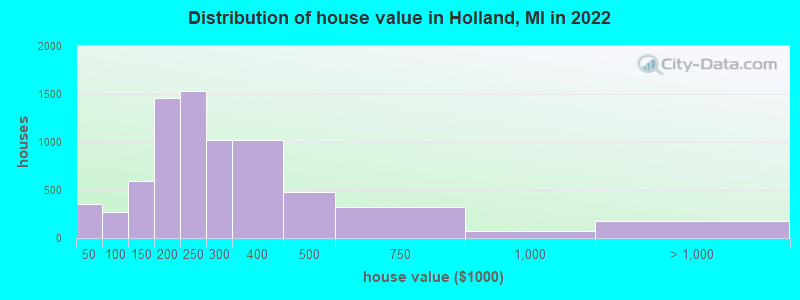
Home value of owner - occupied houses in 2022 in Holland, MI
-
- 76Less than $10,000
- 41$10,000 to $14,999
- 42$15,000 to $19,999
- 40$20,000 to $24,999
- 18$25,000 to $29,999
- 42$30,000 to $34,999
- 31$35,000 to $39,999
- 57$40,000 to $49,999
- 103$60,000 to $69,999
- 69$70,000 to $79,999
- 9$80,000 to $89,999
- 27$90,000 to $99,999
- 284$100,000 to $124,999
- 306$125,000 to $149,999
- 794$150,000 to $174,999
- 667$175,000 to $199,999
- 1,531$200,000 to $249,999
- 1,025$250,000 to $299,999
- 1,019$300,000 to $399,999
- 480$400,000 to $499,999
- 323$500,000 to $749,999
- 69$750,000 to $999,999
- 41$1,000,000 to $1,499,999
- 114$1,500,000 to $1,999,999
- 16$2,000,000 or more
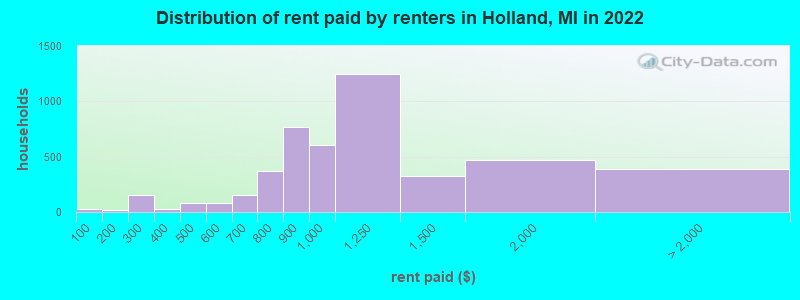
Rent paid by renters in 2022 in Holland, MI
-
- 30Less than $100
- 15$150 to $199
- 137$200 to $249
- 18$250 to $299
- 26$300 to $349
- 27$400 to $449
- 51$450 to $499
- 70$500 to $549
- 14$550 to $599
- 40$600 to $649
- 116$650 to $699
- 146$700 to $749
- 221$750 to $799
- 770$800 to $899
- 602$900 to $999
- 1,244$1,000 to $1,249
- 322$1,250 to $1,499
- 470$1,500 to $1,999
- 22$2,000 to $2,499
- 13$2,500 to $2,999
- 47$3,000 to $3,499
- 18$3,500 or more
- 286No cash rent
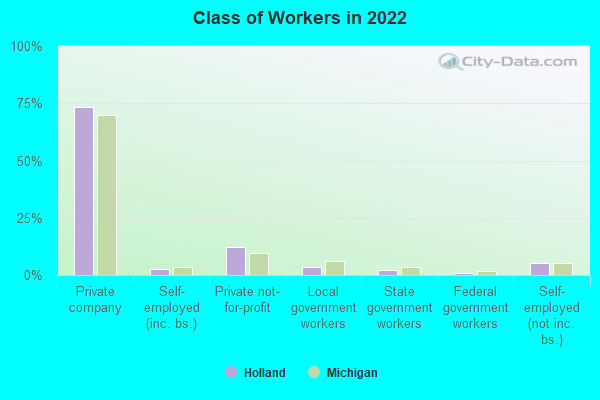
Percentage of workers working in this county: 68.4%
Number of people working at home: 1,527 (8.3% of all workers)
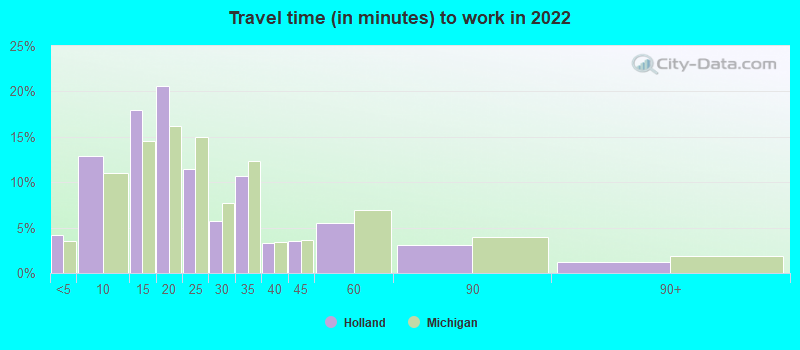
Travel time to work (commute)
- Less than 5 minutes: 1,186
- 5 to 9 minutes: 3,218
- 10 to 14 minutes: 4,387
- 15 to 19 minutes: 2,995
- 20 to 24 minutes: 1,861
- 25 to 29 minutes: 520
- 30 to 34 minutes: 1,150
- 35 to 39 minutes: 179
- 40 to 44 minutes: 277
- 45 to 59 minutes: 667
- 60 to 89 minutes: 304
- 90 or more minutes: 74
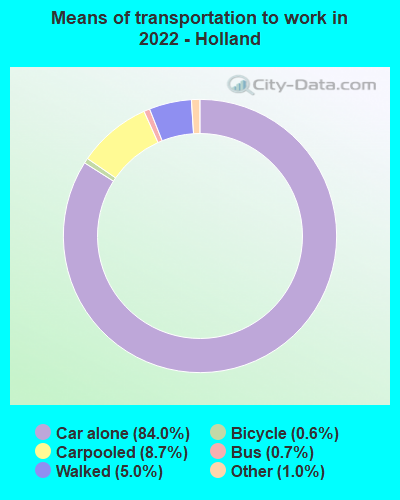
Means of transportation to work:
- Drove a car alone: 26,673 (77.4%)
- Carpooled: 3,154 (9.2%)
- Bus: 286 (0.8%)
- Subway or elevated rail: 2 (0.0%)
- Taxi: 386 (1.1%)
- Bicycle: 231 (0.7%)
- Walked: 1,544 (4.5%)
- Worked at home: 1,527 (4.4%)
- Unemployment by race in 2022
- Unemployment rate for White non-Hispanic residents
- 1.2%Males
- 1.4%Females
- Unemployment rate for Black residents
- 9.0%Males
- 4.2%Females
- Unemployment rate for American Indian and Alaska Native residents
- 5.7%Males
- Unemployment rate for Asian residents
- 1.9%Males
- Unemployment rate for two or more race residents
- 0.3%Males
- 1.7%Females
- Unemployment rate for Hispanic or Latino residents
- 0.2%Males
- 0.4%Females
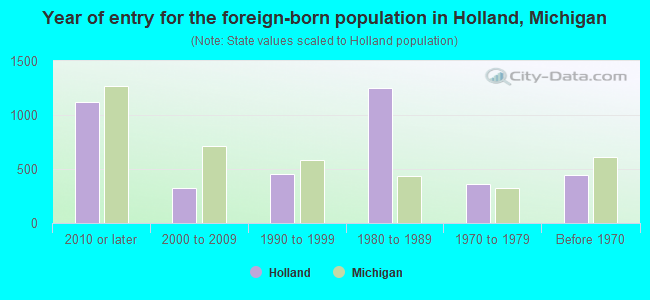
- Year of entry for the foreign-born population in Holland, Michigan
- 1,1162010 or later
- 3242000 to 2009
- 4521990 to 1999
- 1,2471980 to 1989
- 3611970 to 1979
- 442Before 1970
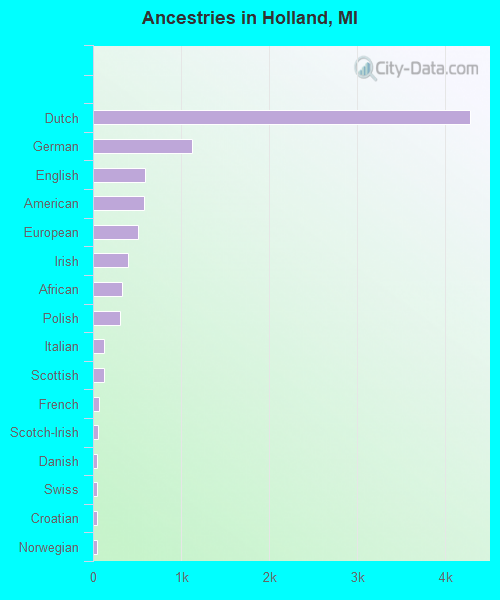
First ancestries reported:
- Dutch: 4,284 (26.2%)
- German: 1,127 (6.9%)
- English: 587 (3.6%)
- American: 576 (3.5%)
- European: 506 (3.1%)
- Irish: 399 (2.4%)
- African: 327 (2.0%)
- Polish: 311 (1.9%)
- Italian: 123 (0.8%)
- Scottish: 122 (0.7%)
- French: 67 (0.4%)
- Scotch-Irish: 57 (0.3%)
- Danish: 50 (0.3%)
- Swiss: 47 (0.3%)
- Croatian: 45 (0.3%)
- Norwegian: 44 (0.3%)
- Swedish: 24 (0.1%)
- Serbian: 23 (0.1%)
- Nigerian: 21 (0.1%)
- Belgian: 17 (0.1%)
- Hungarian: 17 (0.1%)
- Northern European: 17 (0.1%)
- Lebanese: 15 (0.09%)
- Russian: 15 (0.09%)
- Albanian: 14 (0.09%)
- Czech: 14 (0.09%)
- Romanian: 14 (0.09%)
- British: 13 (0.08%)
- Eastern European: 12 (0.07%)
- French Canadian: 12 (0.07%)
- Czechoslovakian: 11 (0.07%)
- Assyrian: 9 (0.05%)
- Greek: 8 (0.05%)
- Ethiopian: 8 (0.05%)
- Canadian: 8 (0.05%)
- Finnish: 7 (0.04%)
- Turkish: 5 (0.03%)
- Welsh: 1 (0.01%)
Most common places of birth for foreign-born residents (%):
| Holland: | 30.6% (760) |
| Michigan: | 10.9% (75,965) |
| Holland: | 13.8% (344) |
| Michigan: | 0.2% (1,657) |
| Holland: | 6.0% (148) |
| Michigan: | 1.8% (12,679) |
| Holland: | 5.8% (143) |
| Michigan: | 0.2% (1,613) |
| Holland: | 4.5% (111) |
| Michigan: | 0.9% (6,481) |
| Holland: | 3.8% (94) |
| Michigan: | 0.2% (1,346) |
| Holland: | 3.1% (76) |
| Michigan: | 5.0% (35,052) |
| Holland: | 2.9% (72) |
| Michigan: | 4.9% (34,295) |
| Holland: | 2.9% (72) |
| Michigan: | 0.5% (3,681) |
| Holland: | 2.2% (55) |
| Michigan: | 1.0% (7,097) |
| Holland: | 2.1% (52) |
| Michigan: | 0.2% (1,499) |
| Holland: | 1.6% (40) |
| Michigan: | 0.1% (670) |
| Holland: | 1.6% (40) |
| Michigan: | 2.3% (16,126) |
| Holland: | 1.6% (39) |
| Michigan: | 3.0% (20,884) |
| Holland: | 1.6% (39) |
| Michigan: | 0.4% (3,027) |
| Holland: | 1.5% (38) |
| Michigan: | 0.9% (6,424) |
Place of birth for U.S.-born residents:
- This state: 23,699
- Other state: 7,920
- Northeast: 849
- Midwest: 3,458
- South: 1,894
- West: 1,697
79.7% of Holland residents lived in the same house 1 years ago.
Out of people who lived in different houses, 29.9% lived in this county.
Out of people who lived in different counties, 71.9% lived in Michigan.
| Holland: | 79.7% |
| State average: | 88.4% |
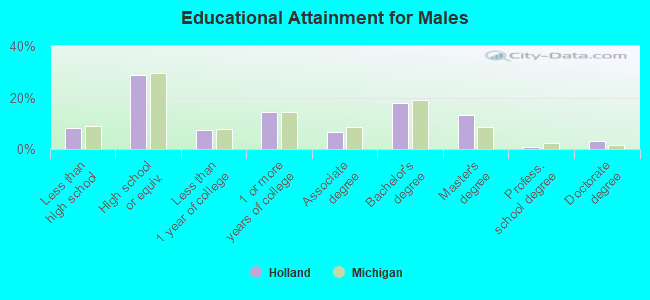
Education attainment for males 25 years and older:
- No schooling: 79
- Nursery to 4th grade: 0
- 5th and 6th grade: 76
- 7th and 8th grade: 87
- 9th grade: 30
- 10th grade: 277
- 11th grade: 76
- 12th grade, no diploma: 219
- High school graduate (or equivalency): 2,981
- Less than 1 year of college: 767
- Some college more than 1 year, no degree: 1,518
- Associate degree: 692
- Bachelor's degree: 1,852
- Master's degree: 1,376
- Professional school degree: 89
- Doctorate degree: 319
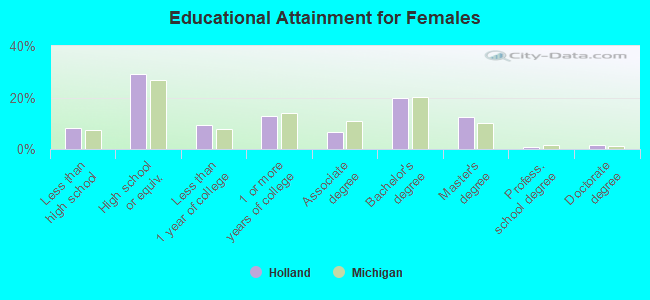
Education attainment for females 25 years and older:
- No schooling: 91
- Nursery to 4th grade: 9
- 5th and 6th grade: 123
- 7th and 8th grade: 167
- 9th grade: 72
- 10th grade: 198
- 11th grade: 112
- 12th grade, no diploma: 114
- High school graduate (or equivalency): 3,224
- Less than 1 year of college: 1,026
- Some college more than 1 year, no degree: 1,410
- Associate degree: 711
- Bachelor's degree: 2,188
- Master's degree: 1,358
- Professional school degree: 88
- Doctorate degree: 177
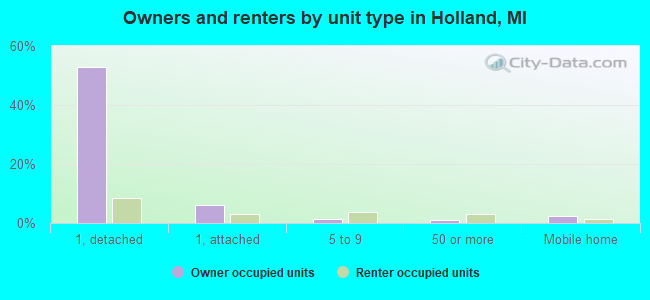
Housing units in structures:
- One, detached: 8,765
- One, attached: 1,119
- Two: 661
- 3 or 4: 797
- 5 to 9: 614
- 10 to 19: 631
- 20 to 49: 294
- 50 or more: 742
- Mobile homes: 372
Median worth of mobile homes: $22,666
Housing units lacking complete kitchen facilities in 2022: 0.3%
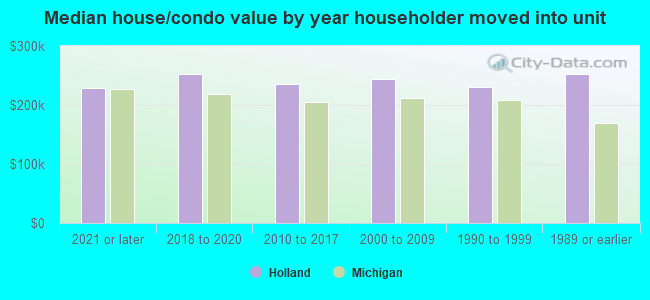
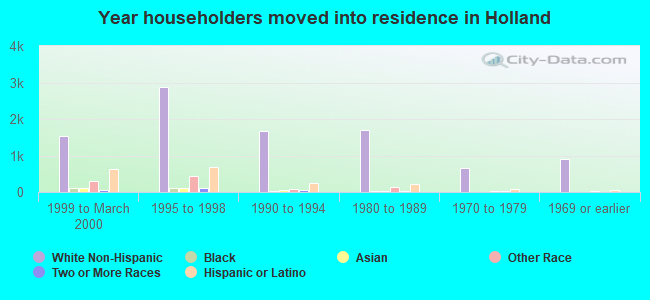
House/condo owner moved in on average 9 years ago
Renter moved in on average 3 years ago
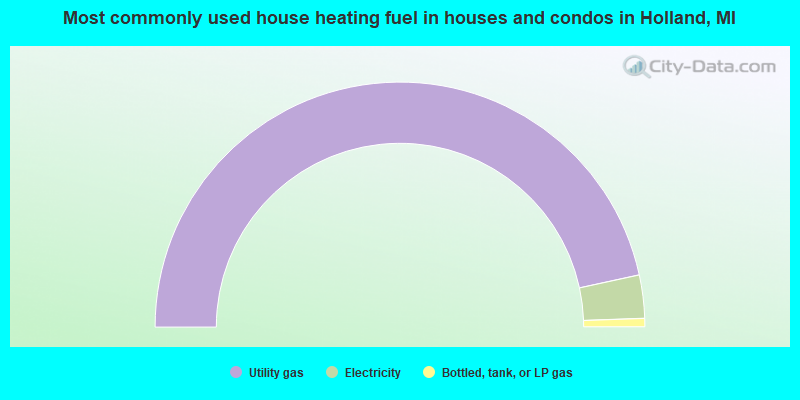
- 93.1%Utility gas
- 5.7%Electricity
- 1.1%Bottled, tank, or LP gas
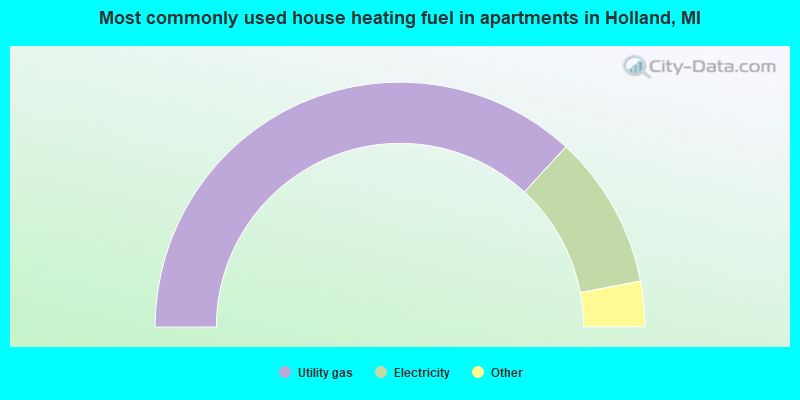
- 73.7%Utility gas
- 20.3%Electricity
- 2.2%Bottled, tank, or LP gas
- 2.1%No fuel used
- 1.7%Other fuel
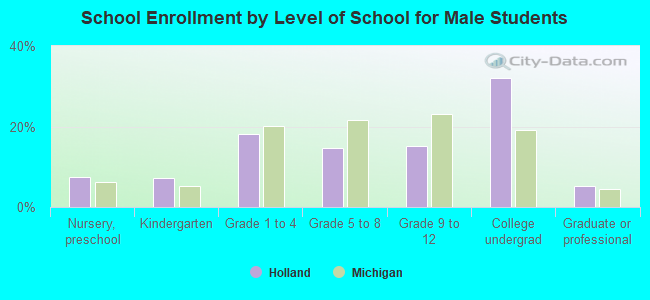
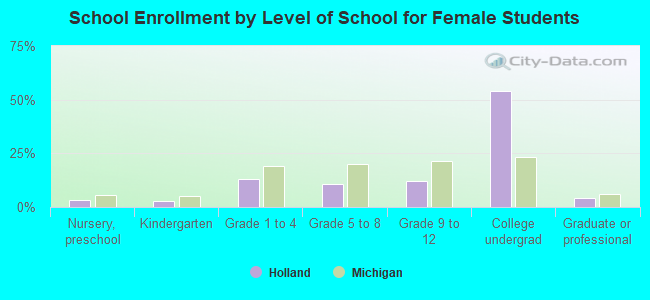
Private vs. public school enrollment:
| Here: | 21.6% |
| Michigan: | 12.4% |
| Here: | 11.2% |
| Michigan: | 9.8% |
| Here: | 44.9% |
| Michigan: | 14.9% |