Holtsville, NY (New York) Houses and Residents
Estimated median house or condo value in 2022: $508,008 (it was $169,800 in 2000 )
Holtsville:
$508,008New York:
$400,400
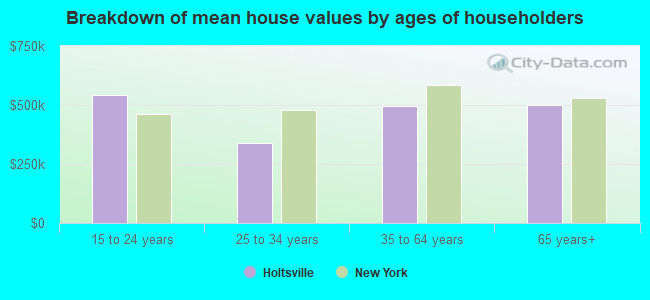
Lower value quartile - upper value quartile: $405,348 - $610,453Mean price in 2022: Detached houses: $509,705 Here:
$509,705State:
$476,719
Townhouses or other attached units: $355,367 Here:
$355,367State:
$699,270
In 2-unit structures: $344,023 Here:
$344,023State:
$713,077
In 3-to-4-unit structures: $202,786 Here:
$202,786State:
$764,568
In 5-or-more-unit structures: $279,900 Here:
$279,900State:
$912,009
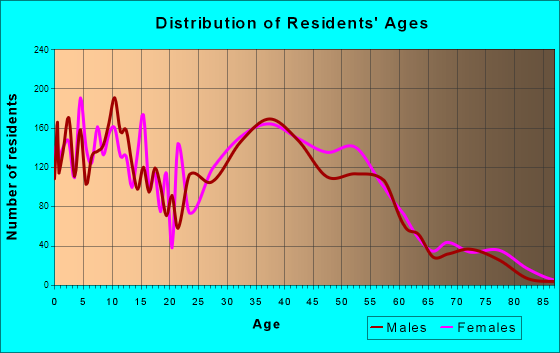
Total population: 19,714 (Urban population: 16,975, Rural population: 0)
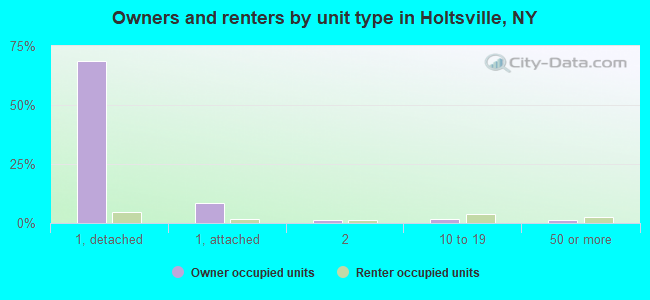
Houses: 6,649 (6,467 occupied: 5,401 owner occupied, 1,063 renter occupied )
% of renters here:
16%State:
46%
Housing density: 956 houses/condos per square mile
Median price asked for vacant for-sale houses and condos in 2022: $381,332.
Median contract rent in 2022: $1,937 (lower quartile is $1,268, upper quartile is over $2,000)
Median rent asked for vacant for-rent units in 2022: $3,613
Median gross rent in Holtsville, NY in 2022: over $2,000
Housing units in Holtsville with a mortgage: 3,802 (401 second mortgage, 7 home equity loan, 388 both second mortgage and home equity loan )Houses without a mortgage: 96
Median household income for houses/condos with a mortgage: $154,273
Median household income for apartments without a mortgage: $81,390
Median monthly housing costs: $2,268
Data:
Median house or condo value ($)
Median house or condo value ($ change since 2000)
Median house or condo value ($) - White
Median house or condo value ($) - Black or African American
Median house or condo value ($) - Asian
Median house or condo value ($) - Hispanic or Latino
Median house or condo value ($) - American Indian and Alaska Native
Median house or condo value ($) - Multirace
Median house or condo value ($) - Other Race
Median price asked for mobile homes ($)
Household density (households per square mile)
Mean house or condo value by units in structure - 1, detached ($)
Mean house or condo value by units in structure - 1, attached ($)
Mean house or condo value by units in structure - 2 ($)
Mean house or condo value by units in structure by units in structure - 3 or 4 ($)
Mean house or condo value by units in structure - 5 or more ($)
Mean house or condo value by units in structure - Boat, RV, van, etc. ($)
Mean house or condo value by units in structure - Mobile home ($)
Median contract rent ($)
Median contract rent - Lower quartile ($)
Median contract rent - Upper quartile ($)
Median gross rent ($)
Urban houses (%)
Rural houses (%)
Houses occupied (%)
Houses occupied (% change since 2000)
Houses owner occupied (%)
Houses owner occupied (% change since 2000)
Houses renter occupied (%)
Houses renter occupied (% change since 2000)
Vacant housing units - For rent (%)
Vacant housing units - For rent (% change since 2000)
Vacant housing units - For sale only (%)
Vacant housing units - For sale only (% change since 2000)
Vacant housing units - Rented or sold, not occupied (%)
Vacant housing units - Rented or sold, not occupied (% change since 2000)
Vacant housing units - For seasonal, recreational, or occasional use (%)
Vacant housing units - For seasonal, recreational, or occasional use (% change since 2000)
Vacant housing units - For migrant workers (%)
Vacant housing units - For migrant workers (% change since 2000)
Vacant housing units - Other vacant (%)
Vacant housing units - Other vacant (% change since 2000)
Median monthly housing costs ($)
Median household income for houses/condos with a mortgage ($)
Median household income for houses/condos without a mortgage ($)
Median household income ($)
Median household income ($) - White
Median household income ($) - Black or African American
Median household income ($) - Asian
Median household income ($) - Hispanic or Latino
Median household income ($) - American Indian and Alaska Native
Median household income ($) - Multirace
Median household income ($) - Other Race
Mortgage status - with mortgage (%)
Mortgage status - with second mortgage (%)
Mortgage status - with home equity loan (%)
Mortgage status - with both second mortgage and home equity loan (%)
Mortgage status - without a mortgage (%)
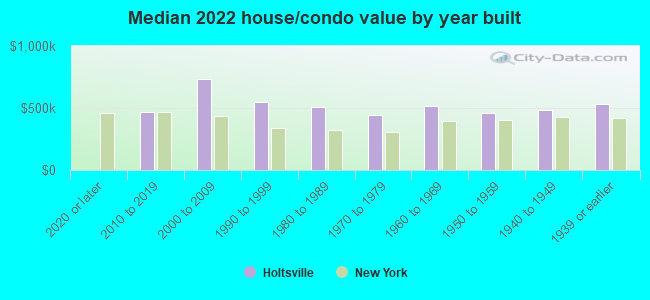
Median year house/condo built
Median year apartment built
Household type by relationship - Male householder living alone (%)
Household type by relationship - Male householder not living alone (%)
Household type by relationship - Female householder living alone (%)
Household type by relationship - Female householder not living alone (%)
Household type by relationship - Opposite-Sex spouse (%)
Household type by relationship - Same-Sex spouse (%)
Household type by relationship - Opposite-Sex unmarried partner (%)
Household type by relationship - Same-Sex unmarried partner (%)
Household type by relationship - In group quarters (%)
Size of family households - 2-person household (%)
Size of family households - 3-person household (%)
Size of family households - 4-person household (%)
Size of family households - 5-person household (%)
Size of family households - 6-person household (%)
Size of family households - 7-or-more-person household (%)
Size of nonfamily households - 1-person household (%)
Size of nonfamily households - 2-person household (%)
Size of nonfamily households - 3-person household (%)
Size of nonfamily households - 4-person household (%)
Size of nonfamily households - 5-person household (%)
Size of nonfamily households - 6-person household (%)
Size of nonfamily households - 7-or-moreperson household (%)
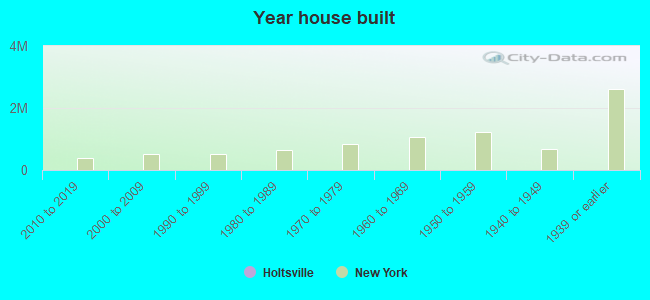
Year house built - Built 2010 or later (%)
Year house built - Built 2000 to 2009 (%)
Year house built - Built 1990 to 1999 (%)
Year house built - Built 1980 to 1989 (%)
Year house built - Built 1970 to 1979 (%)
Year house built - Built 1960 to 1969 (%)
Year house built - Built 1950 to 1959 (%)
Year house built - Built 1940 to 1949 (%)
Year house built - Built 1939 or earlier (%)
Median number of rooms in houses and condos
Median number of rooms in apartments
Median number of bedrooms in owner occupied houses
Mean number of bedrooms in owner occupied houses
Median number of bedrooms in renter occupied houses
Mean number of bedrooms in renter occupied houses
Median number of vehichles in owner occupied houses
Mean number of vehichles in owner occupied houses
Median number of vehichles in renter occupied houses
Mean number of vehichles in renter occupied houses
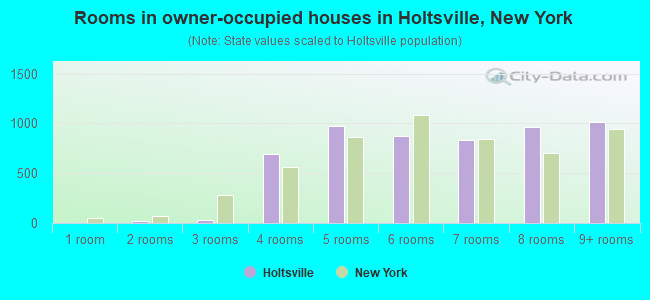
Rooms in owner-occupied houses - 1 room (%)
Rooms in owner-occupied houses - 2 rooms (%)
Rooms in owner-occupied houses - 3 rooms (%)
Rooms in owner-occupied houses - 4 rooms (%)
Rooms in owner-occupied houses - 5 rooms (%)
Rooms in owner-occupied houses - 6 rooms (%)
Rooms in owner-occupied houses - 7 rooms (%)
Rooms in owner-occupied houses - 8 rooms (%)
Rooms in owner-occupied houses - 9+ rooms (%)
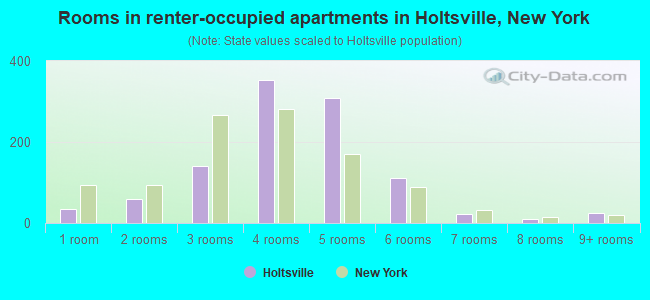
Rooms in renter-occupied houses - 1 room (%)
Rooms in renter-occupied houses - 2 rooms (%)
Rooms in renter-occupied houses - 3 rooms (%)
Rooms in renter-occupied houses - 4 rooms (%)
Rooms in renter-occupied houses - 5 rooms (%)
Rooms in renter-occupied houses - 6 rooms (%)
Rooms in renter-occupied houses - 7 rooms (%)
Rooms in renter-occupied houses - 8 rooms (%)
Rooms in renter-occupied houses - 9+ rooms (%)
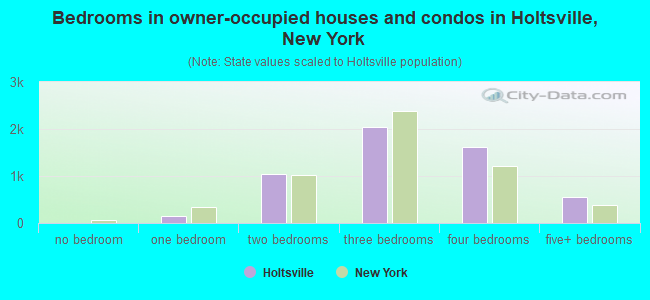
Bedrooms in owner-occupied houses - no bedrooms (%)
Bedrooms in owner-occupied houses - 1 bedroom (%)
Bedrooms in owner-occupied houses - 2 bedrooms (%)
Bedrooms in owner-occupied houses - 3 bedrooms (%)
Bedrooms in owner-occupied houses - 4 bedrooms (%)
Bedrooms in owner-occupied houses - 5+ bedrooms (%)
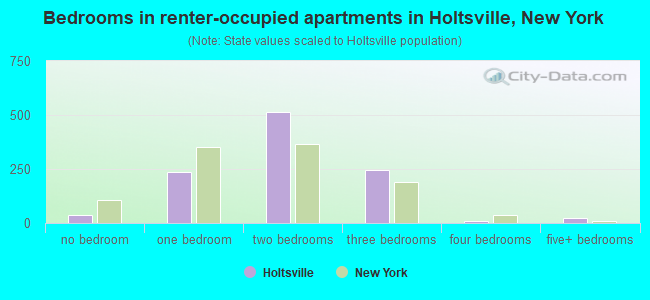
Bedrooms in renter-occupied houses - no bedrooms (%)
Bedrooms in renter-occupied houses - 1 bedroom (%)
Bedrooms in renter-occupied houses - 2 bedrooms (%)
Bedrooms in renter-occupied houses - 3 bedrooms (%)
Bedrooms in renter-occupied houses - 4 bedrooms (%)
Bedrooms in renter-occupied houses - 5+ bedrooms (%)
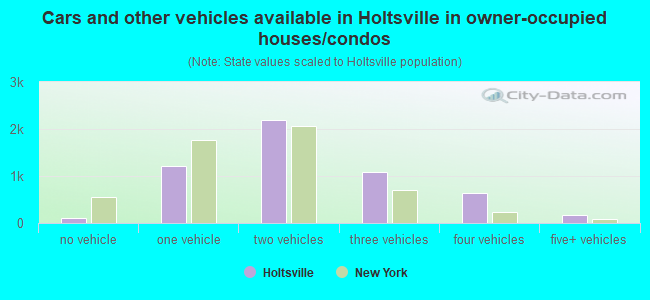
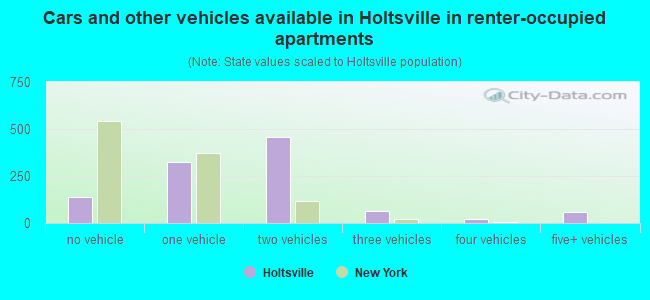
Vehicles available in owner-occupied houses - no vehicle available (%)
Vehicles available in owner-occupied houses - 1 vehicle available(%)
Vehicles available in owner-occupied houses - 2 Vehicles available (%)
Vehicles available in owner-occupied houses - 3 Vehicles available (%)
Vehicles available in owner-occupied houses - 4 Vehicles available (%)
Vehicles available in owner-occupied houses - 5+ Vehicles available (%)
Vehicles available in renter-occupied houses - no vehicle available (%)
Vehicles available in renter-occupied houses - 1 vehicle available (%)
Vehicles available in renter-occupied houses - 2 Vehicles available (%)
Vehicles available in renter-occupied houses - 3 Vehicles available (%)
Vehicles available in renter-occupied houses - 4 Vehicles available (%)
Vehicles available in renter-occupied houses - 5+ Vehicles available (%)
Housing units in structures - 1, detached (%)
Housing units in structures - 1, attached (%)
Housing units in structures - 2 (%)
Housing units in structures - 3 or 4 (%)
Housing units in structures - 5 to 9 (%)
Housing units in structures - 10 to 19 (%)
Housing units in structures - 20 to 49 (%)
Housing units in structures - 50 or more (%)
Housing units in structures - Mobile home (%)
Housing units in structures - Boat, RV, van, etc. (%)
Housing units in structures - Owners - 1, detached (%)
Housing units in structures - Owners - 1, attached (%)
Housing units in structures - Owners - 2 (%)
Housing units in structures - Owners - 3 or 4 (%)
Housing units in structures - Owners - 5 to 9 (%)
Housing units in structures - Owners - 10 to 19 (%)
Housing units in structures - Owners - 20 to 49 (%)
Housing units in structures - Owners - 50 or more (%)
Housing units in structures - Owners - Mobile home (%)
Housing units in structures - Owners - Boat, RV, van, etc. (%)
Housing units in structures - Renters - 1, detached (%)
Housing units in structures - Renters - 1, attached (%)
Housing units in structures - Renters - 2 (%)
Housing units in structures - Renters - 3 or 4 (%)
Housing units in structures - Renters - 5 to 9 (%)
Housing units in structures - Renters - 10 to 19 (%)
Housing units in structures - Renters - 20 to 49 (%)
Housing units in structures - Renters - 50 or more (%)
Housing units in structures - Renters - Mobile home (%)
Housing units in structures - Renters - Boat, RV, van, etc. (%)
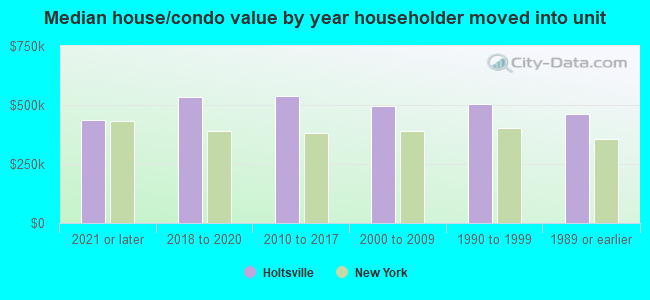
House/condo owner moved in on average (years ago)
Renter moved in on average (years ago)
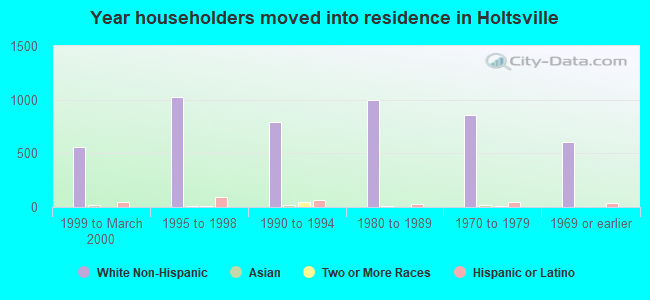
Year householder moved into unit - Moved in 1999 to March 2000 (%)
Year householder moved into unit - Moved in 1999 to March 2000 (%) - White
Year householder moved into unit - Moved in 1999 to March 2000 (%) - Black or African American
Year householder moved into unit - Moved in 1999 to March 2000 (%) - Asian
Year householder moved into unit - Moved in 1999 to March 2000 (%) - Hispanic or Latino
Year householder moved into unit - Moved in 1999 to March 2000 (%) - American Indian and Alaska Native
Year householder moved into unit - Moved in 1999 to March 2000 (%) - Multirace
Year householder moved into unit - Moved in 1999 to March 2000 (%) - Other Race
Year householder moved into unit - Moved in 1995 to 1998 (%)
Year householder moved into unit - Moved in 1995 to 1998 (%) - White
Year householder moved into unit - Moved in 1995 to 1998 (%) - Black or African American
Year householder moved into unit - Moved in 1995 to 1998 (%) - Asian
Year householder moved into unit - Moved in 1995 to 1998 (%) - Hispanic or Latino
Year householder moved into unit - Moved in 1995 to 1998 (%) - American Indian and Alaska Native
Year householder moved into unit - Moved in 1995 to 1998 (%) - Multirace
Year householder moved into unit - Moved in 1995 to 1998 (%) - Other Race
Year householder moved into unit - Moved in 1990 to 1994 (%)
Year householder moved into unit - Moved in 1990 to 1994 (%) - White
Year householder moved into unit - Moved in 1990 to 1994 (%) - Black or African American
Year householder moved into unit - Moved in 1990 to 1994 (%) - Asian
Year householder moved into unit - Moved in 1990 to 1994 (%) - Hispanic or Latino
Year householder moved into unit - Moved in 1990 to 1994 (%) - American Indian and Alaska Native
Year householder moved into unit - Moved in 1990 to 1994 (%) - Multirace
Year householder moved into unit - Moved in 1990 to 1994 (%) - Other Race
Year householder moved into unit - Moved in 1980 to 1989 (%)
Year householder moved into unit - Moved in 1980 to 1989 (%) - White
Year householder moved into unit - Moved in 1980 to 1989 (%) - Black or African American
Year householder moved into unit - Moved in 1980 to 1989 (%) - Asian
Year householder moved into unit - Moved in 1980 to 1989 (%) - Hispanic or Latino
Year householder moved into unit - Moved in 1980 to 1989 (%) - American Indian and Alaska Native
Year householder moved into unit - Moved in 1980 to 1989 (%) - Multirace
Year householder moved into unit - Moved in 1980 to 1989 (%) - Other Race
Year householder moved into unit - Moved in 1970 to 1979 (%)
Year householder moved into unit - Moved in 1970 to 1979 (%) - White
Year householder moved into unit - Moved in 1970 to 1979 (%) - Black or African American
Year householder moved into unit - Moved in 1970 to 1979 (%) - Asian
Year householder moved into unit - Moved in 1970 to 1979 (%) - Hispanic or Latino
Year householder moved into unit - Moved in 1970 to 1979 (%) - American Indian and Alaska Native
Year householder moved into unit - Moved in 1970 to 1979 (%) - Multirace
Year householder moved into unit - Moved in 1970 to 1979 (%) - Other Race
Year householder moved into unit - Moved in 1969 or earlier (%)
Year householder moved into unit - Moved in 1969 or earlier (%) - White
Year householder moved into unit - Moved in 1969 or earlier (%) - Black or African American
Year householder moved into unit - Moved in 1969 or earlier (%) - Asian
Year householder moved into unit - Moved in 1969 or earlier (%) - Hispanic or Latino
Year householder moved into unit - Moved in 1969 or earlier (%) - American Indian and Alaska Native
Year householder moved into unit - Moved in 1969 or earlier (%) - Multirace
Year householder moved into unit - Moved in 1969 or earlier (%) - Other Race
Housing units lacking complete plumbing facilities (%)
Housing units lacking complete kitchen facilities (%)
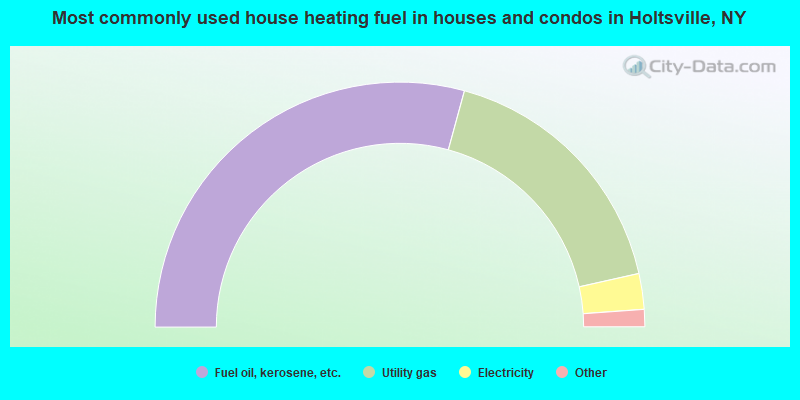
House heating fuel used in houses and condos - Utility gas (%)
House heating fuel used in houses and condos - Bottled, tank, or LP gas (%)
House heating fuel used in houses and condos - Electricity (%)
House heating fuel used in houses and condos - Fuel oil, kerosene, etc. (%)
House heating fuel used in houses and condos - Coal or coke (%)
House heating fuel used in houses and condos - Wood (%)
House heating fuel used in houses and condos - Solar energy (%)
House heating fuel used in houses and condos - Other fuel (%)
House heating fuel used in houses and condos - No fuel used (%)
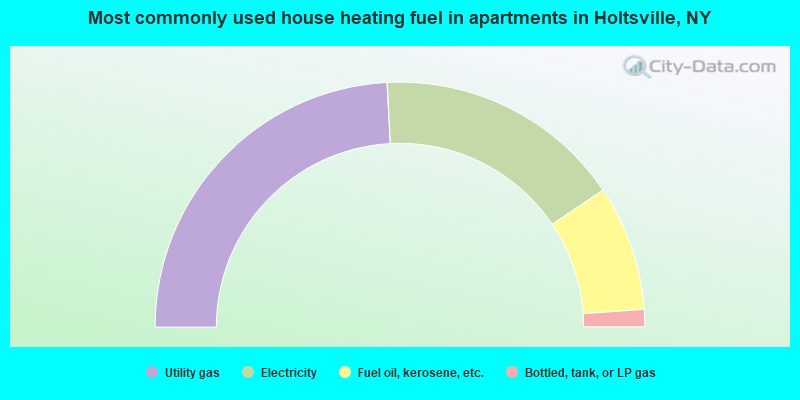
House heating fuel used in apartments - Utility gas (%)
House heating fuel used in apartments - Bottled, tank, or LP gas (%)
House heating fuel used in apartments - Electricity (%)
House heating fuel used in apartments - Fuel oil, kerosene, etc. (%)
House heating fuel used in apartments - Coal or coke (%)
House heating fuel used in apartments - Wood (%)
House heating fuel used in apartments - Solar energy (%)
House heating fuel used in apartments - Other fuel (%)
House heating fuel used in apartments - No fuel used (%)
Latest news about housing in Holtsville, NY collected exclusively by city-data.com from local newspapers, TV, and radio stations
Searching for homes in LI (51 replies)Looking for Nassau or Suffolk County townhome/condo - help (33 replies)Homes in Bohemia, Oakdale, Sayville, Bayport, Islip, Bay Shore, Patchogue, Bellport, Medford, Mastic, Ridge, Kings Park (12 replies)Renting a house in selden (12 replies)Why does anyone on LI still use heating oil? (51 replies)New cesspool (Suffolk) (26 replies)
Median year house/condo built: 1976Median year apartment built: 1983Household type by relationship:
Households: 19,609
Male householders: 3,670 (701 living alone ), Female householders: 2,782 (654 living alone )3,821 spouses (3,789 opposite-sex spouses ), 372 unmarried partners , (355 opposite-sex unmarried partners ), 6,539 children (6,319 natural , 95 adopted , 125 stepchildren ), 332 grandchildren , 328 brothers or sisters , 645 parents , 0 foster children , 556 other relatives , 452 non-relatives In group quarters: 109
Size of family households: 1,501 2-persons , 1,451 3-persons , 1,215 4-persons , 459 5-persons , 171 6-persons , 115 7-or-more-persons .
Size of nonfamily households: 1,366 1-person , 97 2-persons , 36 3-persons .
2,673 married couples with children. single-parent households (274 men , 475 women ).
79.8% of residents of Holtsville speak English at home. of residents speak Spanish at home (56% speak English very well , 31% speak English well , 11% speak English not well , 2% don't speak English at all ).of residents speak other Indo-European language at home (74% speak English very well , 20% speak English well , 5% speak English not well , 2% don't speak English at all ).of residents speak Asian or Pacific Island language at home (47% speak English very well , 37% speak English well , 15% speak English not well , 1% don't speak English at all ).of residents speak other language at home (40% speak English very well , 60% speak English well ).
Foreign born population: 2,594 (13.2%)of them are naturalized citizens )
Median number of rooms in houses and condos:
Median number of rooms in apartments
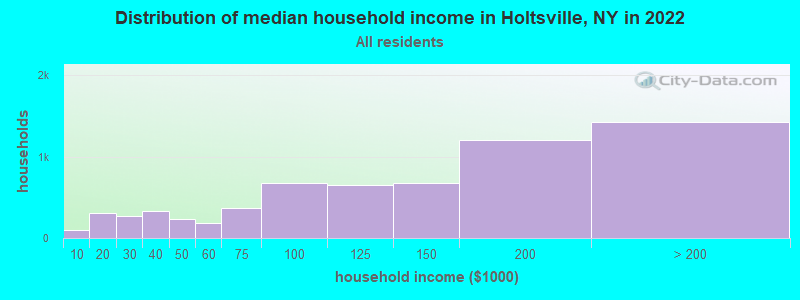
Holtsville, NY household income distribution 102 Less than $10,000303 $10,000 to $19,999272 $20,000 to $29,999337 $30,000 to $39,999235 $40,000 to $49,999190 $50,000 to $59,999369 $60,000 to $74,999674 $75,000 to $99,999651 $100,000 to $124,999682 $125,000 to $149,9991,201 $150,000 to $199,9991,427 $200,000 or more
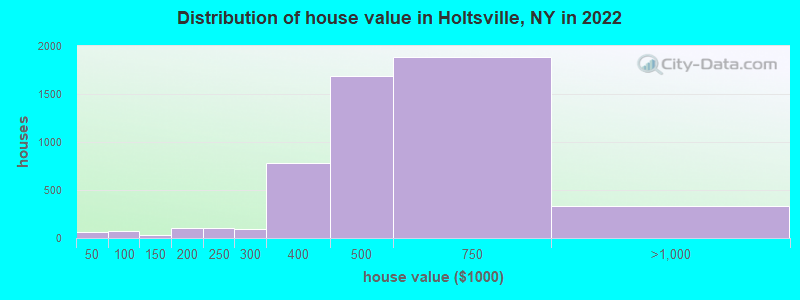
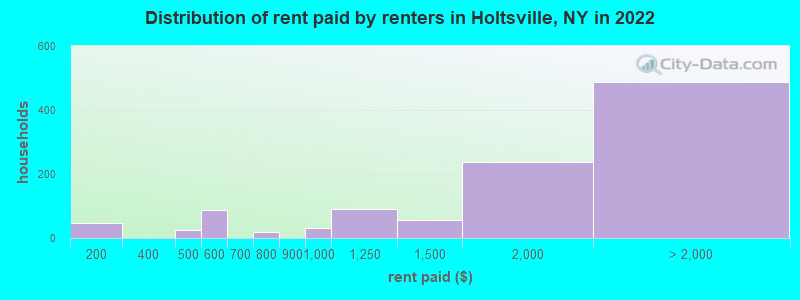
Home value of owner - occupied houses in 2022 in Holtsville, NY 26 Less than $10,0005 $15,000 to $19,9998 $20,000 to $24,9996 $30,000 to $34,99913 $40,000 to $49,99933 $50,000 to $59,99915 $60,000 to $69,99914 $70,000 to $79,9998 $100,000 to $124,99926 $125,000 to $149,99934 $150,000 to $174,99966 $175,000 to $199,999108 $200,000 to $249,99993 $250,000 to $299,999778 $300,000 to $399,9991,685 $400,000 to $499,9991,887 $500,000 to $749,999331 $750,000 to $999,999Rent paid by renters in 2022 in Holtsville, NY 46 $150 to $19914 $400 to $4499 $450 to $49987 $500 to $54917 $750 to $79932 $900 to $99991 $1,000 to $1,24957 $1,250 to $1,499237 $1,500 to $1,999410 $2,000 to $2,49934 $2,500 to $2,99932 $3,500 or more9 No cash rent
Percentage of workers working in this county: 80.4%Number of people working at home: 884 (8.1% of all workers )
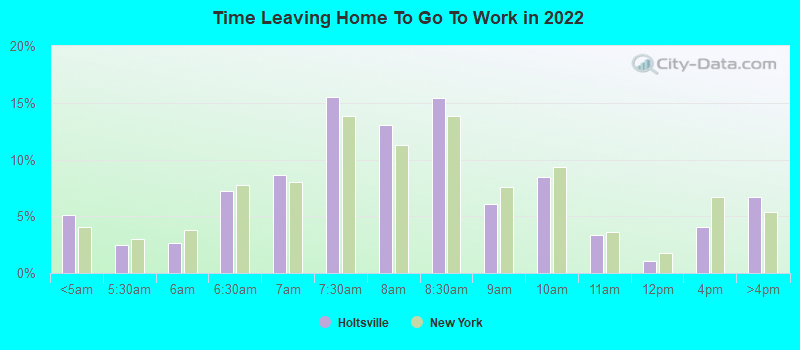
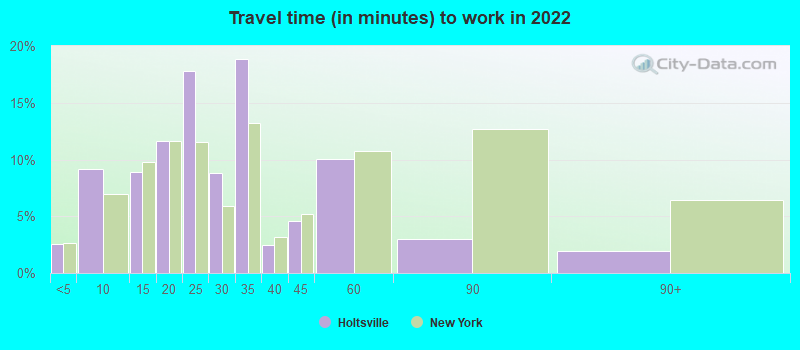
Travel time to work (commute)
Less than 5 minutes: 2255 to 9 minutes: 73710 to 14 minutes: 90715 to 19 minutes: 1,44820 to 24 minutes: 1,51125 to 29 minutes: 57430 to 34 minutes: 1,76235 to 39 minutes: 26240 to 44 minutes: 39045 to 59 minutes: 45360 to 89 minutes: 83090 or more minutes: 695
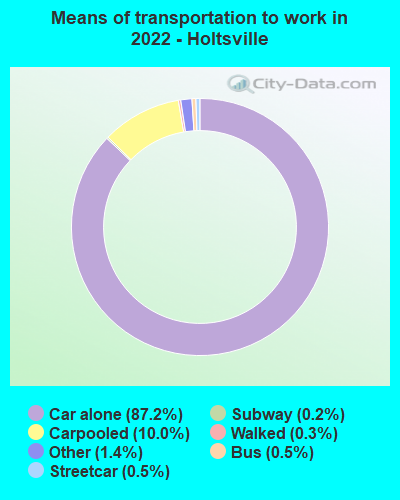
Means of transportation to work:
Drove a car alone: 8,015 (77.1%)Carpooled: 1,054 (10.1%)Bus : 39 (0.4%)Subway or elevated rail : 45 (0.4%)Long-distance train or commuter rail : 20 (0.2%)Taxi: 156 (1.5%)Walked: 31 (0.3%)Worked at home: 884 (8.5%)
Unemployment by race in 2022
Unemployment rate for White non-Hispanic residents 3.0% Males2.5% FemalesUnemployment rate for other race residents 0.4% Males1.2% FemalesUnemployment rate for two or more race residents 6.0% MalesUnemployment rate for Hispanic or Latino residents 2.9% Males2.2% Females
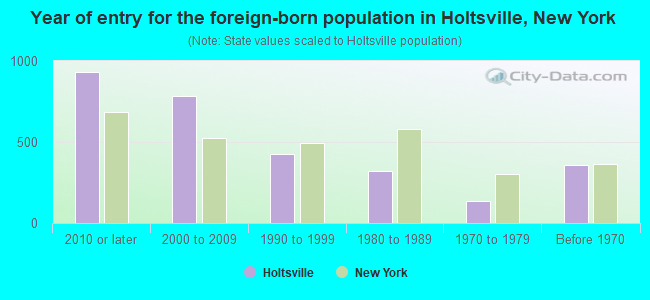
Year of entry for the foreign-born population in Holtsville, New York
930 2010 or later 783 2000 to 2009 427 1990 to 1999 320 1980 to 1989 138 1970 to 1979 356 Before 1970
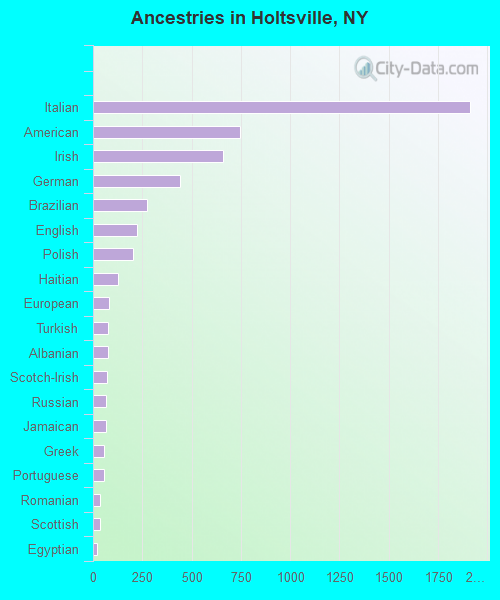
First ancestries reported:
Italian: 1,913 (23.7%)
American: 747 (9.2%)
Irish: 659 (8.2%)
German: 441 (5.5%)
Brazilian: 276 (3.4%)
English: 223 (2.8%)
Polish: 201 (2.5%)
Haitian: 129 (1.6%)
European: 82 (1.0%)
Turkish: 76 (0.9%)
Albanian: 74 (0.9%)
Scotch-Irish: 70 (0.9%)
Russian: 68 (0.8%)
Jamaican: 65 (0.8%)
Greek: 55 (0.7%)
Portuguese: 54 (0.7%)
Romanian: 36 (0.4%)
Scottish: 36 (0.4%)
Egyptian: 19 (0.2%)
Croatian: 16 (0.2%)
Ukrainian: 16 (0.2%)
French Canadian: 13 (0.2%)
Afghan: 12 (0.1%)
Nigerian: 12 (0.1%)
Guyanese: 11 (0.1%)
Moroccan: 10 (0.1%)
Dutch: 8 (0.10%)
Eastern European: 8 (0.10%)
British: 6 (0.07%)
West Indian: 4 (0.05%) Most common places of birth for foreign-born residents (%): Colombia Holtsville:
14.6% (349)New York:
2.5% (111,920)
El Salvador Holtsville:
11.7% (281)New York:
2.4% (108,067)
India Holtsville:
9.1% (218)New York:
3.5% (158,432)
Ecuador Holtsville:
5.4% (129)New York:
3.9% (177,448)
Poland Holtsville:
5.2% (124)New York:
1.4% (65,102)
Mexico Holtsville:
5.2% (124)New York:
4.8% (214,559)
Trinidad and Tobago Holtsville:
4.4% (105)New York:
2.0% (91,428)
Italy Holtsville:
4.1% (99)New York:
1.8% (81,374)
Turkey Holtsville:
3.6% (87)New York:
0.5% (21,009)
Brazil Holtsville:
3.2% (77)New York:
0.7% (30,658)
China, excluding Hong Kong and Taiwan Holtsville:
3.2% (76)New York:
9.1% (410,910)
Guyana Holtsville:
3.1% (73)New York:
3.8% (172,129)
Haiti Holtsville:
2.2% (53)New York:
2.8% (126,936)
Taiwan Holtsville:
2.0% (48)New York:
0.7% (30,619)
Pakistan Holtsville:
2.0% (47)New York:
1.4% (62,442)
Bangladesh Holtsville:
1.8% (43)New York:
2.6% (117,288)
Korea Holtsville:
1.7% (41)New York:
1.8% (82,786)
Place of birth for U.S.-born residents:
This state: 16,010Other state: 776Northeast: 242Midwest: 168South: 128West: 280 93.6% of Holtsville residents lived in the same house 1 years ago.
Out of people who lived in different houses, 38.9% lived in this county.
Out of people who lived in different counties, 99.2% lived in New York.
Holtsville:
93.6%State average:
89.6%
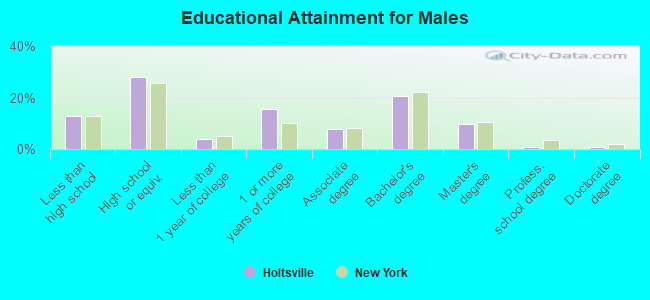
Education attainment for males 25 years and older:
No schooling: 381Nursery to 4th grade: 295th and 6th grade: 227th and 8th grade: 59th grade: 6210th grade: 2111th grade: 17212th grade, no diploma: 185High school graduate (or equivalency): 1,923Less than 1 year of college: 276Some college more than 1 year, no degree: 1,061Associate degree: 540Bachelor's degree: 1,402Master's degree: 663Professional school degree: 51Doctorate degree: 65
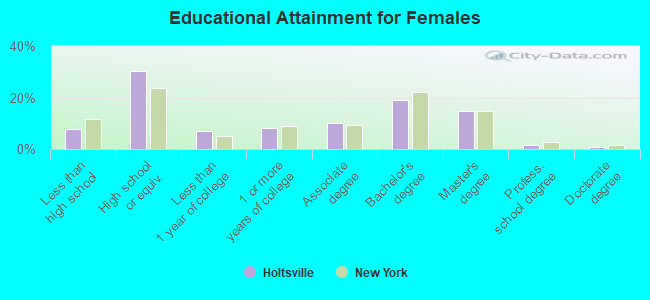
Education attainment for females 25 years and older:
No schooling: 74Nursery to 4th grade: 95th and 6th grade: 07th and 8th grade: 329th grade: 1410th grade: 3011th grade: 22012th grade, no diploma: 167High school graduate (or equivalency): 2,104Less than 1 year of college: 487Some college more than 1 year, no degree: 559Associate degree: 703Bachelor's degree: 1,325Master's degree: 1,035Professional school degree: 114Doctorate degree: 66
Housing units in structures:
One, detached: 4,848One, attached: 713Two: 1903 or 4: 925 to 9: 7710 to 19: 39620 to 49: 8550 or more: 246Housing units lacking complete plumbing facilities in 2022: 0.5%Housing units lacking complete kitchen facilities in 2022: 1.3%House/condo owner moved in on average 14 years ago
Renter moved in on average 3 years ago
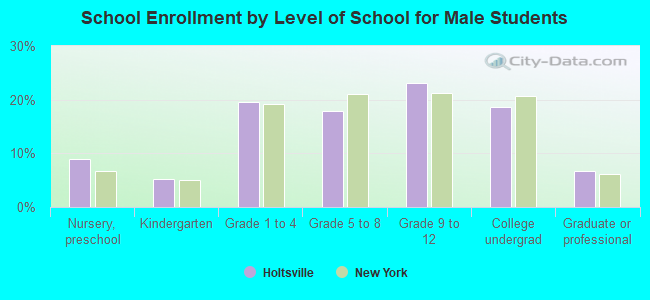
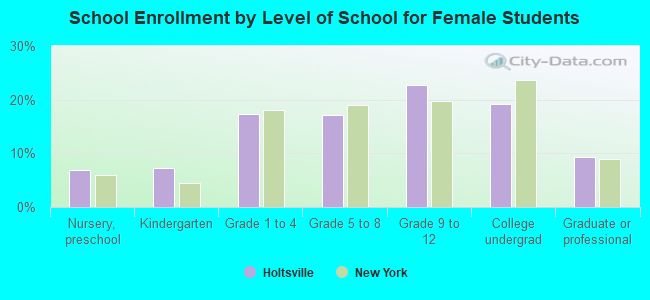
Private vs. public school enrollment:
Students in private schools in grades 1 to 8 (elementary and middle school): 23 Students in private schools in grades 9 to 12 (high school): 50 Students in private undergraduate colleges: 177