Hyde Park, NY (New York) Houses and Residents
| Hyde Park: | $312,168 |
| New York: | $400,400 |
Total population: 21,571 (Urban population: 13,305, Rural population: 7,546 (all nonfarm))
Houses: 7,704 (7,395 occupied: 5,491 owner occupied, 1,904 renter occupied)
| % of renters here: | 26% |
| State: | 46% |
Housing density: 208 houses/condos per square mile
Median price asked for vacant for-sale houses and condos in 2022 in this county: $304,174.
Median contract rent in 2022: $1,247 (lower quartile is $989, upper quartile is $1,561)
Median rent asked for vacant for-rent units in 2022: $1,226
Median gross rent in Hyde Park, NY in 2022: $1,462
Housing units in Hyde Park with a mortgage: 3,135 (260 second mortgage, 501 home equity loan, 9 both second mortgage and home equity loan)
Houses without a mortgage: 1,389
Compare current foreclosures near Hyde Park, NY:
| Photo | Address | Area | Beds / Baths | Price | Details |
|---|---|---|---|---|---|

|
#1
S Quaker Ln
Hyde Park, NY 12538
|
1,300 sq. feet
|
2 baths 3 beds |
show details | |

|
#2
Cardinal Rd
Hyde Park, NY 12538
|
2,692 sq. feet
|
2 baths 3 beds |
show details | |

|
#3
Greentree Dr S
Hyde Park, NY 12538
|
1,396 sq. feet
|
2 baths 2 beds |
show details | |

|
#4
Sherwood Pl
Hyde Park, NY 12538
|
1,320 sq. feet
|
1 baths 3 beds |
show details | |

|
#5
Holt Rd
Hyde Park, NY 12538
|
1,973 sq. feet
|
1 baths 3 beds |
show details | |

|
#6
Hill And Hollow Rd
Hyde Park, NY 12538
|
2,787 sq. feet
|
3 baths 5 beds |
show details | |

|
#7
Holt Rd
Hyde Park, NY 12538
|
1,973 sq. feet
|
1 baths 3 beds |
show details | |

|
#8
Franklin Rd
Hyde Park, NY 12538
|
908 sq. feet
|
1 baths 2 beds |
show details | |

|
#9
Roosevelt Rd
Hyde Park, NY 12538
|
2,667 sq. feet
|
3 baths 5 beds |
show details | |

|
#10
Quaker Hill Dr
Hyde Park, NY 12538
|
1,003 sq. feet
|
1 baths 3 beds |
show details |
| Photo | Address | Area | Beds / Baths | Price | Details |
|---|---|---|---|---|---|

|
#11
Matuk Dr
Hyde Park, NY 12538
|
1,522 sq. feet
|
1 baths 3 beds |
show details | |

|
#12
Sodom Rd
Hyde Park, NY 12538
|
3,729 sq. feet
|
2 baths 4 beds |
show details | |

|
#13
White Birch Rd
Hyde Park, NY 12538
|
1,781 sq. feet
|
1 baths 4 beds |
show details | |

|
#14
E Market St
Hyde Park, NY 12538
|
2,406 sq. feet
|
2 baths 3 beds |
show details | |

|
#15
Travis Rd
Hyde Park, NY 12538
|
1,346 sq. feet
|
1 baths 4 beds |
show details | |

|
#16
Pine Tree Ln
Hyde Park, NY 12538
|
1,726 sq. feet
|
1 baths 3 beds |
show details | |

|
#17
Pinebrook Dr
Hyde Park, NY 12538
|
1,381 sq. feet
|
2 baths 2 beds |
show details | |

|
#18
Rogers Rd
Hyde Park, NY 12538
|
1,984 sq. feet
|
3 baths 4 beds |
show details | |

|
#19
Van Wert Pl
Hyde Park, NY 12538
|
1,152 sq. feet
|
1 baths 2 beds |
show details | |

|
#20
E Market St Apt 6k
Hyde Park, NY 12538
|
- sq. feet
|
- baths - beds |
show details |
| Photo | Address | Area | Beds / Baths | Price | Details |
|---|---|---|---|---|---|

|
#21
Lawrence Rd
Hyde Park, NY 12538
|
- sq. feet
|
- baths - beds |
show details | |

|
#22
E Market St Apt 6g
Hyde Park, NY 12538
|
- sq. feet
|
- baths - beds |
show details | |

|
#23
E Market St Apt 9g
Hyde Park, NY 12538
|
- sq. feet
|
- baths - beds |
show details | |

|
#24
Leisure Ln
Hyde Park, NY 12538
|
- sq. feet
|
- baths - beds |
show details | |

|
#25
Church St
Poughkeepsie, NY 12601
|
1,521 sq. feet
|
1 baths 4 beds |
$25,000
|
show details |

|
#26
Penny Ln
Marlboro, NY 12542
|
2,514 sq. feet
|
2 baths 3 beds |
$299,900
|
show details |

|
#27
Center Rd
High Falls, NY 12440
|
1,250 sq. feet
|
1 baths 2 beds |
$315,000
|
show details |

|
#28
James St
Rosendale, NY 12472
|
1,474 sq. feet
|
2 baths 4 beds |
$279,500
|
show details |

|
#29
Salt Point Tpke
Clinton Corners, NY 12514
|
1,148 sq. feet
|
1 baths 3 beds |
$254,900
|
show details |

|
#30
Tinkertown Rd
Pleasant Valley, NY 12569
|
2,970 sq. feet
|
2 baths 3 beds |
$493,395
|
show details |
| Photo | Address | Area | Beds / Baths | Price | Details |
|---|---|---|---|---|---|

|
#31
Dorothy Hts
Wappingers Falls, NY 12590
|
1,113 sq. feet
|
1 baths 3 beds |
$389,900
|
show details |

|
#32
Brunyswick
New Paltz, NY 12561
|
- sq. feet
|
1 baths 2 beds |
$104,900
|
show details |

|
#33
E Dorsey Ln
Hyde Park, NY 12538
|
- sq. feet
|
- baths - beds |
show details | |

|
#34
Haviland Rd
Hyde Park, NY 12538
|
- sq. feet
|
- baths - beds |
show details | |

|
#35
Lyons Ln
Milton, NY 12547
|
1,872 sq. feet
|
2 baths 3 beds |
$34,900
|
show details |

|
#36
Hamilton Rd
Hopewell Junction, NY 12533
|
2,468 sq. feet
|
3 baths 4 beds |
show details | |

|
#37
Juniper Ln
Saugerties, NY 12477
|
- sq. feet
|
- baths - beds |
$39,900
|
show details |

|
#38
Summit Ave
Hurley, NY 12443
|
3,548 sq. feet
|
3 baths 4 beds |
show details | |

|
#39
Carmine Dr C-8
Wappingers Falls, NY 12590
|
1,064 sq. feet
|
2 baths 2 beds |
show details | |

|
#40
Chestnut Ridge Rd
Dover Plains, NY 12522
|
1,002 sq. feet
|
1 baths 2 beds |
show details |
| Photo | Address | Area | Beds / Baths | Price | Details |
|---|---|---|---|---|---|

|
#41
Fenton Way
Hopewell Junction, NY 12533
|
3,227 sq. feet
|
4 baths 4 beds |
show details | |

|
#42
Pine Hill Rd
Pleasant Valley, NY 12569
|
2,000 sq. feet
|
3 baths 3 beds |
show details | |

|
#43
Purse Ln # 12533
Hopewell Junction, NY 12533
|
910 sq. feet
|
1 baths 2 beds |
show details | |

|
#44
Gray St
Poughkeepsie, NY 12603
|
2,880 sq. feet
|
2 baths 4 beds |
show details | |

|
#45
Ferrara Dr
Rhinebeck, NY 12572
|
1,530 sq. feet
|
2 baths 3 beds |
show details | |

|
#46
All Angels Hill Rd
Wappingers Falls, NY 12590
|
1,196 sq. feet
|
2 baths 3 beds |
show details | |

|
#47
N Elting Corners Rd
Highland, NY 12528
|
2,408 sq. feet
|
2 baths 4 beds |
show details | |

|
#48
Timber Ct
Highland, NY 12528
|
2,792 sq. feet
|
2 baths 3 beds |
show details | |

|
#49
Dogwood St
Kingston, NY 12401
|
1,751 sq. feet
|
2 baths 4 beds |
show details | |

|
Check over 1 million property listings on Foreclosure.com!
|
browse all offers | |||


 | Houses in New Hyde Park (39 replies) |
| Buy or rent in Herricks school district. Or private school in NYC? (25 replies) |
| New Hyde Park House (7 replies) |
| Childhood friends home (1 reply) |
| Homes in Nassau (9 replies) |
| Should I rent in LI for middle/high school? (4 replies) |

Household type by relationship:
Households: 277,523- In family households: 233,367 (50,686 male householders, 22,209 female householders)
56,050 spouses, 84,341 children (79,509 natural, 1,840 adopted, 2,992 stepchildren), 4,231 grandchildren, 2,222 brothers or sisters, 2,827 parents, foster children, 2,945 other relatives, 5,949 non-relatives
- In nonfamily households: 44,156 (16,442 male householders (12,459 living alone)), 18,628 female householders (15,636 living alone)), 9,086 nonrelatives
- In group quarters: 19,965 (8,812 institutionalized population)
50,827 married couples with children.
13,342 single-parent households (2,993 men, 10,349 women).
91.6% of residents of Hyde Park speak English at home.
2.6% of residents speak Spanish at home (51% speak English very well, 19% speak English well, 29% speak English not well, 1% don't speak English at all).
3.1% of residents speak other Indo-European language at home (76% speak English very well, 19% speak English well, 4% speak English not well).
1.4% of residents speak Asian or Pacific Island language at home (55% speak English very well, 41% speak English well, 5% speak English not well).
1.3% of residents speak other language at home (57% speak English very well, 20% speak English well, 20% speak English not well, 2% don't speak English at all).
Foreign born population: 1,554 (7.0%)
(80.6% of them are naturalized citizens)
| Here: | 6.8 |
| State: | 6.3 |
| Here: | 5.2 |
| State: | 3.8 |
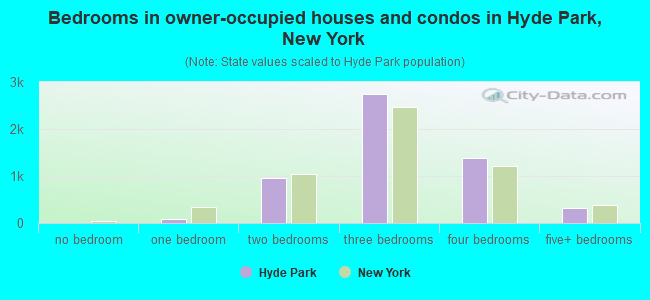
- Bedrooms in owner-occupied houses and condos in Hyde Park, New York
- 6no bedroom
- 851 bedroom
- 9582 bedrooms
- 2,7353 bedrooms
- 1,3914 bedrooms
- 3165+ bedrooms
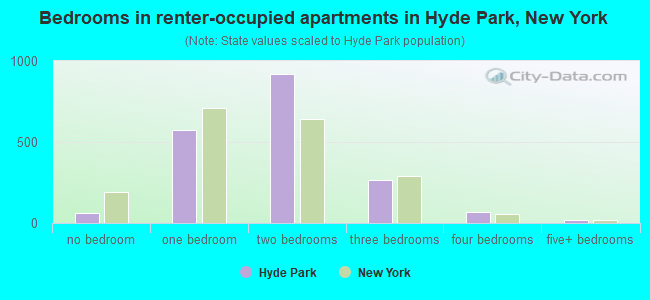
- Bedrooms in renter-occupied apartments in Hyde Park, New York
- 63no bedroom
- 5711 bedroom
- 9192 bedrooms
- 2643 bedrooms
- 664 bedrooms
- 215+ bedrooms
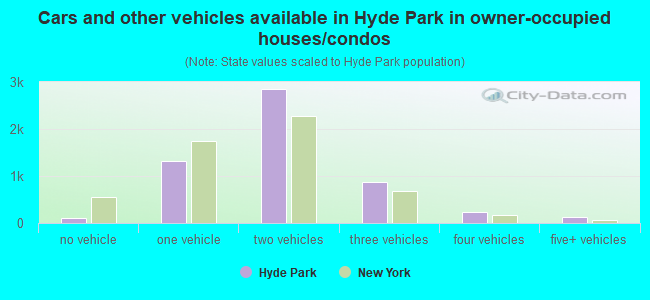
- Cars and other vehicles available in Hyde Park in owner-occupied houses/condos
- 111no vehicle
- 1,3151 vehicle
- 2,8422 vehicles
- 8753 vehicles
- 2294 vehicles
- 1195+ vehicles
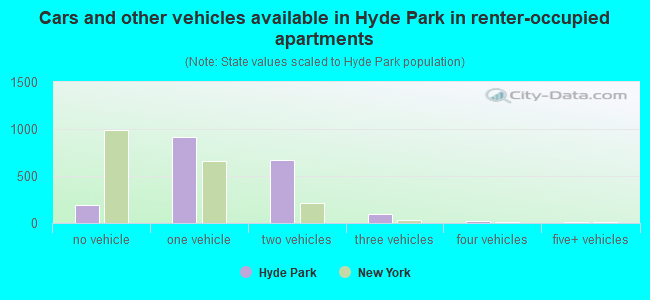
- Cars and other vehicles available in Hyde Park in renter-occupied apartments
- 192no vehicle
- 9121 vehicle
- 6732 vehicles
- 1013 vehicles
- 164 vehicles
- 105+ vehicles
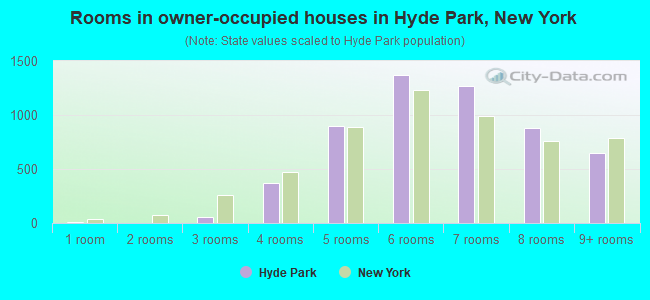
- Rooms in owner-occupied houses in Hyde Park, New York
- 61 room
- 42 rooms
- 513 rooms
- 3664 rooms
- 8985 rooms
- 1,3726 rooms
- 1,2657 rooms
- 8828 rooms
- 6479+ rooms
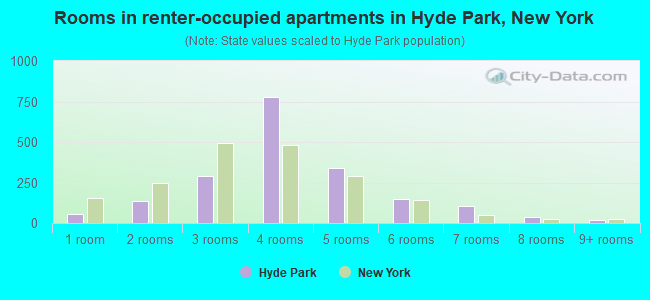
- Rooms in renter-occupied apartments in Hyde Park, New York
- 541 room
- 1372 rooms
- 2903 rooms
- 7804 rooms
- 3375 rooms
- 1496 rooms
- 1027 rooms
- 358 rooms
- 209+ rooms
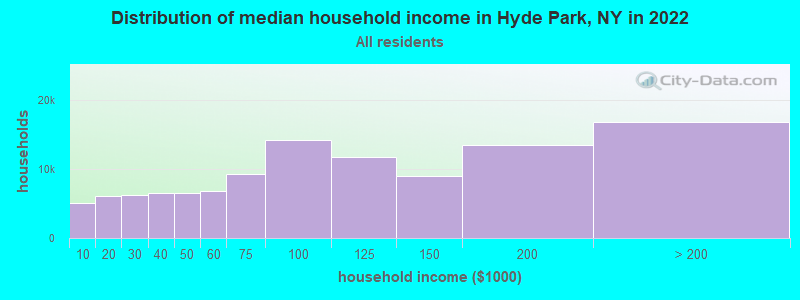
Hyde Park, NY household income distribution

- 5,097Less than $10,000
- 6,105$10,000 to $19,999
- 6,214$20,000 to $29,999
- 6,612$30,000 to $39,999
- 6,601$40,000 to $49,999
- 6,783$50,000 to $59,999
- 9,378$60,000 to $74,999
- 14,273$75,000 to $99,999
- 11,742$100,000 to $124,999
- 8,994$125,000 to $149,999
- 13,476$150,000 to $199,999
- 16,867$200,000 or more
Percentage of workers working in this county: 85.4%
Number of people working at home: 1,725 (15.7% of all workers)
Travel time to work (commute)
- Less than 5 minutes: 220
- 5 to 9 minutes: 850
- 10 to 14 minutes: 1,661
- 15 to 19 minutes: 1,544
- 20 to 24 minutes: 1,583
- 25 to 29 minutes: 520
- 30 to 34 minutes: 964
- 35 to 39 minutes: 215
- 40 to 44 minutes: 440
- 45 to 59 minutes: 604
- 60 to 89 minutes: 362
- 90 or more minutes: 400
Means of transportation to work:
- Drove a car alone: 7,952 (83.3%)
- Carpooled: 929 (9.7%)
- Bus or trolley bus: 73 (0.8%)
- Subway or elevated: 7 (0.1%)
- Railroad: 130 (1.4%)
- Motorcycle: 13 (0.1%)
- Walked: 207 (2.2%)
- Other means: 52 (0.5%)
- Worked at home: 186 (1.9%)
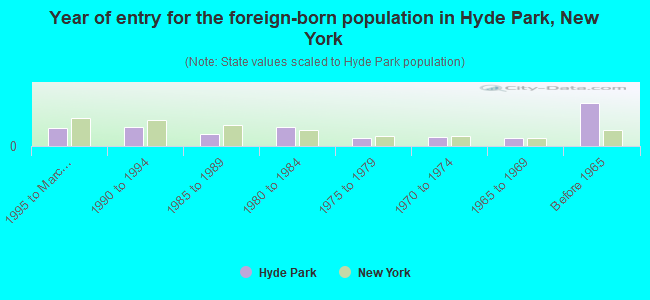
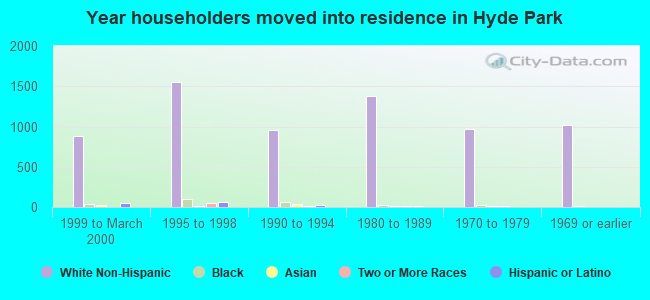
- Year of entry for the foreign-born population in Hyde Park, New York
- 1341995 to March 2000
- 1431990 to 1994
- 931985 to 1989
- 1411980 to 1984
- 621975 to 1979
- 661970 to 1974
- 581965 to 1969
- 322Before 1965
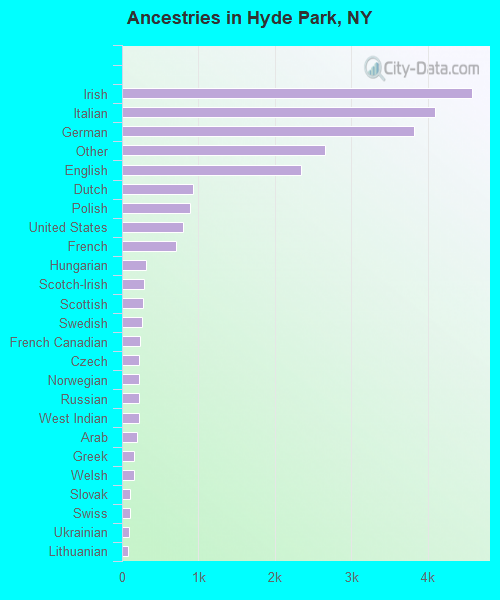
First ancestries reported:
- Irish: 4,572 (18.9%)
- Italian: 4,091 (16.9%)
- German: 3,819 (15.8%)
- Other: 2,652 (11.0%)
- English: 2,342 (9.7%)
- Dutch: 928 (3.8%)
- Polish: 896 (3.7%)
- United States: 798 (3.3%)
- French: 705 (2.9%)
- Hungarian: 313 (1.3%)
- Scotch-Irish: 292 (1.2%)
- Scottish: 275 (1.1%)
- Swedish: 260 (1.1%)
- French Canadian: 241 (1.0%)
- Czech: 228 (0.9%)
- Norwegian: 227 (0.9%)
- Russian: 220 (0.9%)
- West Indian: 217 (0.9%)
- Arab: 202 (0.8%)
- Greek: 162 (0.7%)
- Welsh: 151 (0.6%)
- Slovak: 104 (0.4%)
- Swiss: 99 (0.4%)
- Ukrainian: 96 (0.4%)
- Lithuanian: 83 (0.3%)
- Subsaharan African: 67 (0.3%)
- Danish: 59 (0.2%)
- Portuguese: 44 (0.2%)
Most common places of birth for foreign-born residents (%):
| Hyde Park: | 6.6% (67) |
| New York: | 3.0% (117,238) |
| Hyde Park: | 6.6% (67) |
| New York: | 0.1% (4,084) |
| Hyde Park: | 6.4% (65) |
| New York: | 3.8% (147,729) |
| Hyde Park: | 6.4% (65) |
| New York: | 2.5% (97,933) |
| Hyde Park: | 6.1% (62) |
| New York: | 1.6% (62,237) |
| Hyde Park: | 5.7% (58) |
| New York: | 1.8% (69,327) |
| Hyde Park: | 5.3% (54) |
| New York: | 6.0% (233,766) |
| Hyde Park: | 5.2% (53) |
| New York: | 0.5% (20,310) |
| Hyde Park: | 4.8% (49) |
| New York: | 2.0% (78,538) |
| Hyde Park: | 3.1% (32) |
| New York: | 0.3% (13,246) |
| Hyde Park: | 3.0% (31) |
| New York: | 5.9% (226,470) |
| Hyde Park: | 3.0% (31) |
| New York: | 2.4% (94,595) |
| Hyde Park: | 2.9% (30) |
| New York: | 2.5% (98,473) |
| Hyde Park: | 2.8% (29) |
| New York: | 1.9% (72,408) |
| Hyde Park: | 2.7% (28) |
| New York: | 4.2% (161,189) |
| Hyde Park: | 2.5% (25) |
| New York: | 1.4% (54,876) |
| Hyde Park: | 2.4% (24) |
| New York: | 1.4% (53,825) |
| Hyde Park: | 1.8% (18) |
| New York: | 1.1% (41,934) |
| Hyde Park: | 1.7% (17) |
| New York: | 0.8% (30,473) |
| Hyde Park: | 1.7% (17) |
| New York: | 0.5% (19,907) |
Place of birth for U.S.-born residents:
- This state: 15,564
- Other state: 4,088
- Northeast: 1,952
- Midwest: 897
- South: 954
- West: 285
61% of Hyde Park residents lived in the same house 5 years ago.
Out of people who lived in different houses, 61% lived in this county.
Out of people who lived in different counties, 58% lived in New York.
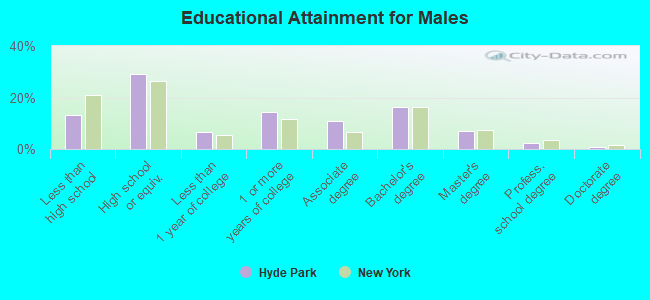
Education attainment for males 25 years and older:
- No schooling: 18
- Nursery to 4th grade: 8
- 5th and 6th grade: 37
- 7th and 8th grade: 116
- 9th grade: 93
- 10th grade: 181
- 11th grade: 140
- 12th grade, no diploma: 250
- High school graduate (or equivalency): 1,847
- Less than 1 year of college: 410
- Some college more than 1 year, no degree: 921
- Associate degree: 685
- Bachelor's degree: 1,043
- Master's degree: 437
- Professional school degree: 137
- Doctorate degree: 38
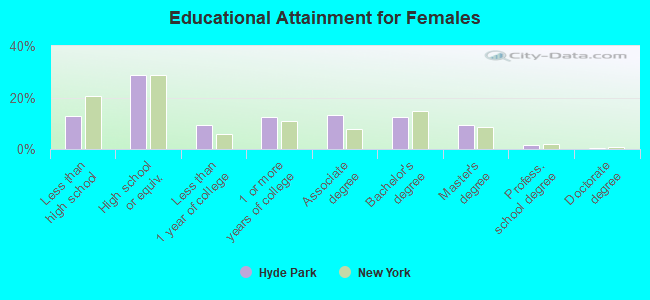
Education attainment for females 25 years and older:
- No schooling: 11
- Nursery to 4th grade: 8
- 5th and 6th grade: 12
- 7th and 8th grade: 149
- 9th grade: 191
- 10th grade: 184
- 11th grade: 131
- 12th grade, no diploma: 211
- High school graduate (or equivalency): 1,994
- Less than 1 year of college: 643
- Some college more than 1 year, no degree: 861
- Associate degree: 903
- Bachelor's degree: 849
- Master's degree: 650
- Professional school degree: 97
- Doctorate degree: 39
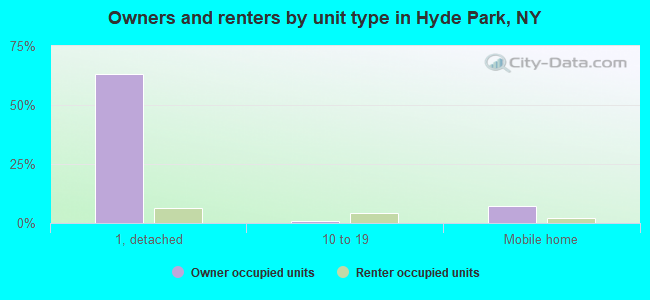
Housing units in structures:
- One, detached: 5,301
- One, attached: 158
- Two: 302
- 3 or 4: 362
- 5 to 9: 352
- 10 to 19: 425
- 20 to 49: 35
- 50 or more: 27
- Mobile homes: 733
- Boats, RVs, vans, etc.: 9
Median worth of mobile homes: $85,168
Housing units lacking complete kitchen facilities: 0.7%
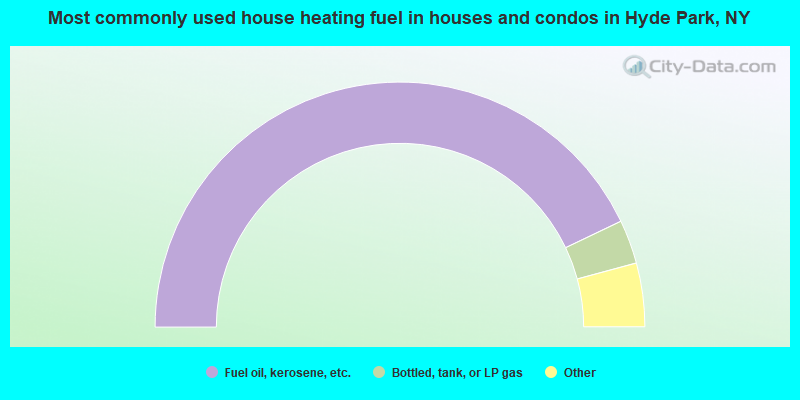
- 85.8%Fuel oil, kerosene, etc.
- 5.8%Bottled, tank, or LP gas
- 3.9%Electricity
- 2.8%Utility gas
- 1.1%Wood
- 0.3%Other fuel
- 0.2%Coal or coke
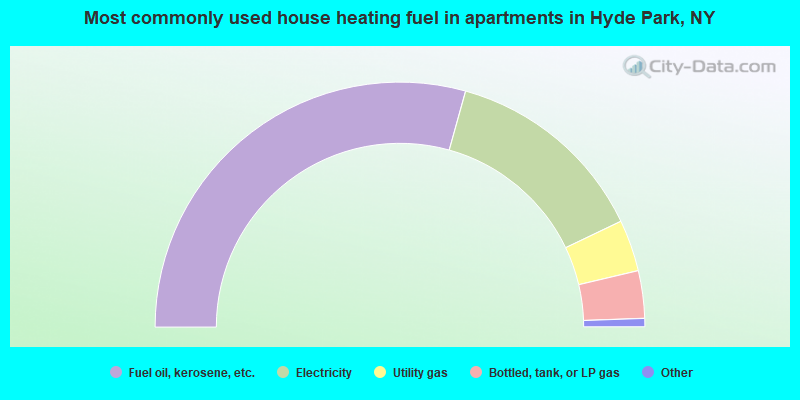
- 58.7%Fuel oil, kerosene, etc.
- 27.2%Electricity
- 6.8%Utility gas
- 6.3%Bottled, tank, or LP gas
- 0.7%Other fuel
- 0.4%Wood
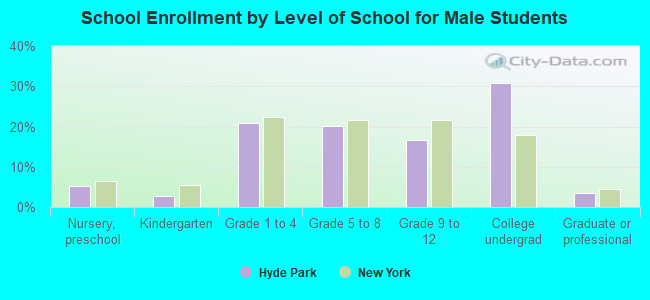
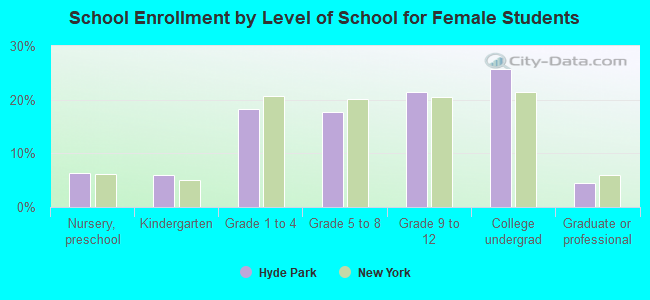
Private vs. public school enrollment:
| Here: | 13.9% |
| New York: | 14.0% |
| Here: | 10.6% |
| New York: | 13.2% |
| Here: | 30.9% |
| New York: | 38.2% |