Iowa City, IA (Iowa) Houses and Residents
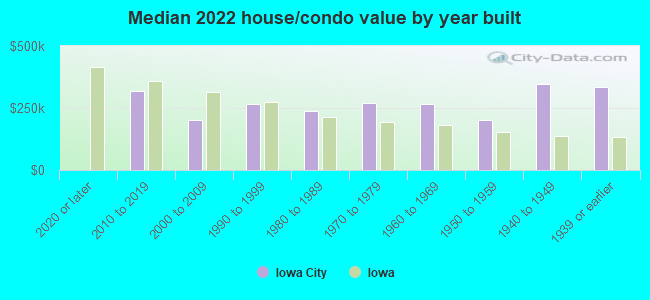
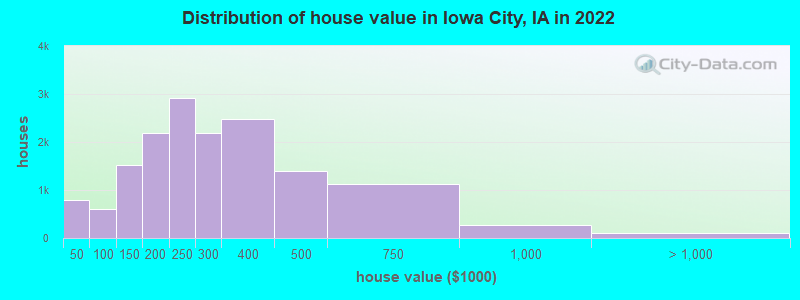
Estimated median house or condo value in 2022: $268,000 (it was $121,400 in 2000 )
Iowa City:
$268,000Iowa:
$194,600
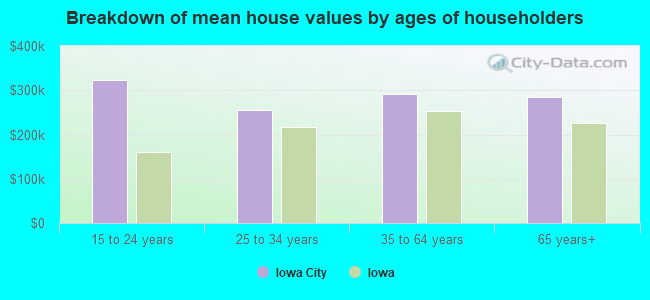
Lower value quartile - upper value quartile: $193,600 - $384,600Mean price in 2022: Detached houses: $349,833 Here:
$349,833State:
$245,224
Townhouses or other attached units: $263,234 Here:
$263,234State:
$238,767
In 2-unit structures: $181,258 Here:
$181,258State:
$243,070
In 3-to-4-unit structures: $273,647 Here:
$273,647State:
$162,139
In 5-or-more-unit structures: $250,335 Here:
$250,335State:
$190,519
Mobile homes: $29,106 Here:
$29,106State:
$51,271
Total population: 73,415 (Urban population: 61,196, Rural population: 1,185 (16 farm, 1,169 nonfarm ))
Houses: 33,446 (29,763 occupied: 14,321 owner occupied, 15,442 renter occupied )
% of renters here:
52%State:
28%
Housing density: 1,384 houses/condos per square mile
Median price asked for vacant for-sale houses and condos in 2022: $275,186.
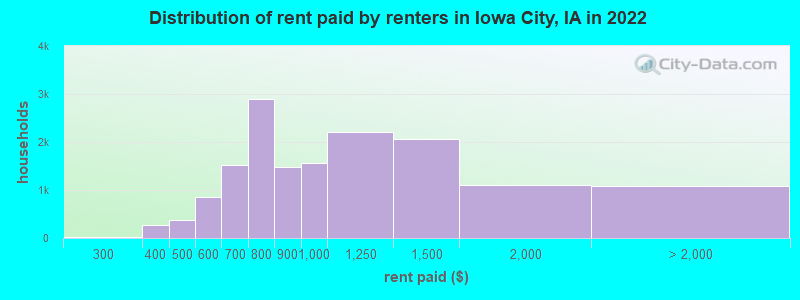
Median contract rent in 2022: $914 (lower quartile is $742, upper quartile is $1,281)
Median rent asked for vacant for-rent units in 2022: $2,246
Median gross rent in Iowa City, IA in 2022: $1,048
Housing units in Iowa City with a mortgage: 7,609 (830 second mortgage, 0 home equity loan, 735 both second mortgage and home equity loan )Houses without a mortgage: 548
Median household income for houses/condos with a mortgage: $114,929
Median household income for apartments without a mortgage: $84,516
Median monthly housing costs: $1,093
Data:
Median house or condo value ($)
Median house or condo value ($ change since 2000)
Median house or condo value ($) - White
Median house or condo value ($) - Black or African American
Median house or condo value ($) - Asian
Median house or condo value ($) - Hispanic or Latino
Median house or condo value ($) - American Indian and Alaska Native
Median house or condo value ($) - Multirace
Median house or condo value ($) - Other Race
Median price asked for mobile homes ($)
Household density (households per square mile)
Mean house or condo value by units in structure - 1, detached ($)
Mean house or condo value by units in structure - 1, attached ($)
Mean house or condo value by units in structure - 2 ($)
Mean house or condo value by units in structure by units in structure - 3 or 4 ($)
Mean house or condo value by units in structure - 5 or more ($)
Mean house or condo value by units in structure - Boat, RV, van, etc. ($)
Mean house or condo value by units in structure - Mobile home ($)
Median contract rent ($)
Median contract rent - Lower quartile ($)
Median contract rent - Upper quartile ($)
Median gross rent ($)
Urban houses (%)
Rural houses (%)
Houses occupied (%)
Houses occupied (% change since 2000)
Houses owner occupied (%)
Houses owner occupied (% change since 2000)
Houses renter occupied (%)
Houses renter occupied (% change since 2000)
Vacant housing units - For rent (%)
Vacant housing units - For rent (% change since 2000)
Vacant housing units - For sale only (%)
Vacant housing units - For sale only (% change since 2000)
Vacant housing units - Rented or sold, not occupied (%)
Vacant housing units - Rented or sold, not occupied (% change since 2000)
Vacant housing units - For seasonal, recreational, or occasional use (%)
Vacant housing units - For seasonal, recreational, or occasional use (% change since 2000)
Vacant housing units - For migrant workers (%)
Vacant housing units - For migrant workers (% change since 2000)
Vacant housing units - Other vacant (%)
Vacant housing units - Other vacant (% change since 2000)
Median monthly housing costs ($)
Median household income for houses/condos with a mortgage ($)
Median household income for houses/condos without a mortgage ($)
Median household income ($)
Median household income ($) - White
Median household income ($) - Black or African American
Median household income ($) - Asian
Median household income ($) - Hispanic or Latino
Median household income ($) - American Indian and Alaska Native
Median household income ($) - Multirace
Median household income ($) - Other Race
Mortgage status - with mortgage (%)
Mortgage status - with second mortgage (%)
Mortgage status - with home equity loan (%)
Mortgage status - with both second mortgage and home equity loan (%)
Mortgage status - without a mortgage (%)
Median year house/condo built
Median year apartment built
Household type by relationship - Male householder living alone (%)
Household type by relationship - Male householder not living alone (%)
Household type by relationship - Female householder living alone (%)
Household type by relationship - Female householder not living alone (%)
Household type by relationship - Opposite-Sex spouse (%)
Household type by relationship - Same-Sex spouse (%)
Household type by relationship - Opposite-Sex unmarried partner (%)
Household type by relationship - Same-Sex unmarried partner (%)
Household type by relationship - In group quarters (%)
Size of family households - 2-person household (%)
Size of family households - 3-person household (%)
Size of family households - 4-person household (%)
Size of family households - 5-person household (%)
Size of family households - 6-person household (%)
Size of family households - 7-or-more-person household (%)
Size of nonfamily households - 1-person household (%)
Size of nonfamily households - 2-person household (%)
Size of nonfamily households - 3-person household (%)
Size of nonfamily households - 4-person household (%)
Size of nonfamily households - 5-person household (%)
Size of nonfamily households - 6-person household (%)
Size of nonfamily households - 7-or-moreperson household (%)
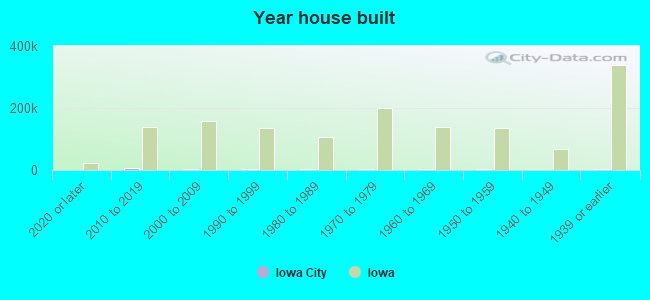
Year house built - Built 2010 or later (%)
Year house built - Built 2000 to 2009 (%)
Year house built - Built 1990 to 1999 (%)
Year house built - Built 1980 to 1989 (%)
Year house built - Built 1970 to 1979 (%)
Year house built - Built 1960 to 1969 (%)
Year house built - Built 1950 to 1959 (%)
Year house built - Built 1940 to 1949 (%)
Year house built - Built 1939 or earlier (%)
Median number of rooms in houses and condos
Median number of rooms in apartments
Median number of bedrooms in owner occupied houses
Mean number of bedrooms in owner occupied houses
Median number of bedrooms in renter occupied houses
Mean number of bedrooms in renter occupied houses
Median number of vehichles in owner occupied houses
Mean number of vehichles in owner occupied houses
Median number of vehichles in renter occupied houses
Mean number of vehichles in renter occupied houses
Rooms in owner-occupied houses - 1 room (%)
Rooms in owner-occupied houses - 2 rooms (%)
Rooms in owner-occupied houses - 3 rooms (%)
Rooms in owner-occupied houses - 4 rooms (%)
Rooms in owner-occupied houses - 5 rooms (%)
Rooms in owner-occupied houses - 6 rooms (%)
Rooms in owner-occupied houses - 7 rooms (%)
Rooms in owner-occupied houses - 8 rooms (%)
Rooms in owner-occupied houses - 9+ rooms (%)
Rooms in renter-occupied houses - 1 room (%)
Rooms in renter-occupied houses - 2 rooms (%)
Rooms in renter-occupied houses - 3 rooms (%)
Rooms in renter-occupied houses - 4 rooms (%)
Rooms in renter-occupied houses - 5 rooms (%)
Rooms in renter-occupied houses - 6 rooms (%)
Rooms in renter-occupied houses - 7 rooms (%)
Rooms in renter-occupied houses - 8 rooms (%)
Rooms in renter-occupied houses - 9+ rooms (%)
Bedrooms in owner-occupied houses - no bedrooms (%)
Bedrooms in owner-occupied houses - 1 bedroom (%)
Bedrooms in owner-occupied houses - 2 bedrooms (%)
Bedrooms in owner-occupied houses - 3 bedrooms (%)
Bedrooms in owner-occupied houses - 4 bedrooms (%)
Bedrooms in owner-occupied houses - 5+ bedrooms (%)
Bedrooms in renter-occupied houses - no bedrooms (%)
Bedrooms in renter-occupied houses - 1 bedroom (%)
Bedrooms in renter-occupied houses - 2 bedrooms (%)
Bedrooms in renter-occupied houses - 3 bedrooms (%)
Bedrooms in renter-occupied houses - 4 bedrooms (%)
Bedrooms in renter-occupied houses - 5+ bedrooms (%)
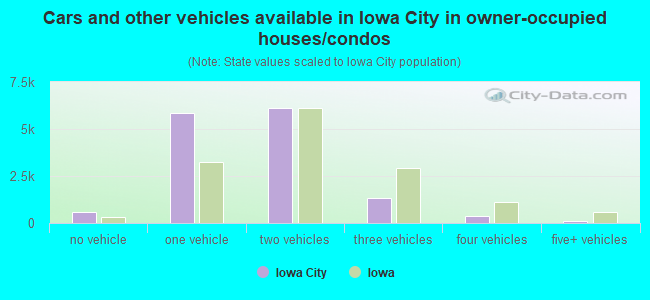
Vehicles available in owner-occupied houses - no vehicle available (%)
Vehicles available in owner-occupied houses - 1 vehicle available(%)
Vehicles available in owner-occupied houses - 2 Vehicles available (%)
Vehicles available in owner-occupied houses - 3 Vehicles available (%)
Vehicles available in owner-occupied houses - 4 Vehicles available (%)
Vehicles available in owner-occupied houses - 5+ Vehicles available (%)
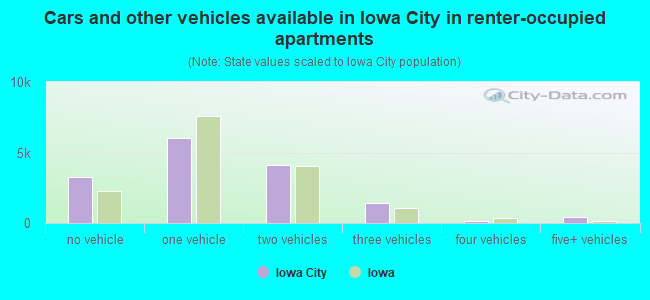
Vehicles available in renter-occupied houses - no vehicle available (%)
Vehicles available in renter-occupied houses - 1 vehicle available (%)
Vehicles available in renter-occupied houses - 2 Vehicles available (%)
Vehicles available in renter-occupied houses - 3 Vehicles available (%)
Vehicles available in renter-occupied houses - 4 Vehicles available (%)
Vehicles available in renter-occupied houses - 5+ Vehicles available (%)
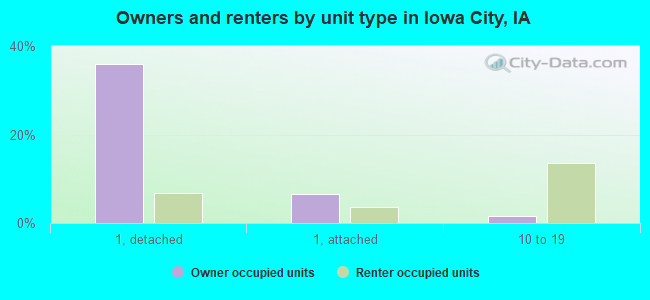
Housing units in structures - 1, detached (%)
Housing units in structures - 1, attached (%)
Housing units in structures - 2 (%)
Housing units in structures - 3 or 4 (%)
Housing units in structures - 5 to 9 (%)
Housing units in structures - 10 to 19 (%)
Housing units in structures - 20 to 49 (%)
Housing units in structures - 50 or more (%)
Housing units in structures - Mobile home (%)
Housing units in structures - Boat, RV, van, etc. (%)
Housing units in structures - Owners - 1, detached (%)
Housing units in structures - Owners - 1, attached (%)
Housing units in structures - Owners - 2 (%)
Housing units in structures - Owners - 3 or 4 (%)
Housing units in structures - Owners - 5 to 9 (%)
Housing units in structures - Owners - 10 to 19 (%)
Housing units in structures - Owners - 20 to 49 (%)
Housing units in structures - Owners - 50 or more (%)
Housing units in structures - Owners - Mobile home (%)
Housing units in structures - Owners - Boat, RV, van, etc. (%)
Housing units in structures - Renters - 1, detached (%)
Housing units in structures - Renters - 1, attached (%)
Housing units in structures - Renters - 2 (%)
Housing units in structures - Renters - 3 or 4 (%)
Housing units in structures - Renters - 5 to 9 (%)
Housing units in structures - Renters - 10 to 19 (%)
Housing units in structures - Renters - 20 to 49 (%)
Housing units in structures - Renters - 50 or more (%)
Housing units in structures - Renters - Mobile home (%)
Housing units in structures - Renters - Boat, RV, van, etc. (%)
House/condo owner moved in on average (years ago)
Renter moved in on average (years ago)
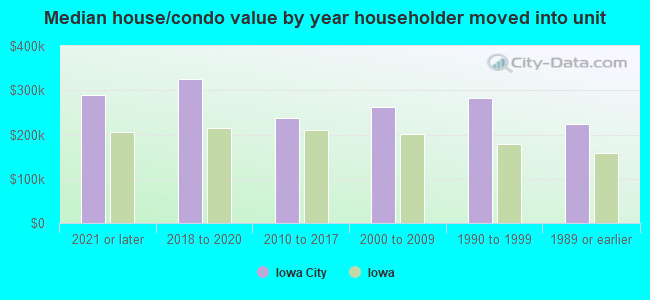
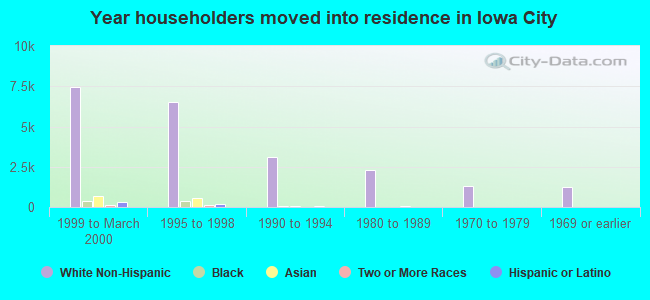
Year householder moved into unit - Moved in 1999 to March 2000 (%)
Year householder moved into unit - Moved in 1999 to March 2000 (%) - White
Year householder moved into unit - Moved in 1999 to March 2000 (%) - Black or African American
Year householder moved into unit - Moved in 1999 to March 2000 (%) - Asian
Year householder moved into unit - Moved in 1999 to March 2000 (%) - Hispanic or Latino
Year householder moved into unit - Moved in 1999 to March 2000 (%) - American Indian and Alaska Native
Year householder moved into unit - Moved in 1999 to March 2000 (%) - Multirace
Year householder moved into unit - Moved in 1999 to March 2000 (%) - Other Race
Year householder moved into unit - Moved in 1995 to 1998 (%)
Year householder moved into unit - Moved in 1995 to 1998 (%) - White
Year householder moved into unit - Moved in 1995 to 1998 (%) - Black or African American
Year householder moved into unit - Moved in 1995 to 1998 (%) - Asian
Year householder moved into unit - Moved in 1995 to 1998 (%) - Hispanic or Latino
Year householder moved into unit - Moved in 1995 to 1998 (%) - American Indian and Alaska Native
Year householder moved into unit - Moved in 1995 to 1998 (%) - Multirace
Year householder moved into unit - Moved in 1995 to 1998 (%) - Other Race
Year householder moved into unit - Moved in 1990 to 1994 (%)
Year householder moved into unit - Moved in 1990 to 1994 (%) - White
Year householder moved into unit - Moved in 1990 to 1994 (%) - Black or African American
Year householder moved into unit - Moved in 1990 to 1994 (%) - Asian
Year householder moved into unit - Moved in 1990 to 1994 (%) - Hispanic or Latino
Year householder moved into unit - Moved in 1990 to 1994 (%) - American Indian and Alaska Native
Year householder moved into unit - Moved in 1990 to 1994 (%) - Multirace
Year householder moved into unit - Moved in 1990 to 1994 (%) - Other Race
Year householder moved into unit - Moved in 1980 to 1989 (%)
Year householder moved into unit - Moved in 1980 to 1989 (%) - White
Year householder moved into unit - Moved in 1980 to 1989 (%) - Black or African American
Year householder moved into unit - Moved in 1980 to 1989 (%) - Asian
Year householder moved into unit - Moved in 1980 to 1989 (%) - Hispanic or Latino
Year householder moved into unit - Moved in 1980 to 1989 (%) - American Indian and Alaska Native
Year householder moved into unit - Moved in 1980 to 1989 (%) - Multirace
Year householder moved into unit - Moved in 1980 to 1989 (%) - Other Race
Year householder moved into unit - Moved in 1970 to 1979 (%)
Year householder moved into unit - Moved in 1970 to 1979 (%) - White
Year householder moved into unit - Moved in 1970 to 1979 (%) - Black or African American
Year householder moved into unit - Moved in 1970 to 1979 (%) - Asian
Year householder moved into unit - Moved in 1970 to 1979 (%) - Hispanic or Latino
Year householder moved into unit - Moved in 1970 to 1979 (%) - American Indian and Alaska Native
Year householder moved into unit - Moved in 1970 to 1979 (%) - Multirace
Year householder moved into unit - Moved in 1970 to 1979 (%) - Other Race
Year householder moved into unit - Moved in 1969 or earlier (%)
Year householder moved into unit - Moved in 1969 or earlier (%) - White
Year householder moved into unit - Moved in 1969 or earlier (%) - Black or African American
Year householder moved into unit - Moved in 1969 or earlier (%) - Asian
Year householder moved into unit - Moved in 1969 or earlier (%) - Hispanic or Latino
Year householder moved into unit - Moved in 1969 or earlier (%) - American Indian and Alaska Native
Year householder moved into unit - Moved in 1969 or earlier (%) - Multirace
Year householder moved into unit - Moved in 1969 or earlier (%) - Other Race
Housing units lacking complete plumbing facilities (%)
Housing units lacking complete kitchen facilities (%)
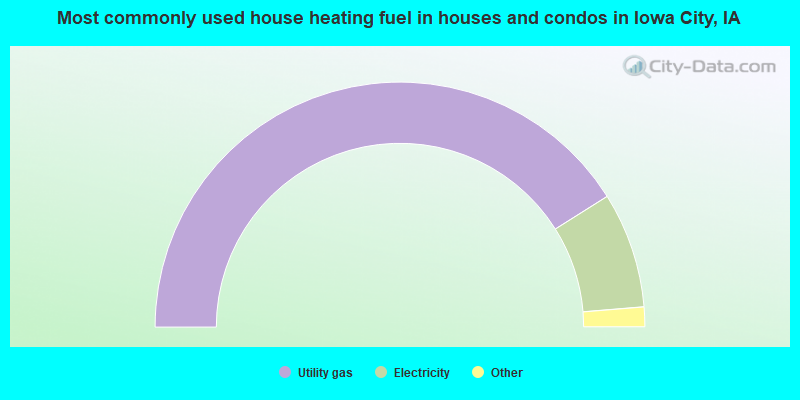
House heating fuel used in houses and condos - Utility gas (%)
House heating fuel used in houses and condos - Bottled, tank, or LP gas (%)
House heating fuel used in houses and condos - Electricity (%)
House heating fuel used in houses and condos - Fuel oil, kerosene, etc. (%)
House heating fuel used in houses and condos - Coal or coke (%)
House heating fuel used in houses and condos - Wood (%)
House heating fuel used in houses and condos - Solar energy (%)
House heating fuel used in houses and condos - Other fuel (%)
House heating fuel used in houses and condos - No fuel used (%)
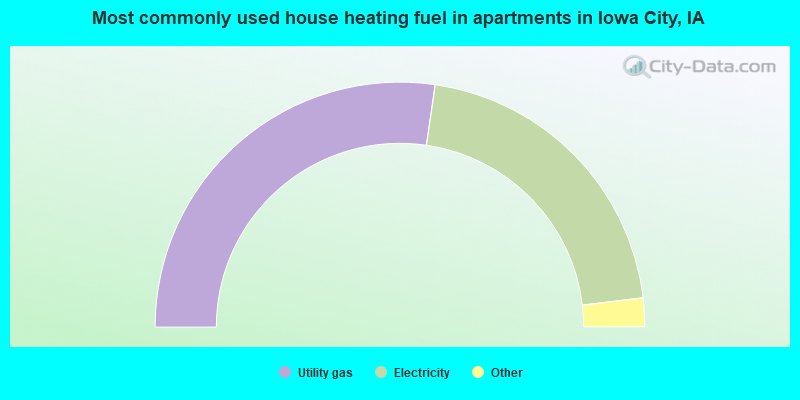
House heating fuel used in apartments - Utility gas (%)
House heating fuel used in apartments - Bottled, tank, or LP gas (%)
House heating fuel used in apartments - Electricity (%)
House heating fuel used in apartments - Fuel oil, kerosene, etc. (%)
House heating fuel used in apartments - Coal or coke (%)
House heating fuel used in apartments - Wood (%)
House heating fuel used in apartments - Solar energy (%)
House heating fuel used in apartments - Other fuel (%)
House heating fuel used in apartments - No fuel used (%)
Median year house/condo built: 1983Median year apartment built: 1986Household type by relationship:
Households: 75,231
Male householders: 14,358 (4,923 living alone ), Female householders: 15,405 (7,169 living alone )8,638 spouses (8,551 opposite-sex spouses ), 2,675 unmarried partners , (2,675 opposite-sex unmarried partners ), 13,020 children (11,985 natural , 605 adopted , 430 stepchildren ), 350 grandchildren , 1,244 brothers or sisters , 390 parents , 0 foster children , 792 other relatives , 11,485 non-relatives In group quarters: 6,874
Size of family households: 5,059 2-persons , 2,475 3-persons , 2,024 4-persons , 769 5-persons , 412 6-persons , 299 7-or-more-persons .
Size of nonfamily households: 12,092 1-person , 4,240 2-persons , 1,382 3-persons , 541 4-persons , 319 5-persons , 151 7-or-more-persons .
7,456 married couples with children. single-parent households (803 men , 2,085 women ).
80.4% of residents of Iowa City speak English at home. of residents speak Spanish at home (65% speak English very well , 16% speak English well , 16% speak English not well , 4% don't speak English at all ).of residents speak other Indo-European language at home (81% speak English very well , 10% speak English well , 8% speak English not well , 2% don't speak English at all ).of residents speak Asian or Pacific Island language at home (66% speak English very well , 24% speak English well , 10% speak English not well ).of residents speak other language at home (63% speak English very well , 21% speak English well , 16% speak English not well ).
Foreign born population: 9,683 (12.9%)of them are naturalized citizens )
Median number of rooms in houses and condos:
Median number of rooms in apartments
Owner-occupied Renter-occupied
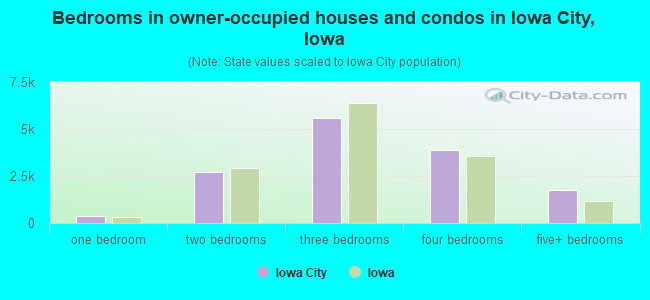
Bedrooms in owner-occupied houses and condos in Iowa City, Iowa
0 no bedroom 366 1 bedroom 2,728 2 bedrooms 5,570 3 bedrooms 3,907 4 bedrooms 1,750 5+ bedrooms
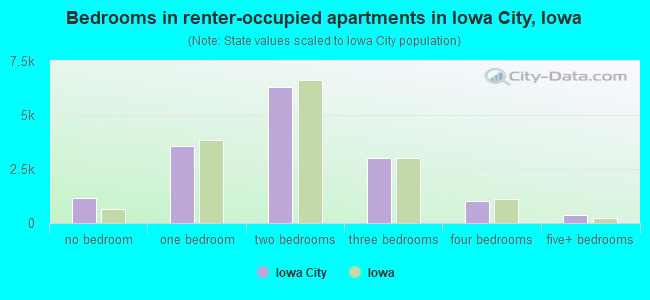
Bedrooms in renter-occupied apartments in Iowa City, Iowa
1,150 no bedroom 3,576 1 bedroom 6,316 2 bedrooms 3,021 3 bedrooms 1,011 4 bedrooms 368 5+ bedrooms
Owner-occupied Renter-occupied
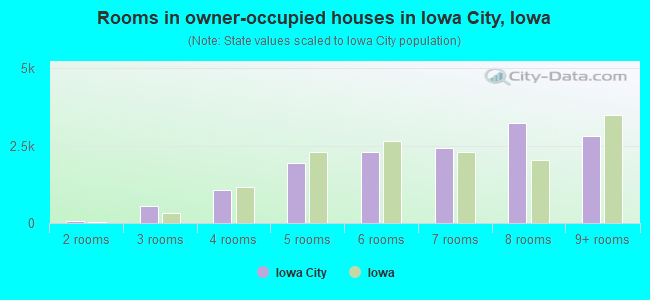
Rooms in owner-occupied houses in Iowa City, Iowa
0 1 room 51 2 rooms 556 3 rooms 1,060 4 rooms 1,937 5 rooms 2,287 6 rooms 2,425 7 rooms 3,213 8 rooms 2,792 9+ rooms
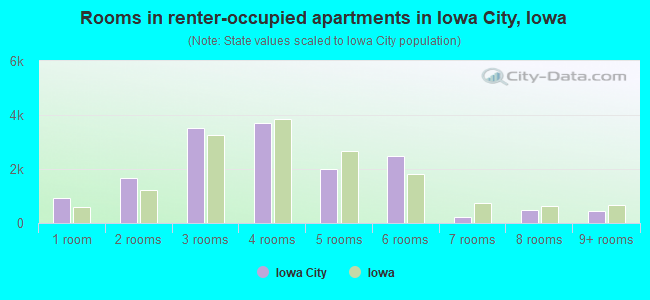
Rooms in renter-occupied apartments in Iowa City, Iowa
920 1 room 1,683 2 rooms 3,502 3 rooms 3,692 4 rooms 1,992 5 rooms 2,500 6 rooms 231 7 rooms 486 8 rooms 436 9+ rooms
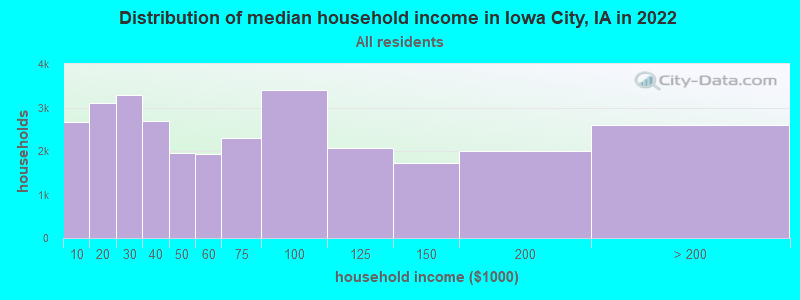
Iowa City, IA household income distribution 2,675 Less than $10,0003,103 $10,000 to $19,9993,281 $20,000 to $29,9992,699 $30,000 to $39,9991,952 $40,000 to $49,9991,929 $50,000 to $59,9992,308 $60,000 to $74,9993,412 $75,000 to $99,9992,076 $100,000 to $124,9991,718 $125,000 to $149,9992,004 $150,000 to $199,9992,606 $200,000 or more
Home value of owner - occupied houses in 2022 in Iowa City, IA 137 Less than $10,00078 $10,000 to $14,99994 $15,000 to $19,999108 $20,000 to $24,99939 $25,000 to $29,99921 $30,000 to $34,99918 $35,000 to $39,999287 $40,000 to $49,999170 $50,000 to $59,99959 $60,000 to $69,99946 $70,000 to $79,99917 $80,000 to $89,99914 $90,000 to $99,999611 $100,000 to $124,999913 $125,000 to $149,999943 $150,000 to $174,9991,252 $175,000 to $199,9992,917 $200,000 to $249,9992,189 $250,000 to $299,9992,471 $300,000 to $399,9991,385 $400,000 to $499,9991,124 $500,000 to $749,999260 $750,000 to $999,99988 $1,000,000 to $1,499,99917 $1,500,000 to $1,999,9995 $2,000,000 or moreRent paid by renters in 2022 in Iowa City, IA 28 $250 to $299276 $350 to $399244 $400 to $449121 $450 to $499552 $500 to $549294 $550 to $599847 $600 to $649680 $650 to $699915 $700 to $7491,987 $750 to $7991,473 $800 to $8991,564 $900 to $9992,218 $1,000 to $1,2492,055 $1,250 to $1,4991,110 $1,500 to $1,999565 $2,000 to $2,49944 $2,500 to $2,99957 $3,000 to $3,499237 $3,500 or more175 No cash rent
Percentage of workers working in this county: 91.2%Number of people working at home: 4,776 (11.8% of all workers )
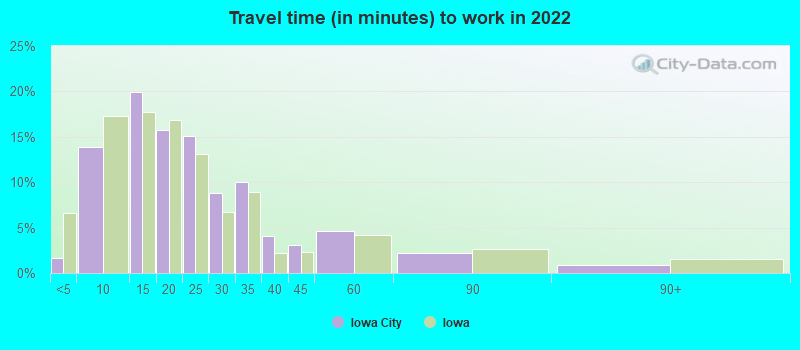
Travel time to work (commute)
Less than 5 minutes: 7635 to 9 minutes: 6,98210 to 14 minutes: 9,59215 to 19 minutes: 6,29020 to 24 minutes: 5,81225 to 29 minutes: 1,64830 to 34 minutes: 2,62635 to 39 minutes: 44740 to 44 minutes: 48245 to 59 minutes: 35560 to 89 minutes: 41290 or more minutes: 267
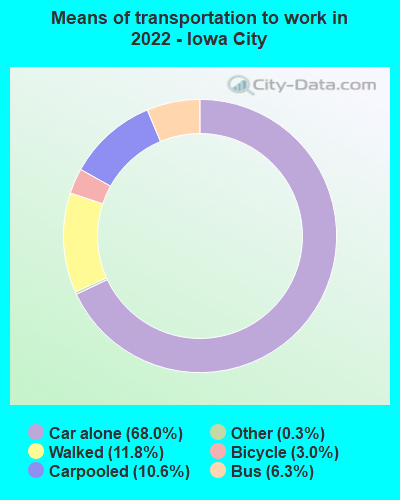
Means of transportation to work:
Drove a car alone: 34,501 (62.2%)Carpooled: 5,393 (9.7%)Bus : 3,186 (5.7%)Taxi: 132 (0.2%)Bicycle: 1,518 (2.7%)Walked: 5,981 (10.8%)Worked at home: 4,776 (8.6%)
Unemployment by race in 2022
Unemployment rate for White non-Hispanic residents 3.2% Males3.4% FemalesUnemployment rate for Black residents 7.2% Males5.9% FemalesUnemployment rate for Asian residents 2.7% Males8.2% FemalesUnemployment rate for other race residents 1.6% Males4.9% FemalesUnemployment rate for two or more race residents 2.2% Males5.5% FemalesUnemployment rate for Hispanic or Latino residents 5.3% Males3.5% Females
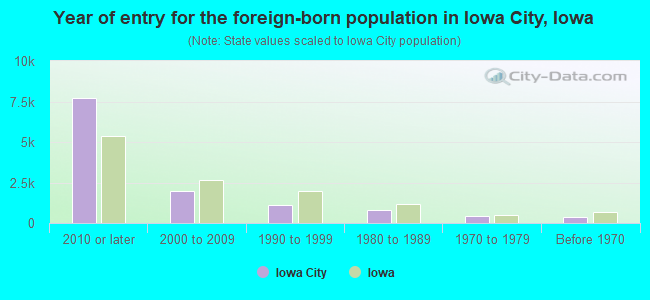
Year of entry for the foreign-born population in Iowa City, Iowa
7,730 2010 or later 1,980 2000 to 2009 1,089 1990 to 1999 798 1980 to 1989 424 1970 to 1979 369 Before 1970
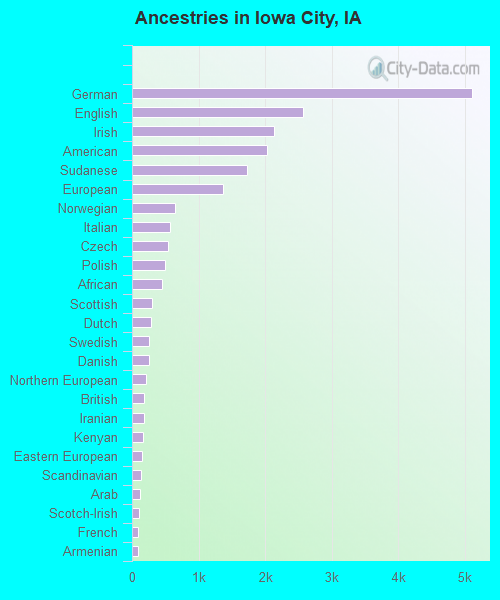
First ancestries reported:
German: 5,107 (14.6%)
English: 2,568 (7.4%)
Irish: 2,127 (6.1%)
American: 2,033 (5.8%)
Sudanese: 1,728 (4.9%)
European: 1,367 (3.9%)
Norwegian: 653 (1.9%)
Italian: 577 (1.7%)
Czech: 535 (1.5%)
Polish: 501 (1.4%)
African: 446 (1.3%)
Scottish: 302 (0.9%)
Dutch: 289 (0.8%)
Swedish: 255 (0.7%)
Danish: 253 (0.7%)
Northern European: 207 (0.6%)
British: 182 (0.5%)
Iranian: 179 (0.5%)
Kenyan: 166 (0.5%)
Eastern European: 146 (0.4%)
Scandinavian: 133 (0.4%)
Arab: 117 (0.3%)
Scotch-Irish: 100 (0.3%)
French: 96 (0.3%)
Armenian: 86 (0.2%)
Turkish: 84 (0.2%)
Russian: 79 (0.2%)
Yugoslavian: 74 (0.2%)
Moroccan: 70 (0.2%)
Lebanese: 66 (0.2%)
Swiss: 65 (0.2%)
Canadian: 62 (0.2%)
French Canadian: 61 (0.2%)
Nigerian: 59 (0.2%)
Iraqi: 53 (0.2%)
Greek: 48 (0.1%)
Jamaican: 39 (0.1%)
Syrian: 39 (0.1%)
Lithuanian: 37 (0.1%)
Palestinian: 37 (0.1%)
Austrian: 36 (0.1%)
Celtic: 34 (0.10%)
Welsh: 33 (0.09%)
Czechoslovakian: 32 (0.09%)
Brazilian: 31 (0.09%)
Croatian: 29 (0.08%)
Hungarian: 24 (0.07%)
Jordanian: 22 (0.06%)
Ukrainian: 21 (0.06%)
Serbian: 18 (0.05%)
Belgian: 18 (0.05%)
Portuguese: 15 (0.04%)
Assyrian: 14 (0.04%)
Slovak: 13 (0.04%)
Finnish: 13 (0.04%)
Ghanaian: 13 (0.04%)
Egyptian: 11 (0.03%)
Israeli: 10 (0.03%)
Australian: 10 (0.03%)
Romanian: 10 (0.03%)
Luxembourger: 9 (0.03%)
Albanian: 8 (0.02%)
Slavic: 6 (0.02%)
South African: 6 (0.02%)
Pennsylvania German: 2 (0.01%)
Most common places of birth for foreign-born residents (%): China, excluding Hong Kong and Taiwan Iowa City:
12.6% (1,326)Iowa:
4.6% (8,194)
Sudan Iowa City:
12.4% (1,301)Iowa:
2.3% (4,084)
India Iowa City:
7.6% (802)Iowa:
6.2% (11,148)
Vietnam Iowa City:
7.1% (743)Iowa:
4.2% (7,428)
Korea Iowa City:
6.4% (673)Iowa:
2.9% (5,155)
Democratic Republic of Congo (Zaire) Iowa City:
4.7% (493)Iowa:
2.1% (3,735)
Mexico Iowa City:
4.2% (440)Iowa:
23.3% (41,625)
Honduras Iowa City:
3.1% (327)Iowa:
1.0% (1,803)
El Salvador Iowa City:
1.9% (197)Iowa:
2.8% (4,967)
Kenya Iowa City:
1.8% (190)Iowa:
0.7% (1,188)
South Africa Iowa City:
1.7% (179)Iowa:
0.4% (719)
Bangladesh Iowa City:
1.6% (170)Iowa:
0.4% (768)
Algeria Iowa City:
1.6% (169)Iowa:
0.1% (234)
Place of birth for U.S.-born residents:
This state: 36,653Other state: 27,873Northeast: 3,506Midwest: 16,355South: 4,249West: 3,763 69.9% of Iowa City residents lived in the same house 1 years ago.
Out of people who lived in different houses, 34.3% lived in this county.
Out of people who lived in different counties, 48.4% lived in Iowa.
Iowa City:
69.9%State average:
87.2%
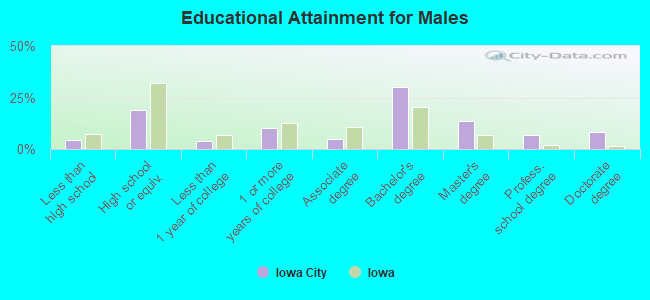
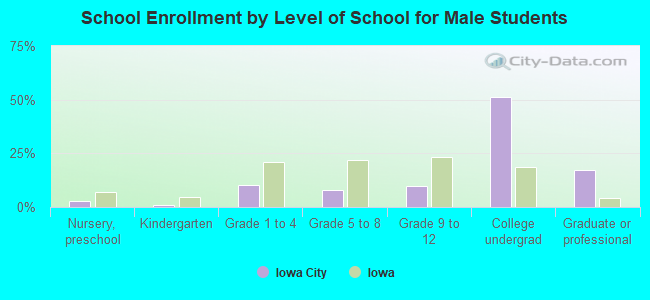
Education attainment for males 25 years and older:
No schooling: 98Nursery to 4th grade: 125th and 6th grade: 1047th and 8th grade: 1409th grade: 010th grade: 21211th grade: 3612th grade, no diploma: 230High school graduate (or equivalency): 3,649Less than 1 year of college: 709Some college more than 1 year, no degree: 1,938Associate degree: 896Bachelor's degree: 5,788Master's degree: 2,596Professional school degree: 1,293Doctorate degree: 1,561
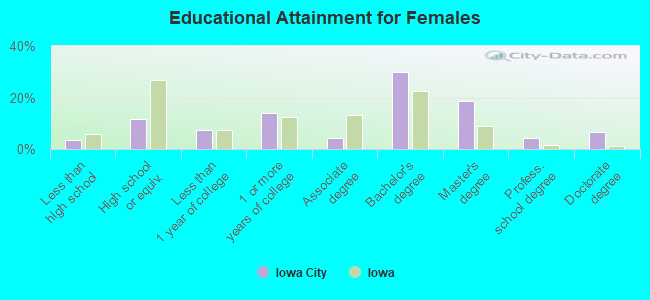
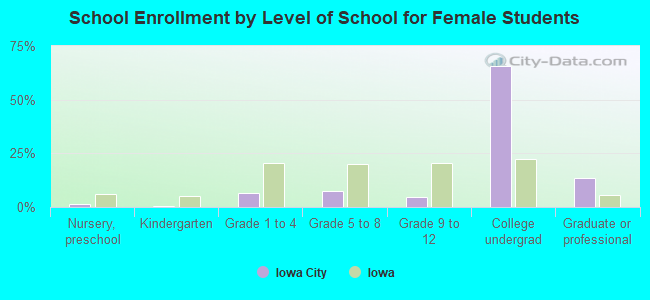
Education attainment for females 25 years and older:
No schooling: 192Nursery to 4th grade: 05th and 6th grade: 1197th and 8th grade: 09th grade: 010th grade: 16811th grade: 2712th grade, no diploma: 229High school graduate (or equivalency): 2,309Less than 1 year of college: 1,511Some college more than 1 year, no degree: 2,792Associate degree: 866Bachelor's degree: 5,996Master's degree: 3,735Professional school degree: 892Doctorate degree: 1,290
Housing units in structures:
One, detached: 12,967One, attached: 3,593Two: 6273 or 4: 1,4595 to 9: 3,81410 to 19: 3,45620 to 49: 3,96950 or more: 2,961Mobile homes: 600Median worth of mobile homes: $33,949
Housing units lacking complete plumbing facilities in 2022: 0.4%Housing units lacking complete kitchen facilities in 2022: 0.6%House/condo owner moved in on average 8 years ago
Renter moved in on average 0 years ago
Private vs. public school enrollment:
Students in private schools in grades 1 to 8 (elementary and middle school): 944 Students in private schools in grades 9 to 12 (high school): 756 Students in private undergraduate colleges: 1,459