Jollyville, TX (Texas) Houses and Residents
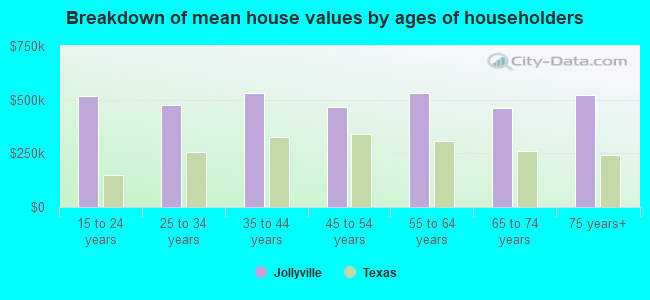
| Jollyville: | $515,810 |
| Texas: | $275,400 |
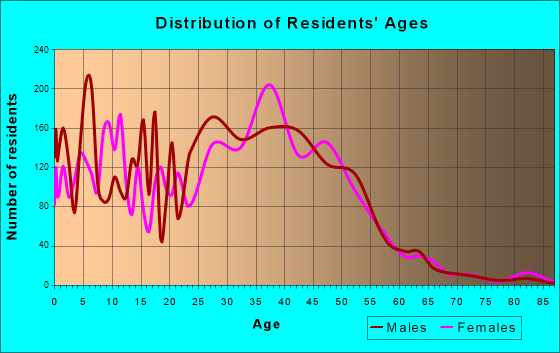
Total population: 16,151 (Urban population: 15,466, Rural population: 0)
Houses: 8,326 (8,148 occupied: 4,783 owner occupied, 3,561 renter occupied)
| % of renters here: | 43% |
| State: | 38% |
Housing density: 1,412 houses/condos per square mile
Median price asked for vacant for-sale houses and condos in 2022 in this county: $504,780.
Median contract rent in 2022: $1,660 (lower quartile is $1,452, upper quartile is over $2,000)
Median rent asked for vacant for-rent units in 2022: $954
Median gross rent in Jollyville, TX in 2022: $1,821
Housing units in Jollyville with a mortgage: 2,851 (78 second mortgage, 127 home equity loan, 0 both second mortgage and home equity loan)
Houses without a mortgage: 1,183
Median household income for houses/condos with a mortgage: $126,508
Median household income for apartments without a mortgage: $108,291
Median monthly housing costs: $1,629
Compare current foreclosures near Jollyville, TX:
| Photo | Address | Area | Beds / Baths | Price | Details |
|---|---|---|---|---|---|

|
#1
N Redondo Dr
Austin, TX 78721
|
972 sq. feet
|
1 baths 3 beds |
$339,900
|
show details |

|
#2
Revolutionary Trl
Manor, TX 78653
|
2,835 sq. feet
|
2 baths 4 beds |
show details | |

|
#3
Buttercup Creek Blvd Unit 602
Cedar Park, TX 78613
|
1,336 sq. feet
|
2 baths 3 beds |
show details | |

|
#4
Andrew Jackson St
Manor, TX 78653
|
1,920 sq. feet
|
2 baths 4 beds |
show details | |

|
#5
Shiraz Loop
Round Rock, TX 78665
|
2,820 sq. feet
|
3 baths 4 beds |
show details | |

|
#6
Rosano St
Round Rock, TX 78665
|
2,846 sq. feet
|
4 baths 4 beds |
show details | |

|
#7
S West Dr
Leander, TX 78641
|
1,163 sq. feet
|
2 baths 3 beds |
show details | |

|
#8
Malaga Hills Dr
Round Rock, TX 78681
|
2,686 sq. feet
|
3 baths 4 beds |
show details | |

|
#9
Rambollet Ter
Round Rock, TX 78681
|
2,274 sq. feet
|
3 baths 4 beds |
show details | |

|
#10
Exposition Blvd
Austin, TX 78703
|
2,156 sq. feet
|
2 baths 3 beds |
show details |
| Photo | Address | Area | Beds / Baths | Price | Details |
|---|---|---|---|---|---|

|
#11
Tolcarne Dr
Hutto, TX 78634
|
1,626 sq. feet
|
2 baths 4 beds |
show details | |

|
#12
Strata Rd
Manor, TX 78653
|
1,735 sq. feet
|
2 baths 4 beds |
show details | |

|
#13
Liberton Ln
Austin, TX 78754
|
- sq. feet
|
2 baths 3 beds |
show details | |

|
#14
Stevenage Dr
Pflugerville, TX 78660
|
2,800 sq. feet
|
2 baths 4 beds |
show details | |

|
#15
Raintree Path
Round Rock, TX 78664
|
2,052 sq. feet
|
2 baths 4 beds |
show details | |

|
#16
Hilltop Dr
Leander, TX 78641
|
1,274 sq. feet
|
2 baths 3 beds |
show details | |

|
#17
Alamar Walk
Leander, TX 78641
|
1,927 sq. feet
|
2 baths 4 beds |
show details | |

|
#18
Dove Haven Dr
Pflugerville, TX 78660
|
1,346 sq. feet
|
2 baths 3 beds |
show details | |

|
#19
Pablo Way
Round Rock, TX 78665
|
2,761 sq. feet
|
3 baths 4 beds |
show details | |

|
#20
Ritter Dr
Cedar Park, TX 78613
|
2,712 sq. feet
|
2 baths 3 beds |
show details |
| Photo | Address | Area | Beds / Baths | Price | Details |
|---|---|---|---|---|---|

|
#21
White Sands Dr
Austin, TX 78734
|
2,256 sq. feet
|
2 baths 4 beds |
show details | |

|
#22
Syrah Court
Leander, TX 78641
|
1,985 sq. feet
|
2 baths 4 beds |
show details | |

|
#23
Musselman Ct
Hutto, TX 78634
|
1,232 sq. feet
|
2 baths - beds |
show details | |

|
#24
Brownsboro Ct
Manor, TX 78653
|
1,611 sq. feet
|
2 baths - beds |
show details | |

|
#25
Jennifer Ln
Round Rock, TX 78665
|
1,860 sq. feet
|
2 baths - beds |
show details | |

|
#26
Quail Cir
Hutto, TX 78634
|
1,336 sq. feet
|
2 baths - beds |
show details | |

|
#27
Payton Falls Dr
Austin, TX 78754
|
2,828 sq. feet
|
2 baths - beds |
show details | |

|
#28
Copperhead Dr
Round Rock, TX 78664
|
1,929 sq. feet
|
2 baths - beds |
show details | |

|
#29
Rolling Green Dr
Austin, TX 78734
|
2,289 sq. feet
|
3 baths 4 beds |
show details | |

|
#30
Nicole Cv
Round Rock, TX 78664
|
2,284 sq. feet
|
2 baths - beds |
show details |
| Photo | Address | Area | Beds / Baths | Price | Details |
|---|---|---|---|---|---|

|
#31
Howerington Cir
Austin, TX 78724
|
870 sq. feet
|
1 baths - beds |
show details | |

|
#32
Marysol Trl
Cedar Park, TX 78613
|
3,297 sq. feet
|
2 baths - beds |
show details | |

|
#33
Speidel Dr
Pflugerville, TX 78660
|
3,381 sq. feet
|
3 baths - beds |
show details | |

|
#34
Wiseman Dr
Pflugerville, TX 78660
|
1,722 sq. feet
|
2 baths - beds |
show details | |

|
#35
Little Walnut Dr
Austin, TX 78753
|
2,050 sq. feet
|
2 baths - beds |
show details | |

|
#36
Wallin St
Hutto, TX 78634
|
1,345 sq. feet
|
2 baths - beds |
show details | |

|
#37
Stephanie Lee Ln
Austin, TX 78753
|
1,748 sq. feet
|
2 baths - beds |
show details | |

|
#38
Connemara Ln
Pflugerville, TX 78660
|
1,812 sq. feet
|
2 baths - beds |
show details | |

|
#39
Tuffit Ln
Austin, TX 78753
|
884 sq. feet
|
1 baths - beds |
show details | |

|
#40
On The Lake Rd
Austin, TX 78732
|
2,298 sq. feet
|
3 baths - beds |
show details |
| Photo | Address | Area | Beds / Baths | Price | Details |
|---|---|---|---|---|---|

|
#41
E Mesa Park Dr
Round Rock, TX 78664
|
2,052 sq. feet
|
2 baths - beds |
show details | |

|
#42
E Mesa Park Cv
Round Rock, TX 78664
|
2,229 sq. feet
|
2 baths - beds |
show details | |

|
#43
Romeo Dr
Cedar Park, TX 78613
|
2,518 sq. feet
|
2 baths - beds |
show details | |

|
#44
Nameless Rd
Leander, TX 78641
|
1,344 sq. feet
|
1 baths - beds |
show details | |

|
#45
Glen Field Dr
Cedar Park, TX 78613
|
2,593 sq. feet
|
2 baths - beds |
show details | |

|
#46
Gatehouse Dr
Austin, TX 78753
|
1,056 sq. feet
|
2 baths - beds |
show details | |

|
#47
Cottontail Ln
Georgetown, TX 78626
|
811 sq. feet
|
1 baths - beds |
show details | |

|
#48
Green Lodge Ct
Manor, TX 78653
|
2,764 sq. feet
|
3 baths - beds |
show details | |

|
#49
Minerva St
Austin, TX 78753
|
3,302 sq. feet
|
2 baths - beds |
show details | |

|
Check over 1 million property listings on Foreclosure.com!
|
browse all offers | |||
Latest news about housing in Jollyville, TX collected exclusively by city-data.com from local newspapers, TV, and radio stations


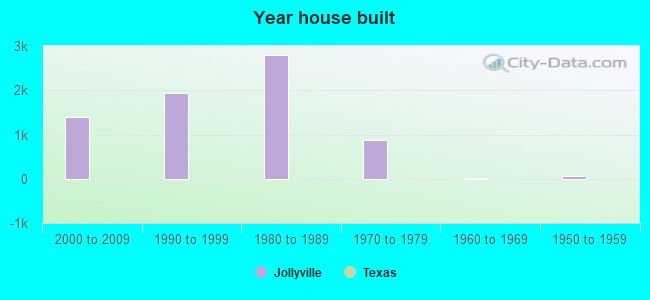
Median year apartment built: 1998
Household type by relationship:
Households: 19,057- In family households: 15,262 (2,732 male householders, 2,041 female householders)
3,485 spouses, 5,923 children (5,669 natural, 57 adopted, 196 stepchildren), 116 grandchildren, 139 brothers or sisters, 318 parents, 0 foster children, 256 other relatives, 247 non-relatives
- In nonfamily households: 3,787 (1,253 male householders (1,110 living alone)), 1,738 female householders (1,266 living alone)), 795 nonrelatives
- In group quarters: 7
Size of family households: 2,254 2-persons, 1,071 3-persons, 964 4-persons, 407 5-persons, 192 6-persons, 85 7-or-more-persons.
Size of nonfamily households: 2,698 1-person, 719 2-persons, 65 3-persons.
3,193 married couples with children.
960 single-parent households (182 men, 778 women).
75.0% of residents of Jollyville speak English at home.
10.9% of residents speak Spanish at home (72% speak English very well, 14% speak English well, 13% speak English not well, 1% don't speak English at all).
5.1% of residents speak other Indo-European language at home (89% speak English very well, 8% speak English well, 4% don't speak English at all).
8.3% of residents speak Asian or Pacific Island language at home (53% speak English very well, 32% speak English well, 14% speak English not well, 1% don't speak English at all).
0.3% of residents speak other language at home (100% speak English very well).
Foreign born population: 3,247 (17.8%)
(49.8% of them are naturalized citizens)
| Here: | 6.6 |
| State: | 6.3 |
| Here: | 4.1 |
| State: | 4.0 |
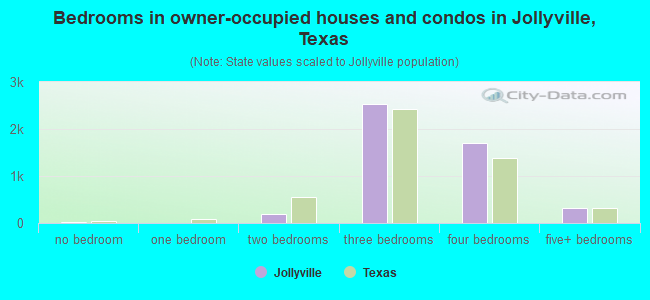
- Bedrooms in owner-occupied houses and condos in Jollyville, Texas
- 20no bedroom
- 01 bedroom
- 1952 bedrooms
- 2,5303 bedrooms
- 1,7114 bedrooms
- 3285+ bedrooms
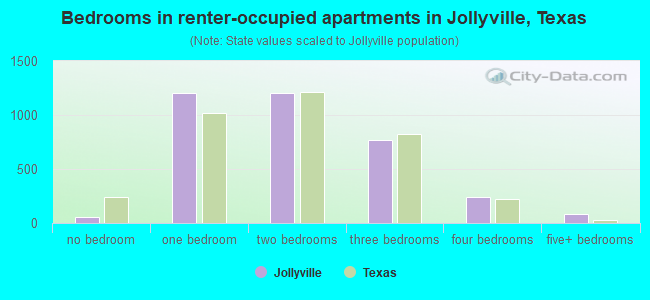
- Bedrooms in renter-occupied apartments in Jollyville, Texas
- 56no bedroom
- 1,2081 bedroom
- 1,2062 bedrooms
- 7723 bedrooms
- 2384 bedrooms
- 825+ bedrooms
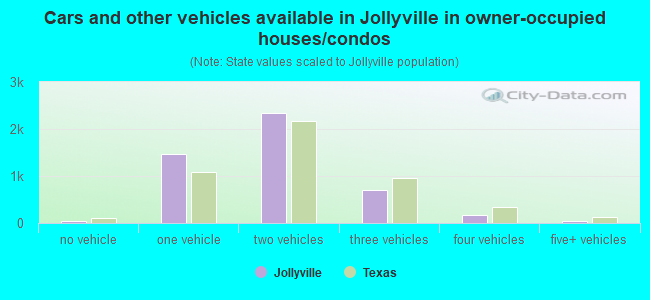
- Cars and other vehicles available in Jollyville in owner-occupied houses/condos
- 40no vehicle
- 1,4681 vehicle
- 2,3412 vehicles
- 7103 vehicles
- 1794 vehicles
- 455+ vehicles
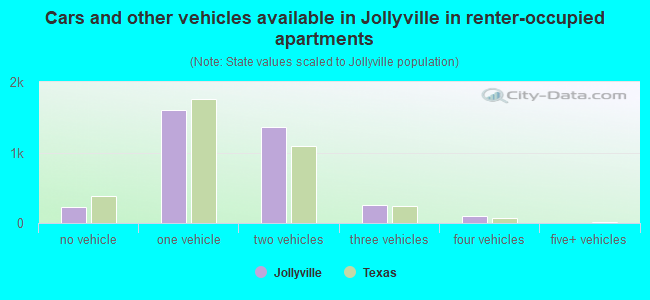
- Cars and other vehicles available in Jollyville in renter-occupied apartments
- 232no vehicle
- 1,6001 vehicle
- 1,3662 vehicles
- 2623 vehicles
- 1024 vehicles
- 05+ vehicles
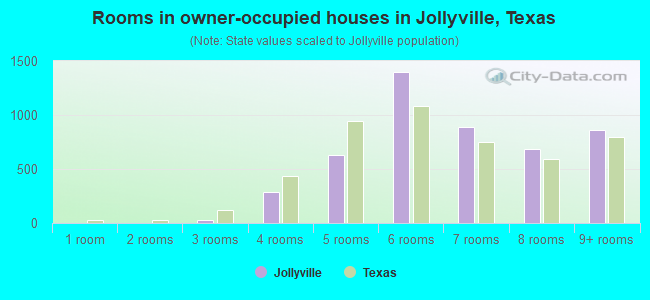
- Rooms in owner-occupied houses in Jollyville, Texas
- 01 room
- 02 rooms
- 323 rooms
- 2854 rooms
- 6305 rooms
- 1,3966 rooms
- 8937 rooms
- 6848 rooms
- 8639+ rooms
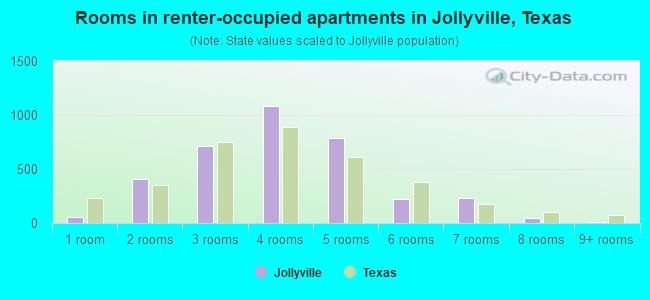
- Rooms in renter-occupied apartments in Jollyville, Texas
- 561 room
- 4072 rooms
- 7103 rooms
- 1,0854 rooms
- 7895 rooms
- 2246 rooms
- 2287 rooms
- 498 rooms
- 139+ rooms
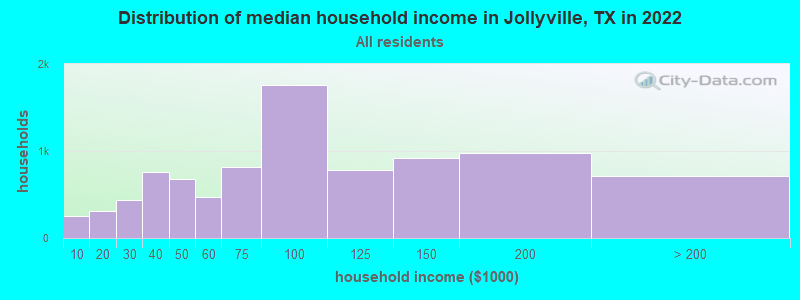
Jollyville, TX household income distribution

- 258Less than $10,000
- 307$10,000 to $19,999
- 437$20,000 to $29,999
- 762$30,000 to $39,999
- 676$40,000 to $49,999
- 468$50,000 to $59,999
- 819$60,000 to $74,999
- 1,759$75,000 to $99,999
- 778$100,000 to $124,999
- 918$125,000 to $149,999
- 981$150,000 to $199,999
- 707$200,000 or more
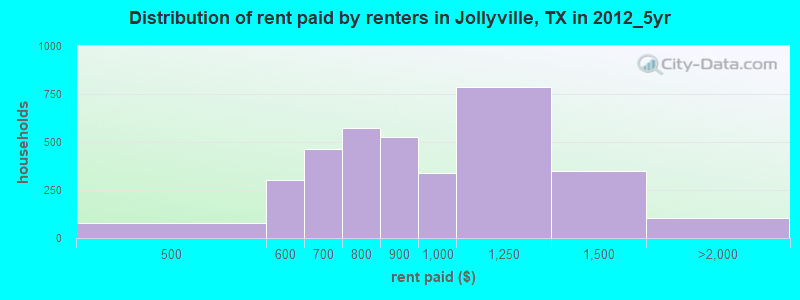
Rent paid by renters in 2012_5yr in Jollyville, TX
-
- 79$450 to $499
- 120$500 to $549
- 183$550 to $599
- 186$600 to $649
- 279$650 to $699
- 248$700 to $749
- 325$750 to $799
- 527$800 to $899
- 339$900 to $999
- 787$1,000 to $1,249
- 350$1,250 to $1,499
- 105$1,500 to $1,999
- 0No cash rent
Percentage of workers working in this county: 31.4%
Number of people working at home: 1,375 (11.3% of all workers)
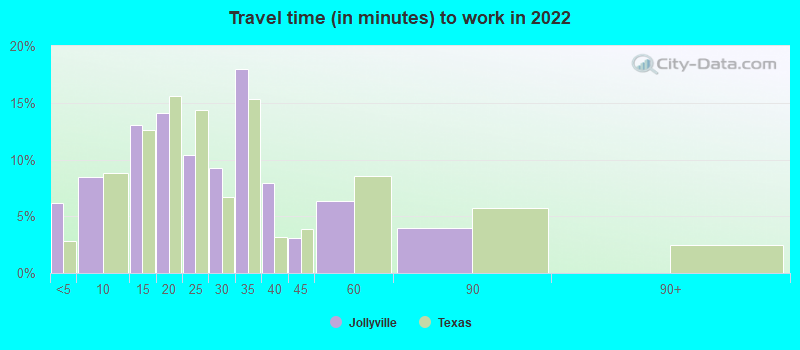
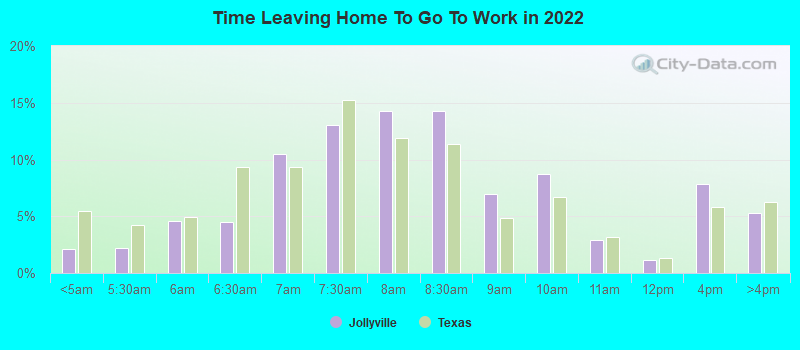
Travel time to work (commute)
- Less than 5 minutes: 365
- 5 to 9 minutes: 727
- 10 to 14 minutes: 937
- 15 to 19 minutes: 2,124
- 20 to 24 minutes: 1,930
- 25 to 29 minutes: 1,001
- 30 to 34 minutes: 1,455
- 35 to 39 minutes: 512
- 40 to 44 minutes: 403
- 45 to 59 minutes: 800
- 60 to 89 minutes: 348
- 90 or more minutes: 90
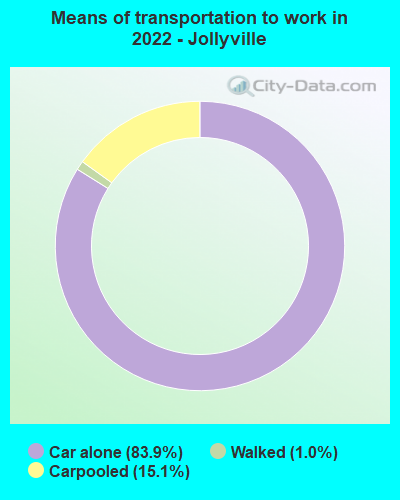
Means of transportation to work:
- Drove a car alone: 1,241 (60.0%)
- Carpooled: 185 (8.9%)
- Walked: 13 (0.6%)
- Worked at home: 1,325 (64.0%)
- Unemployment by race in 2022
- Unemployment rate for White non-Hispanic residents
- 2.6%Males
- 2.8%Females
- Unemployment rate for Black residents
- 8.0%Males
- 3.4%Females
- Unemployment rate for Asian residents
- 20.1%Males
- 6.1%Females
- Unemployment rate for Hispanic or Latino residents
- 3.7%Males
- 0.9%Females
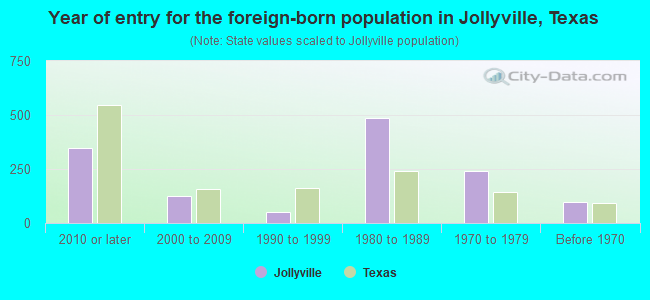
- Year of entry for the foreign-born population in Jollyville, Texas
- 3472010 or later
- 1252000 to 2009
- 511990 to 1999
- 4881980 to 1989
- 2391970 to 1979
- 98Before 1970
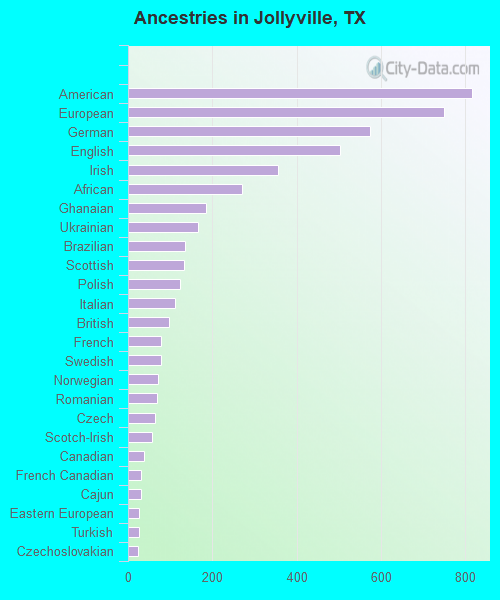
First ancestries reported:
- American: 816 (8.2%)
- European: 750 (7.5%)
- German: 574 (5.8%)
- English: 503 (5.1%)
- Irish: 355 (3.6%)
- African: 270 (2.7%)
- Ghanaian: 184 (1.9%)
- Ukrainian: 165 (1.7%)
- Brazilian: 135 (1.4%)
- Scottish: 132 (1.3%)
- Polish: 123 (1.2%)
- Italian: 112 (1.1%)
- British: 97 (1.0%)
- French: 79 (0.8%)
- Swedish: 78 (0.8%)
- Norwegian: 72 (0.7%)
- Romanian: 70 (0.7%)
- Czech: 64 (0.6%)
- Scotch-Irish: 58 (0.6%)
- Canadian: 39 (0.4%)
- French Canadian: 32 (0.3%)
- Cajun: 30 (0.3%)
- Eastern European: 27 (0.3%)
- Turkish: 27 (0.3%)
- Czechoslovakian: 24 (0.2%)
- Greek: 19 (0.2%)
- Finnish: 18 (0.2%)
- Portuguese: 18 (0.2%)
- Basque: 16 (0.2%)
- Dutch: 15 (0.2%)
- Swiss: 12 (0.1%)
Most common places of birth for foreign-born residents (%):
| Jollyville: | 16.1% (464) |
| Texas: | 100.0% (-1) |
| Jollyville: | 12.8% (368) |
| Texas: | 100.0% (-1) |
| Jollyville: | 9.4% (272) |
| Texas: | 100.0% (-1) |
| Jollyville: | 8.1% (233) |
| Texas: | 100.0% (-1) |
| Jollyville: | 4.8% (138) |
| Texas: | 100.0% (-1) |
| Jollyville: | 4.6% (132) |
| Texas: | 100.0% (-1) |
| Jollyville: | 4.4% (128) |
| Texas: | 100.0% (-1) |
| Jollyville: | 3.9% (112) |
| Texas: | 100.0% (-1) |
| Jollyville: | 3.3% (96) |
| Texas: | 100.0% (-1) |
| Jollyville: | 2.7% (79) |
| Texas: | 100.0% (-1) |
| Jollyville: | 2.6% (76) |
| Texas: | 100.0% (-1) |
| Jollyville: | 2.6% (75) |
| Texas: | 100.0% (-1) |
| Jollyville: | 2.0% (59) |
| Texas: | 100.0% (-1) |
| Jollyville: | 2.0% (57) |
| Texas: | 100.0% (-1) |
| Jollyville: | 1.9% (56) |
| Texas: | 100.0% (-1) |
| Jollyville: | 1.9% (55) |
| Texas: | 100.0% (-1) |
| Jollyville: | 1.7% (50) |
| Texas: | 100.0% (-1) |
| Jollyville: | 1.7% (48) |
| Texas: | 100.0% (-1) |
| Jollyville: | 1.6% (45) |
| Texas: | 100.0% (-1) |
Place of birth for U.S.-born residents:
- This state: 8,561
- Other state: 6,275
- Northeast: 675
- Midwest: 1,760
- South: 1,791
- West: 2,084
82.1% of Jollyville residents lived in the same house 1 years ago.
Out of people who lived in different houses, 23.3% lived in this county.
Out of people who lived in different counties, 73.9% lived in Texas.
| Jollyville: | 82.1% |
| State average: | 85.7% |
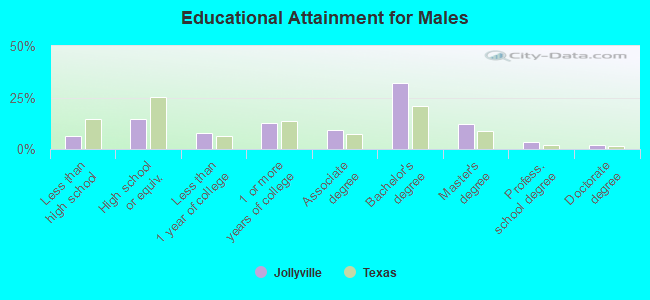
Education attainment for males 25 years and older:
- No schooling: 83
- Nursery to 4th grade: 0
- 5th and 6th grade: 19
- 7th and 8th grade: 107
- 9th grade: 41
- 10th grade: 65
- 11th grade: 4
- 12th grade, no diploma: 113
- High school graduate (or equivalency): 1,049
- Less than 1 year of college: 553
- Some college more than 1 year, no degree: 906
- Associate degree: 650
- Bachelor's degree: 2,284
- Master's degree: 862
- Professional school degree: 227
- Doctorate degree: 129
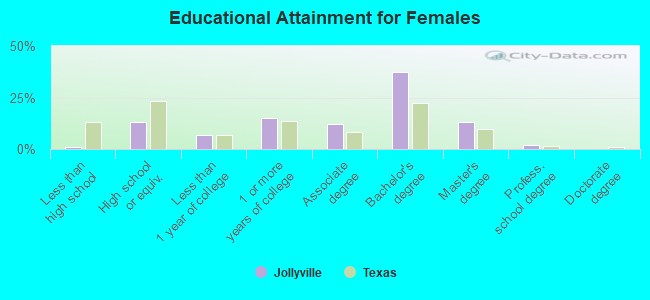
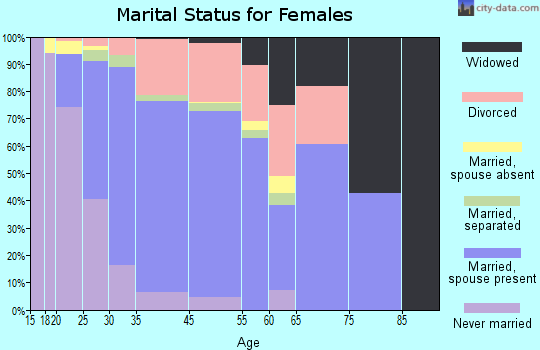
Education attainment for females 25 years and older:
- No schooling: 0
- Nursery to 4th grade: 0
- 5th and 6th grade: 15
- 7th and 8th grade: 0
- 9th grade: 13
- 10th grade: 23
- 11th grade: 8
- 12th grade, no diploma: 0
- High school graduate (or equivalency): 1,029
- Less than 1 year of college: 521
- Some college more than 1 year, no degree: 1,181
- Associate degree: 963
- Bachelor's degree: 2,958
- Master's degree: 1,048
- Professional school degree: 161
- Doctorate degree: 16
Housing units in structures:
- One, detached: 5,107
- One, attached: 338
- Two: 492
- 3 or 4: 217
- 5 to 9: 314
- 10 to 19: 970
- 20 to 49: 590
- 50 or more: 244
- Mobile homes: 20
Median worth of mobile homes: $35,401
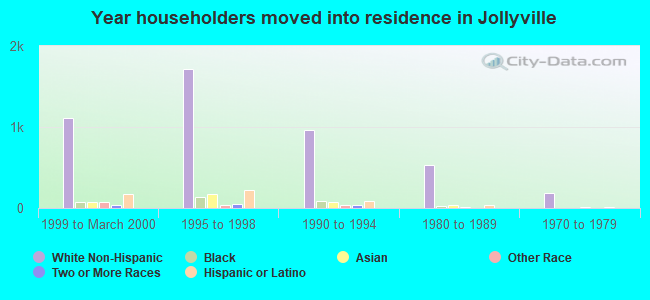
House/condo owner moved in on average 14 years ago
Renter moved in on average 1 years ago
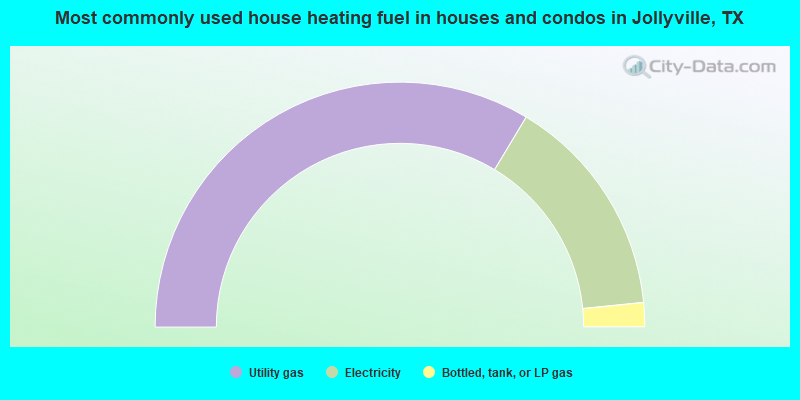
- 67.3%Utility gas
- 29.6%Electricity
- 3.2%Bottled, tank, or LP gas
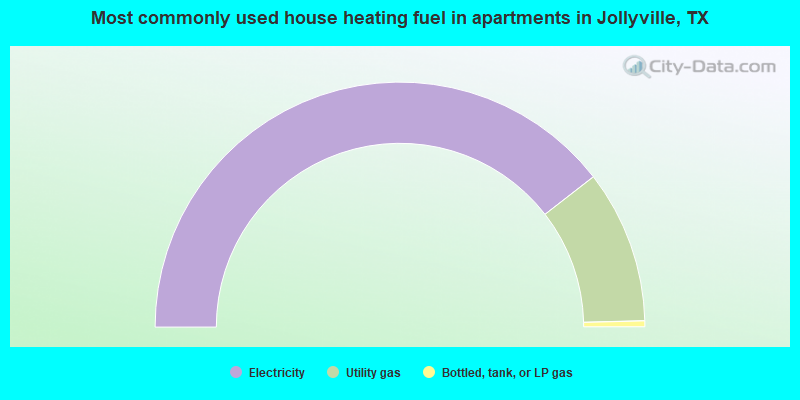
- 79.0%Electricity
- 20.2%Utility gas
- 0.8%Bottled, tank, or LP gas
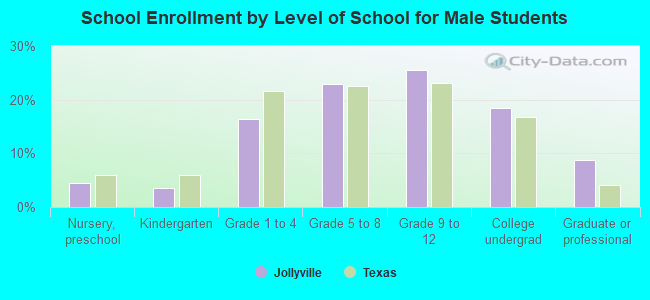
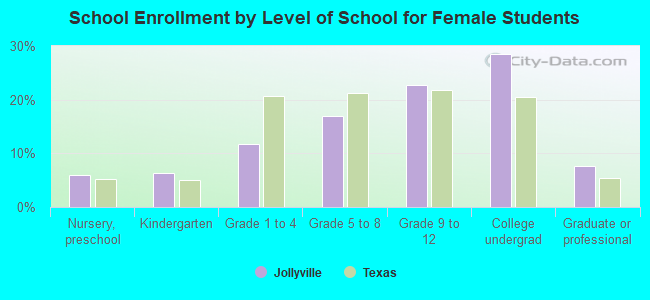
Private vs. public school enrollment:
| Here: | 16.4% |
| Texas: | 8.8% |
| Here: | 5.4% |
| Texas: | 8.0% |
| Here: | 11.4% |
| Texas: | 16.2% |