Kannapolis, NC (North Carolina) Houses and Residents
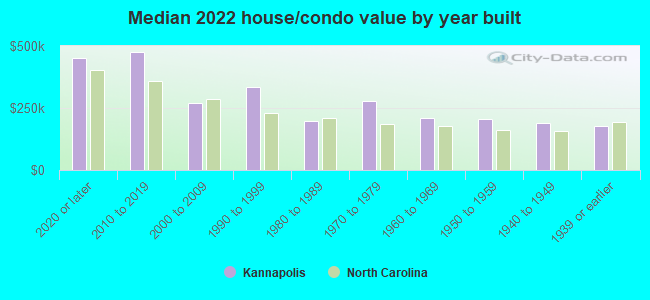
| Kannapolis: | $268,594 |
| North Carolina: | $280,600 |
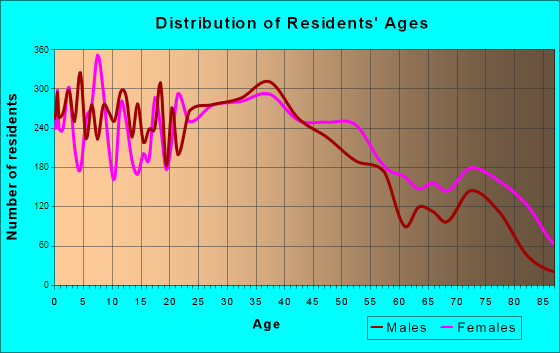
Total population: 45,245 (Urban population: 35,228, Rural population: 1,471 (all nonfarm))
Houses: 23,257 (20,051 occupied: 13,490 owner occupied, 8,087 renter occupied)
| % of renters here: | 37% |
| State: | 33% |
Housing density: 779 houses/condos per square mile
Median price asked for vacant for-sale houses and condos in 2022: $172,143.
Median contract rent in 2022: $918 (lower quartile is $738, upper quartile is $1,274)
Median rent asked for vacant for-rent units in 2022: $606
Median gross rent in Kannapolis, NC in 2022: $1,136
Housing units in Kannapolis with a mortgage: 8,843 (831 second mortgage, 134 home equity loan, 593 both second mortgage and home equity loan)
Houses without a mortgage: 65
Median household income for houses/condos with a mortgage: $95,314
Median household income for apartments without a mortgage: $48,287
Median monthly housing costs: $1,094
Compare current foreclosures in Kannapolis, NC:
| Photo | Address | Area | Beds / Baths | Price | Details |
|---|---|---|---|---|---|

|
#1
Saguaro Ln
Kannapolis, NC 28083
|
2,274 sq. feet
|
2 baths 4 beds |
show details | |

|
#2
Center St
Kannapolis, NC 28083
|
1,176 sq. feet
|
1 baths 2 beds |
show details | |

|
#3
S Juniper St
Kannapolis, NC 28081
|
1,032 sq. feet
|
1 baths 3 beds |
show details | |

|
#4
Brodie Ct
Kannapolis, NC 28083
|
1,464 sq. feet
|
2 baths 3 beds |
show details | |

|
#5
Kennedy Ave
Kannapolis, NC 28083
|
926 sq. feet
|
1 baths 2 beds |
show details | |

|
#6
Annex Ave
Kannapolis, NC 28083
|
1,061 sq. feet
|
1 baths 2 beds |
show details | |

|
#7
Prince St
Kannapolis, NC 28083
|
994 sq. feet
|
1 baths 2 beds |
show details | |

|
#8
Margate Ave
Kannapolis, NC 28081
|
1,089 sq. feet
|
2 baths 3 beds |
show details | |

|
#9
Mallard Pointe Dr
Kannapolis, NC 28083
|
1,955 sq. feet
|
2 baths 4 beds |
show details | |

|
#10
Courtland Ct
Kannapolis, NC 28081
|
1,891 sq. feet
|
2 baths 4 beds |
show details |
| Photo | Address | Area | Beds / Baths | Price | Details |
|---|---|---|---|---|---|

|
#11
Dakota St
Kannapolis, NC 28083
|
1,271 sq. feet
|
1 baths 2 beds |
show details | |

|
#12
Joyce St
Kannapolis, NC 28083
|
1,485 sq. feet
|
1 baths - beds |
show details | |

|
#13
Tanglewood Dr
Kannapolis, NC 28081
|
1,290 sq. feet
|
2 baths - beds |
show details | |

|
#14
Johnson St
Kannapolis, NC 28081
|
980 sq. feet
|
1 baths - beds |
show details | |

|
#15
E 29th St
Kannapolis, NC 28083
|
1,890 sq. feet
|
2 baths - beds |
show details | |

|
#16
Turner Dr
Kannapolis, NC 28081
|
1,288 sq. feet
|
2 baths - beds |
show details | |

|
#17
Westen Acres Rd
Kannapolis, NC 28081
|
2,240 sq. feet
|
2 baths - beds |
show details | |

|
#18
Brookdale St
Kannapolis, NC 28083
|
1,104 sq. feet
|
2 baths - beds |
show details | |

|
#19
Poplar Glen Dr
Kannapolis, NC 28083
|
2,052 sq. feet
|
2 baths - beds |
show details | |

|
#20
Wright Ave
Kannapolis, NC 28083
|
509 sq. feet
|
1 baths - beds |
show details |
| Photo | Address | Area | Beds / Baths | Price | Details |
|---|---|---|---|---|---|

|
#21
Forest Ridge Rd
Kannapolis, NC 28083
|
1,980 sq. feet
|
2 baths - beds |
show details | |

|
#22
Robinhood Ln
Kannapolis, NC 28081
|
- sq. feet
|
- baths - beds |
show details | |

|
#23
27th St
Kannapolis, NC 28083
|
- sq. feet
|
- baths - beds |
show details | |

|
#24
Holland St
Kannapolis, NC 28083
|
- sq. feet
|
- baths - beds |
show details | |

|
#25
Pearl Ave
Kannapolis, NC 28083
|
- sq. feet
|
- baths - beds |
show details | |

|
#26
Spruce St
Kannapolis, NC 28081
|
- sq. feet
|
- baths - beds |
show details | |

|
#27
Grayson Ln
Kannapolis, NC 28081
|
- sq. feet
|
- baths - beds |
show details | |

|
#28
Brantley Rd
Kannapolis, NC 28083
|
- sq. feet
|
- baths - beds |
show details | |

|
#29
Penny Earley Ln
Kannapolis, NC 28083
|
- sq. feet
|
- baths - beds |
show details | |

|
#30
E 13th St
Kannapolis, NC 28083
|
- sq. feet
|
- baths - beds |
show details |
| Photo | Address | Area | Beds / Baths | Price | Details |
|---|---|---|---|---|---|

|
#31
Inspired Way
Kannapolis, NC 28083
|
- sq. feet
|
- baths - beds |
show details | |

|
#32
Browdis Ave
Kannapolis, NC 28083
|
- sq. feet
|
- baths - beds |
show details | |

|
#33
Psalms St
Kannapolis, NC 28083
|
- sq. feet
|
- baths - beds |
show details | |

|
#34
Irene Ave
Kannapolis, NC 28083
|
- sq. feet
|
- baths - beds |
show details | |

|
#35
Sardis Ave
Kannapolis, NC 28081
|
- sq. feet
|
- baths - beds |
show details | |

|
#36
Kelsey Plz
Kannapolis, NC 28081
|
- sq. feet
|
- baths - beds |
show details | |

|
#37
Catawba Point Ln
Kannapolis, NC 28083
|
- sq. feet
|
- baths - beds |
show details | |

|
#38
Blake Rd
Kannapolis, NC 28081
|
- sq. feet
|
- baths - beds |
show details | |

|
#39
Elizabeth Ave # 102
Kannapolis, NC 28083
|
- sq. feet
|
- baths - beds |
show details | |

|
#40
Oakcrest Dr
Kannapolis, NC 28083
|
- sq. feet
|
- baths - beds |
show details |
| Photo | Address | Area | Beds / Baths | Price | Details |
|---|---|---|---|---|---|

|
#41
Klondale Ave
Kannapolis, NC 28081
|
- sq. feet
|
- baths - beds |
show details | |

|
Check over 1 million property listings on Foreclosure.com!
|
browse all offers | |||

Latest news about housing in Kannapolis, NC collected exclusively by city-data.com from local newspapers, TV, and radio stations

 | True Homes -Upgrade Incentives- Charlotte, NC (13 replies) |
| Kannapolis/Concord (12 replies) |
| Kannapolis insights (4 replies) |
| Greensboro downtown Development. (3795 replies) |
| Love Charlotte.. But Dang Nothing To Rent.. Can Anyone Help Advise Me? (42 replies) |
| Advice On Safe Area For More Affordable Rental (9 replies) |
Median year apartment built: 1987
Household type by relationship:
Households: 55,527- Male householders: 8,820 (2,167 living alone), Female householders: 10,995 (2,587 living alone)
9,801 spouses (9,705 opposite-sex spouses), 1,408 unmarried partners, (1,333 opposite-sex unmarried partners), 17,486 children (15,692 natural, 460 adopted, 1,333 stepchildren), 1,495 grandchildren, 1,102 brothers or sisters, 1,033 parents, 119 foster children, 1,565 other relatives, 1,485 non-relatives
- In group quarters: 213
Size of family households: 6,652 2-persons, 3,180 3-persons, 3,302 4-persons, 921 5-persons, 596 6-persons, 187 7-or-more-persons.
Size of nonfamily households: 5,530 1-person, 1,117 2-persons, 49 3-persons, 20 4-persons, 6 5-persons.
7,173 married couples with children.
4,616 single-parent households (457 men, 4,159 women).
88.5% of residents of Kannapolis speak English at home.
8.6% of residents speak Spanish at home (60% speak English very well, 23% speak English well, 16% speak English not well).
0.7% of residents speak other Indo-European language at home (97% speak English very well, 3% don't speak English at all).
1.6% of residents speak Asian or Pacific Island language at home (66% speak English very well, 31% speak English well, 3% don't speak English at all).
0.1% of residents speak other language at home (100% speak English very well).
Foreign born population: 3,784 (6.8%)
(50.8% of them are naturalized citizens)
| Here: | 5.9 |
| State: | 6.4 |
| Here: | 4.3 |
| State: | 4.4 |
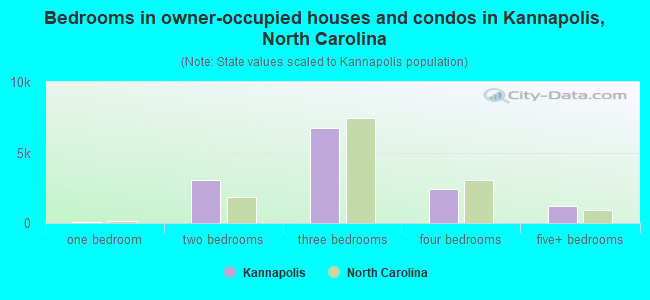
- Bedrooms in owner-occupied houses and condos in Kannapolis, North Carolina
- 14no bedroom
- 981 bedroom
- 3,0242 bedrooms
- 6,7483 bedrooms
- 2,4064 bedrooms
- 1,2025+ bedrooms
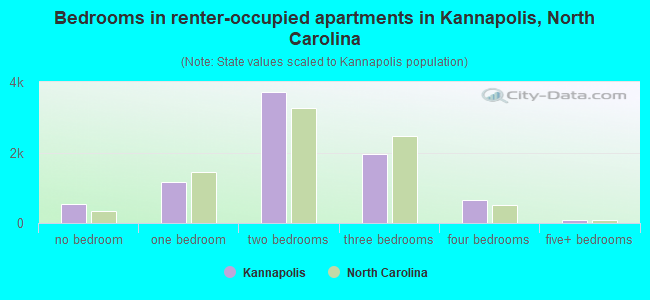
- Bedrooms in renter-occupied apartments in Kannapolis, North Carolina
- 536no bedroom
- 1,1771 bedroom
- 3,7102 bedrooms
- 1,9453 bedrooms
- 6414 bedrooms
- 785+ bedrooms
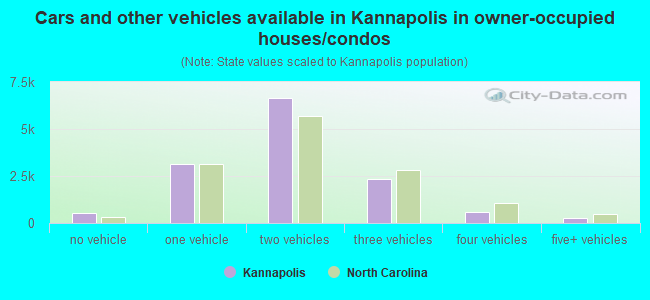
- Cars and other vehicles available in Kannapolis in owner-occupied houses/condos
- 548no vehicle
- 3,1241 vehicle
- 6,6412 vehicles
- 2,3253 vehicles
- 6114 vehicles
- 2435+ vehicles
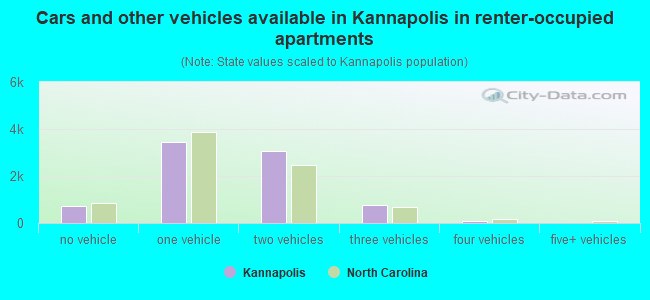
- Cars and other vehicles available in Kannapolis in renter-occupied apartments
- 727no vehicle
- 3,4341 vehicle
- 3,0762 vehicles
- 7603 vehicles
- 914 vehicles
- 05+ vehicles
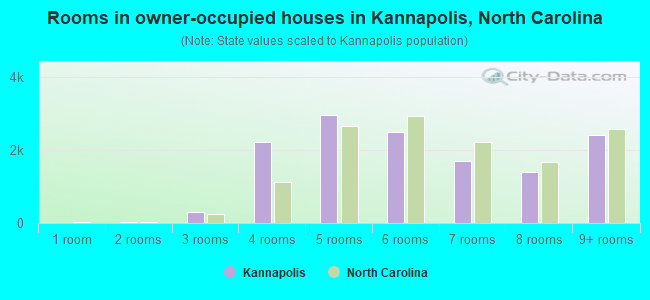
- Rooms in owner-occupied houses in Kannapolis, North Carolina
- 01 room
- 272 rooms
- 3013 rooms
- 2,2334 rooms
- 2,9605 rooms
- 2,4826 rooms
- 1,6947 rooms
- 1,3868 rooms
- 2,4089+ rooms
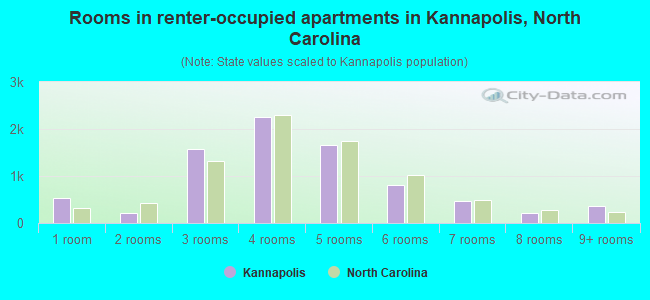
- Rooms in renter-occupied apartments in Kannapolis, North Carolina
- 5361 room
- 2092 rooms
- 1,5743 rooms
- 2,2634 rooms
- 1,6655 rooms
- 8106 rooms
- 4637 rooms
- 2068 rooms
- 3629+ rooms
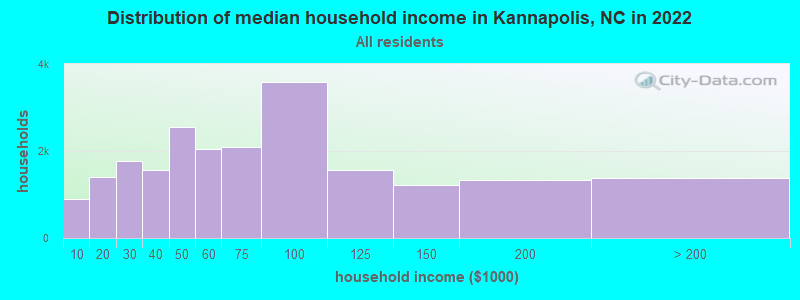
Kannapolis, NC household income distribution

- 887Less than $10,000
- 1,411$10,000 to $19,999
- 1,761$20,000 to $29,999
- 1,553$30,000 to $39,999
- 2,548$40,000 to $49,999
- 2,057$50,000 to $59,999
- 2,086$60,000 to $74,999
- 3,585$75,000 to $99,999
- 1,571$100,000 to $124,999
- 1,226$125,000 to $149,999
- 1,335$150,000 to $199,999
- 1,382$200,000 or more
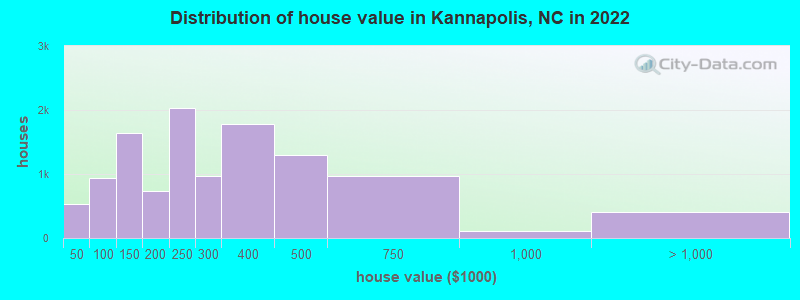
Home value of owner - occupied houses in 2022 in Kannapolis, NC
-
- 53Less than $10,000
- 194$10,000 to $14,999
- 88$15,000 to $19,999
- 34$25,000 to $29,999
- 41$30,000 to $34,999
- 115$40,000 to $49,999
- 76$50,000 to $59,999
- 31$60,000 to $69,999
- 68$70,000 to $79,999
- 292$80,000 to $89,999
- 357$90,000 to $99,999
- 955$100,000 to $124,999
- 688$125,000 to $149,999
- 326$150,000 to $174,999
- 415$175,000 to $199,999
- 2,027$200,000 to $249,999
- 972$250,000 to $299,999
- 1,785$300,000 to $399,999
- 1,299$400,000 to $499,999
- 962$500,000 to $749,999
- 115$750,000 to $999,999
- 322$1,000,000 to $1,499,999
- 51$1,500,000 to $1,999,999
- 33$2,000,000 or more
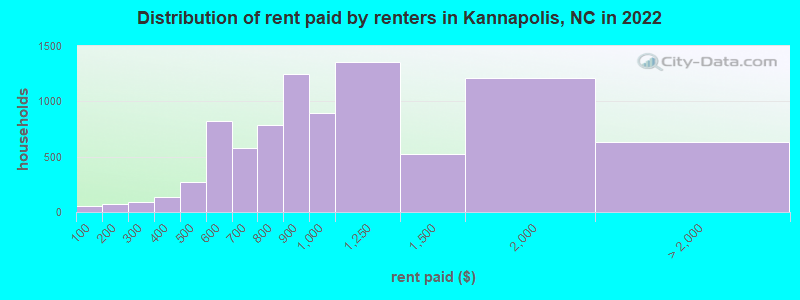
Rent paid by renters in 2022 in Kannapolis, NC
-
- 53Less than $100
- 74$150 to $199
- 44$200 to $249
- 47$250 to $299
- 15$300 to $349
- 120$350 to $399
- 57$400 to $449
- 216$450 to $499
- 413$500 to $549
- 412$550 to $599
- 281$600 to $649
- 297$650 to $699
- 429$700 to $749
- 353$750 to $799
- 1,249$800 to $899
- 893$900 to $999
- 1,358$1,000 to $1,249
- 527$1,250 to $1,499
- 1,206$1,500 to $1,999
- 196$2,000 to $2,499
- 38$2,500 to $2,999
- 34$3,000 to $3,499
- 364No cash rent
Percentage of workers working in this county: 58.0%
Number of people working at home: 3,326 (12.9% of all workers)
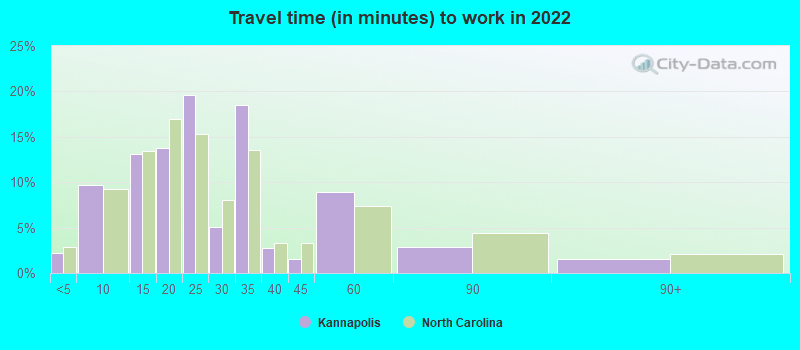
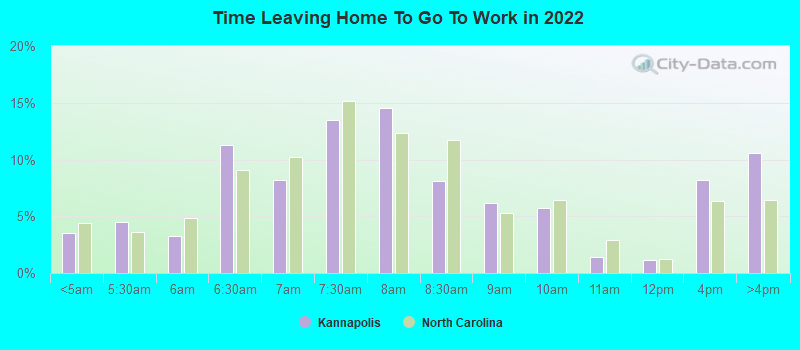
Travel time to work (commute)
- Less than 5 minutes: 342
- 5 to 9 minutes: 1,552
- 10 to 14 minutes: 2,780
- 15 to 19 minutes: 3,149
- 20 to 24 minutes: 3,781
- 25 to 29 minutes: 1,565
- 30 to 34 minutes: 4,129
- 35 to 39 minutes: 591
- 40 to 44 minutes: 436
- 45 to 59 minutes: 1,885
- 60 to 89 minutes: 858
- 90 or more minutes: 184
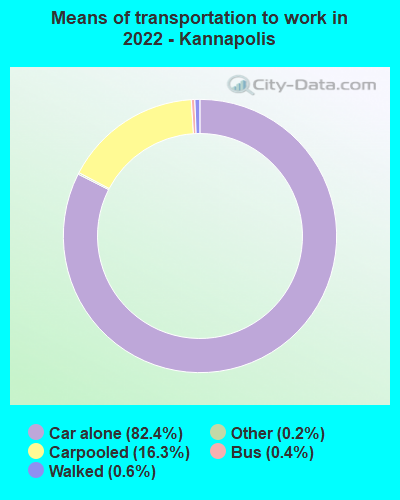
Means of transportation to work:
- Drove a car alone: 12,483 (67.6%)
- Carpooled: 2,574 (13.9%)
- Bus: 42 (0.2%)
- Light rail, streetcar or trolley: 6 (0.0%)
- Taxi: 37 (0.2%)
- Walked: 96 (0.5%)
- Worked at home: 3,326 (18.0%)
- Unemployment by race in 2022
- Unemployment rate for White non-Hispanic residents
- 2.8%Males
- 3.3%Females
- Unemployment rate for Black residents
- 13.1%Males
- 10.1%Females
- Unemployment rate for Asian residents
- 9.2%Females
- Unemployment rate for other race residents
- 2.7%Females
- Unemployment rate for two or more race residents
- 7.4%Males
- Unemployment rate for Hispanic or Latino residents
- 10.6%Males
- 4.1%Females
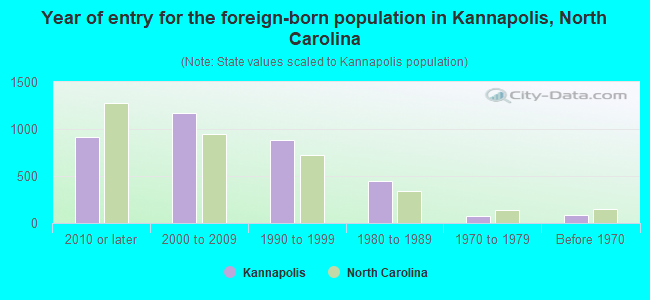
- Year of entry for the foreign-born population in Kannapolis, North Carolina
- 9202010 or later
- 1,1752000 to 2009
- 8781990 to 1999
- 4441980 to 1989
- 791970 to 1979
- 80Before 1970
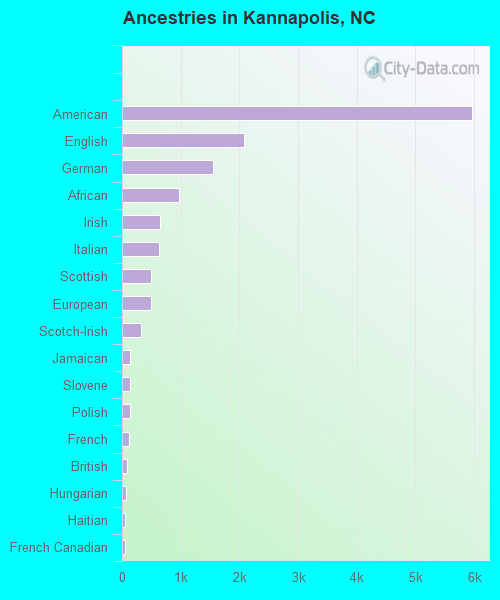
First ancestries reported:
- American: 5,956 (22.7%)
- English: 2,078 (7.9%)
- German: 1,547 (5.9%)
- African: 972 (3.7%)
- Irish: 653 (2.5%)
- Italian: 634 (2.4%)
- Scottish: 496 (1.9%)
- European: 496 (1.9%)
- Scotch-Irish: 326 (1.2%)
- Jamaican: 144 (0.5%)
- Slovene: 140 (0.5%)
- Polish: 133 (0.5%)
- French: 113 (0.4%)
- British: 85 (0.3%)
- Hungarian: 65 (0.2%)
- Haitian: 56 (0.2%)
- French Canadian: 55 (0.2%)
- Norwegian: 54 (0.2%)
- Portuguese: 38 (0.1%)
- Swedish: 35 (0.1%)
- Bulgarian: 34 (0.1%)
- Brazilian: 31 (0.1%)
- Yugoslavian: 30 (0.1%)
- Russian: 27 (0.1%)
- Kenyan: 23 (0.09%)
- Welsh: 22 (0.08%)
- Northern European: 22 (0.08%)
- Israeli: 20 (0.08%)
- Ukrainian: 20 (0.08%)
- Dutch: 17 (0.06%)
- Pennsylvania German: 17 (0.06%)
- Canadian: 14 (0.05%)
- Iranian: 13 (0.05%)
- Slovak: 10 (0.04%)
- Macedonian: 10 (0.04%)
Most common places of birth for foreign-born residents (%):
| Kannapolis: | 35.8% (1,382) |
| North Carolina: | 24.7% (214,776) |
| Kannapolis: | 8.1% (312) |
| North Carolina: | 9.3% (80,594) |
| Kannapolis: | 5.5% (214) |
| North Carolina: | 1.0% (9,005) |
| Kannapolis: | 4.5% (172) |
| North Carolina: | 2.4% (20,695) |
| Kannapolis: | 4.4% (171) |
| North Carolina: | 3.2% (27,477) |
| Kannapolis: | 4.1% (157) |
| North Carolina: | 1.3% (11,419) |
| Kannapolis: | 3.0% (115) |
| North Carolina: | 3.8% (33,379) |
| Kannapolis: | 2.8% (109) |
| North Carolina: | 1.0% (8,426) |
| Kannapolis: | 2.1% (82) |
| North Carolina: | 0.2% (1,464) |
| Kannapolis: | 2.1% (82) |
| North Carolina: | 0.9% (7,765) |
| Kannapolis: | 2.1% (81) |
| North Carolina: | 4.7% (40,707) |
| Kannapolis: | 1.9% (75) |
| North Carolina: | 0.2% (1,928) |
| Kannapolis: | 1.8% (69) |
| North Carolina: | 2.1% (18,275) |
| Kannapolis: | 1.7% (64) |
| North Carolina: | 2.9% (24,965) |
| Kannapolis: | 1.7% (64) |
| North Carolina: | 1.8% (15,988) |
| Kannapolis: | 1.5% (59) |
| North Carolina: | 0.4% (3,066) |
Place of birth for U.S.-born residents:
- This state: 33,111
- Other state: 18,230
- Northeast: 6,548
- Midwest: 2,447
- South: 7,190
- West: 1,926
92.0% of Kannapolis residents lived in the same house 1 years ago.
Out of people who lived in different houses, 21.1% lived in this county.
Out of people who lived in different counties, 63.8% lived in North Carolina.
| Kannapolis: | 92.0% |
| State average: | 87.3% |
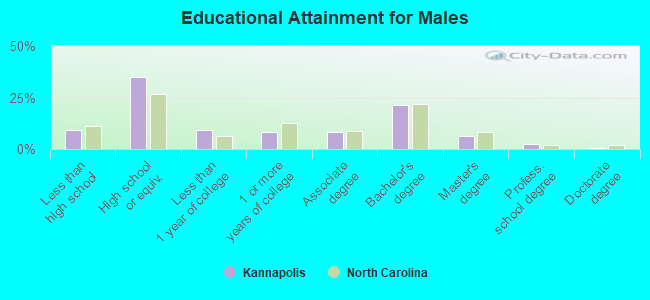
Education attainment for males 25 years and older:
- No schooling: 175
- Nursery to 4th grade: 0
- 5th and 6th grade: 160
- 7th and 8th grade: 207
- 9th grade: 199
- 10th grade: 341
- 11th grade: 87
- 12th grade, no diploma: 469
- High school graduate (or equivalency): 6,157
- Less than 1 year of college: 1,604
- Some college more than 1 year, no degree: 1,484
- Associate degree: 1,452
- Bachelor's degree: 3,733
- Master's degree: 1,104
- Professional school degree: 418
- Doctorate degree: 61
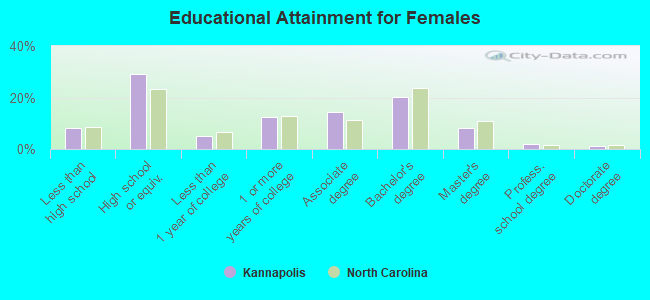
Education attainment for females 25 years and older:
- No schooling: 369
- Nursery to 4th grade: 23
- 5th and 6th grade: 205
- 7th and 8th grade: 89
- 9th grade: 395
- 10th grade: 162
- 11th grade: 221
- 12th grade, no diploma: 111
- High school graduate (or equivalency): 5,607
- Less than 1 year of college: 968
- Some college more than 1 year, no degree: 2,376
- Associate degree: 2,732
- Bachelor's degree: 3,887
- Master's degree: 1,573
- Professional school degree: 338
- Doctorate degree: 199
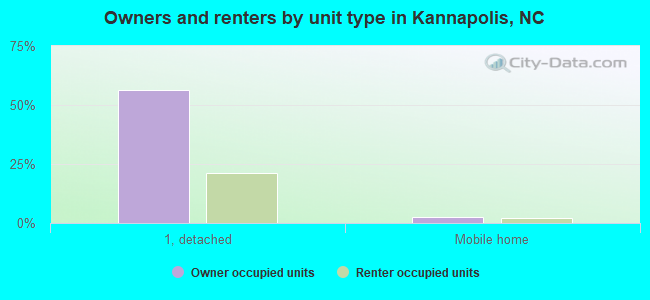
Housing units in structures:
- One, detached: 18,026
- One, attached: 261
- Two: 1,038
- 3 or 4: 571
- 5 to 9: 566
- 10 to 19: 948
- 20 to 49: 667
- 50 or more: 255
- Mobile homes: 922
Median worth of mobile homes: $63,616
Housing units lacking complete kitchen facilities in 2022: 1.6%
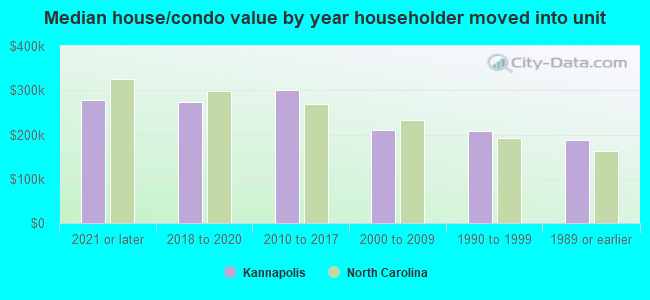
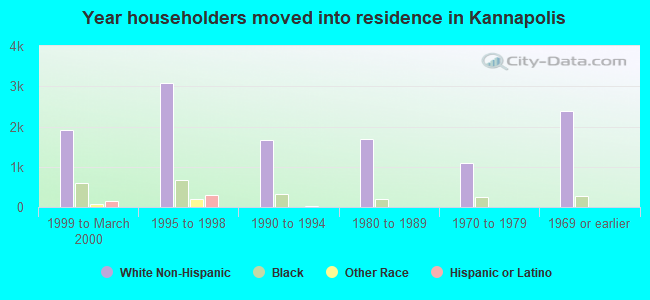
House/condo owner moved in on average 8 years ago
Renter moved in on average 3 years ago
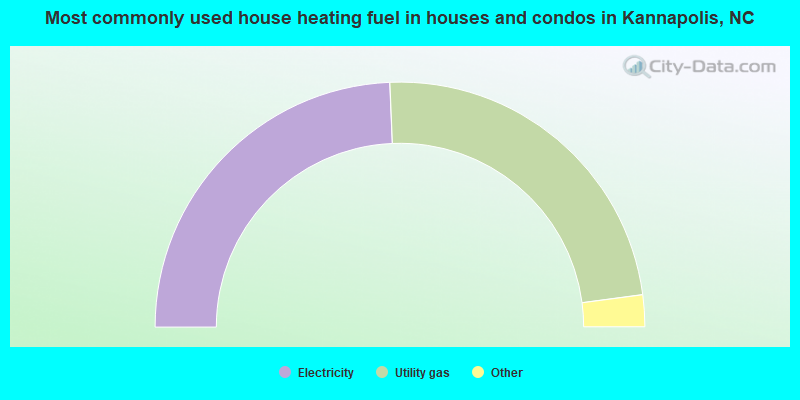
- 48.7%Electricity
- 47.1%Utility gas
- 2.9%Bottled, tank, or LP gas
- 0.6%Fuel oil, kerosene, etc.
- 0.3%Wood
- 0.2%No fuel used
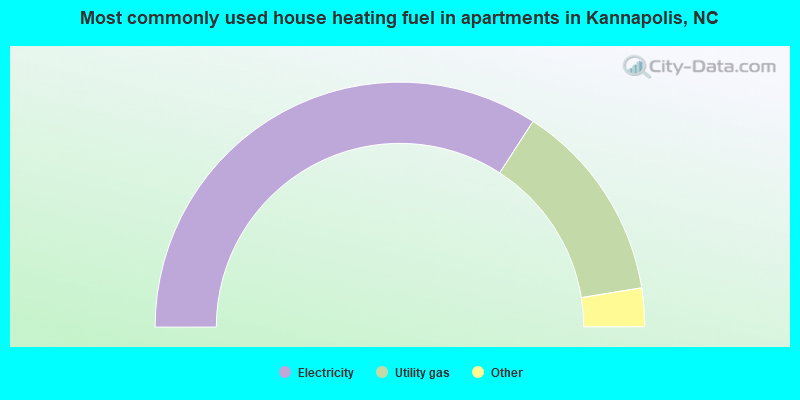
- 68.3%Electricity
- 26.6%Utility gas
- 3.2%Bottled, tank, or LP gas
- 1.0%Fuel oil, kerosene, etc.
- 0.5%No fuel used
- 0.4%Coal or coke
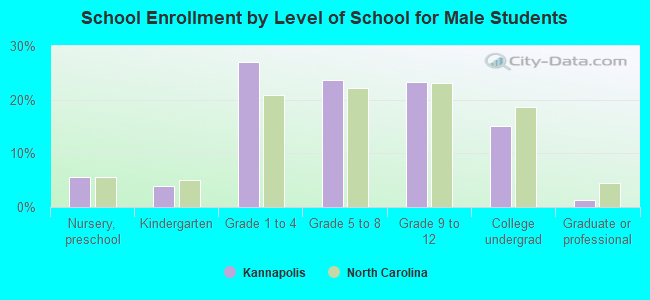
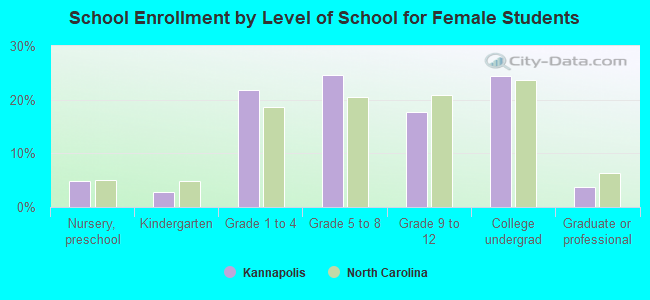
Private vs. public school enrollment:
| Here: | 5.1% |
| North Carolina: | 13.8% |
| Here: | 23.1% |
| North Carolina: | 11.9% |
| Here: | 14.9% |
| North Carolina: | 19.3% |