Races in Kannapolis, North Carolina (NC) Detailed Stats
Data:
Races - White alone (%)
Races - White alone (% change since 2000)
Races - Black alone (%)
Races - Black alone (% change since 2000)
Races - American Indian alone (%)
Races - American Indian alone (% change since 2000)
Races - Asian alone (%)
Races - Asian alone (% change since 2000)
Races - Hispanic (%)
Races - Hispanic (% change since 2000)
Races - Native Hawaiian and Other Pacific Islander alone (%)
Races - Native Hawaiian and Other Pacific Islander alone (% change since 2000)
Races - Two or more races(%)
Races - Two or more races(% change since 2000)
Races - Other race alone (%)
Races - Other race alone (% change since 2000)
Racial diversity
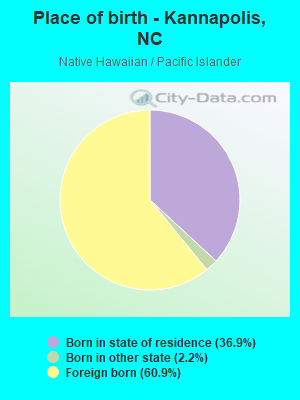
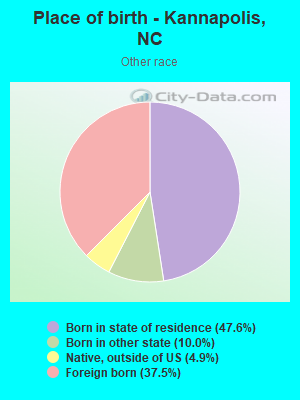
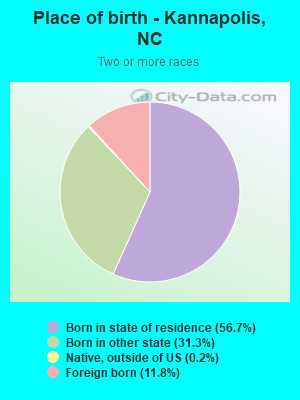
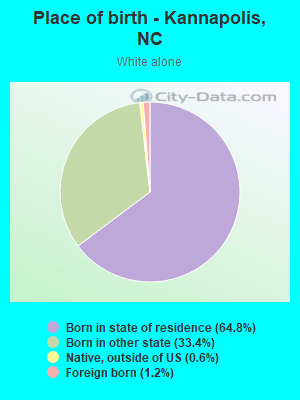
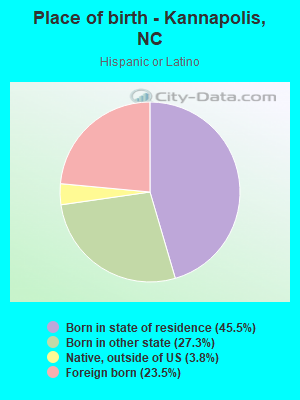
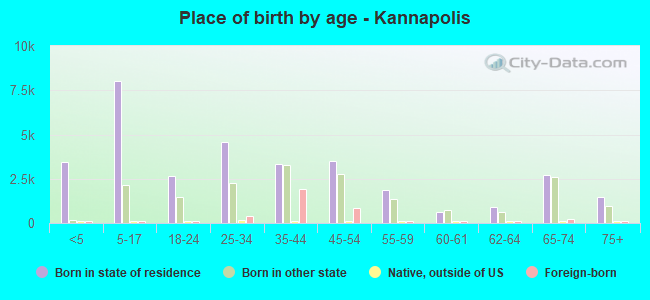
Place of birth - Born in state of residence (%)
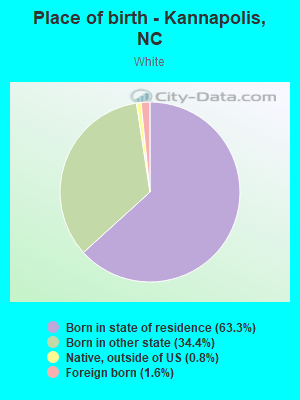
Place of birth - Born in state of residence (%) - White
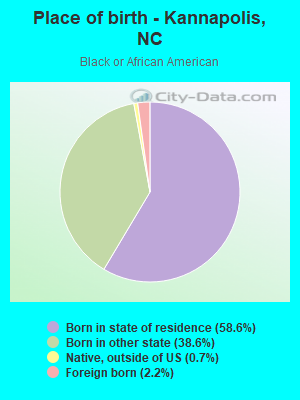
Place of birth - Born in state of residence (%) - Black or African American
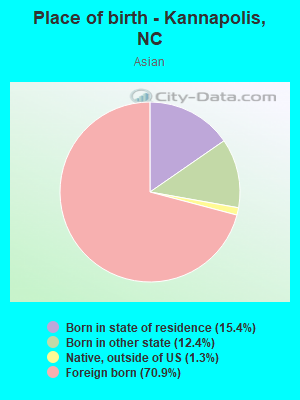
Place of birth - Born in state of residence (%) - Asian
Place of birth - Born in state of residence (%) - Hispanic or Latino
Place of birth - Born in state of residence (%) - American Indian and Alaska Native
Place of birth - Born in state of residence (%) - Multirace
Place of birth - Born in state of residence (%) - Other Race
Place of birth - Born in other state (%)
Place of birth - Born in other state (%) - White
Place of birth - Born in other state (%) - Black or African American
Place of birth - Born in other state (%) - Asian
Place of birth - Born in other state (%) - Hispanic or Latino
Place of birth - Born in other state (%) - American Indian and Alaska Native
Place of birth - Born in other state (%) - Multirace
Place of birth - Born in other state (%) - Other Race
Place of birth - Native, outside of US (%)
Place of birth - Native, outside of US (%) - White
Place of birth - Native, outside of US (%) - Black or African American
Place of birth - Native, outside of US (%) - Asian
Place of birth - Native, outside of US (%) - Hispanic or Latino
Place of birth - Native, outside of US (%) - American Indian and Alaska Native
Place of birth - Native, outside of US (%) - Multirace
Place of birth - Native, outside of US (%) - Other Race
Place of birth - Foreign born (%)
Place of birth - Foreign born (%) - White
Place of birth - Foreign born (%) - Black or African American
Place of birth - Foreign born (%) - Asian
Place of birth - Foreign born (%) - Hispanic or Latino
Place of birth - Foreign born (%) - American Indian and Alaska Native
Place of birth - Foreign born (%) - Multirace
Place of birth - Foreign born (%) - Other Race
Residents speaking English at home (%)
Residents speaking English at home - Born in the United States (%)
Residents speaking English at home - Native, born elsewhere (%)
Residents speaking English at home - Foreign born (%)
Residents speaking Spanish at home (%)
Residents speaking Spanish at home - Born in the United States (%)
Residents speaking Spanish at home - Native, born elsewhere (%)
Residents speaking Spanish at home - Foreign born (%)
Residents speaking other language at home (%)
Residents speaking other language at home - Born in the United States (%)
Residents speaking other language at home - Native, born elsewhere (%)
Residents speaking other language at home - Foreign born (%)
Marital status - Never married (%)
Marital status - Now married (%)
Marital status - Separated (%)
Marital status - Widowed (%)
Marital status - Divorced (%)
Ancestries Reported - Arab (%)
Ancestries Reported - Czech (%)
Ancestries Reported - Danish (%)
Ancestries Reported - Dutch (%)
Ancestries Reported - English (%)
Ancestries Reported - French (%)
Ancestries Reported - French Canadian (%)
Ancestries Reported - German (%)
Ancestries Reported - Greek (%)
Ancestries Reported - Hungarian (%)
Ancestries Reported - Irish (%)
Ancestries Reported - Italian (%)
Ancestries Reported - Lithuanian (%)
Ancestries Reported - Norwegian (%)
Ancestries Reported - Polish (%)
Ancestries Reported - Portuguese (%)
Ancestries Reported - Russian (%)
Ancestries Reported - Scotch-Irish (%)
Ancestries Reported - Scottish (%)
Ancestries Reported - Slovak (%)
Ancestries Reported - Subsaharan African (%)
Ancestries Reported - Swedish (%)
Ancestries Reported - Swiss (%)
Ancestries Reported - Ukrainian (%)
Ancestries Reported - United States (%)
Ancestries Reported - Welsh (%)
Ancestries Reported - West Indian (%)
Ancestries Reported - Other (%)
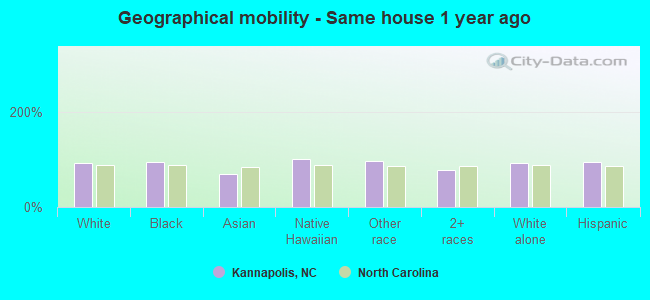
Geographical mobility - Same house 1 year ago (%)
Geographical mobility - Same house 1 year ago (%) - White
Geographical mobility - Same house 1 year ago (%) - Black or African American
Geographical mobility - Same house 1 year ago (%) - Asian
Geographical mobility - Same house 1 year ago (%) - Hispanic or Latino
Geographical mobility - Same house 1 year ago (%) - American Indian and Alaska Native
Geographical mobility - Same house 1 year ago (%) - Multirace
Geographical mobility - Same house 1 year ago (%) - Other Race
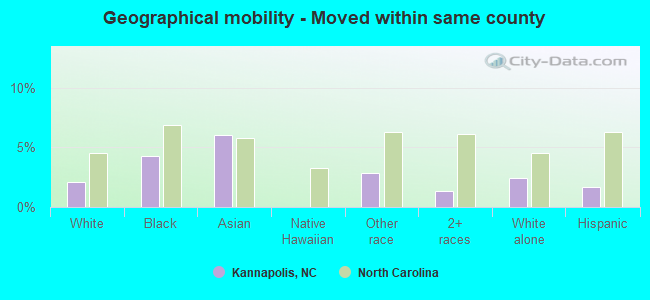
Geographical mobility - Moved within same county (%)
Geographical mobility - Moved within same county (%) - White
Geographical mobility - Moved within same county (%) - Black or African American
Geographical mobility - Moved within same county (%) - Asian
Geographical mobility - Moved within same county (%) - Hispanic or Latino
Geographical mobility - Moved within same county (%) - American Indian and Alaska Native
Geographical mobility - Moved within same county (%) - Multirace
Geographical mobility - Moved within same county (%) - Other Race
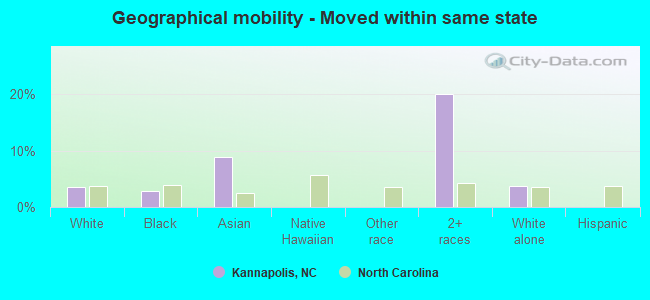
Geographical mobility - Moved from different county within same state (%)
Geographical mobility - Moved from different county within same state (%) - White
Geographical mobility - Moved from different county within same state (%) - Black or African American
Geographical mobility - Moved from different county within same state (%) - Asian
Geographical mobility - Moved from different county within same state (%) - Hispanic or Latino
Geographical mobility - Moved from different county within same state (%) - American Indian and Alaska Native
Geographical mobility - Moved from different county within same state (%) - Multirace
Geographical mobility - Moved from different county within same state (%) - Other Race
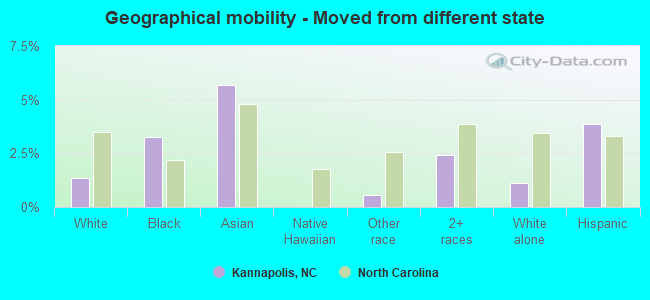
Geographical mobility - Moved from different state (%)
Geographical mobility - Moved from different state (%) - White
Geographical mobility - Moved from different state (%) - Black or African American
Geographical mobility - Moved from different state (%) - Asian
Geographical mobility - Moved from different state (%) - Hispanic or Latino
Geographical mobility - Moved from different state (%) - American Indian and Alaska Native
Geographical mobility - Moved from different state (%) - Multirace
Geographical mobility - Moved from different state (%) - Other Race
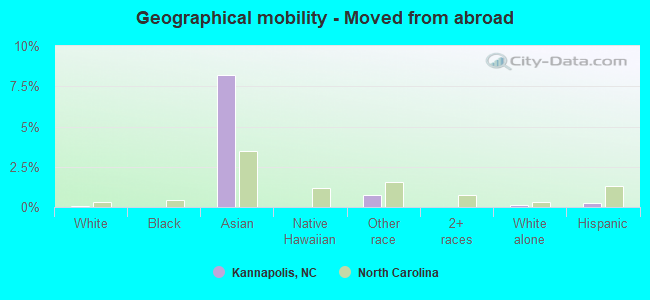
Geographical mobility - Moved from abroad (%)
Geographical mobility - Moved from abroad (%) - White
Geographical mobility - Moved from abroad (%) - Black or African American
Geographical mobility - Moved from abroad (%) - Asian
Geographical mobility - Moved from abroad (%) - Hispanic or Latino
Geographical mobility - Moved from abroad (%) - American Indian and Alaska Native
Geographical mobility - Moved from abroad (%) - Multirace
Geographical mobility - Moved from abroad (%) - Other Race
Place of birth for the foreign-born population - Ireland (%)
Place of birth for the foreign-born population - Denmark (%)
Place of birth for the foreign-born population - Norway (%)
Place of birth for the foreign-born population - Sweden (%)
Place of birth for the foreign-born population - United Kingdom (%)
Place of birth for the foreign-born population - England (%)
Place of birth for the foreign-born population - Scotland (%)
Place of birth for the foreign-born population - Other Northern Europe (%)
Place of birth for the foreign-born population - Austria (%)
Place of birth for the foreign-born population - Belgium (%)
Place of birth for the foreign-born population - France (%)
Place of birth for the foreign-born population - Germany (%)
Place of birth for the foreign-born population - Netherlands (%)
Place of birth for the foreign-born population - Switzerland (%)
Place of birth for the foreign-born population - Other Western Europe (%)
Place of birth for the foreign-born population - Greece (%)
Place of birth for the foreign-born population - Italy (%)
Place of birth for the foreign-born population - Portugal (%)
Place of birth for the foreign-born population - Spain (%)
Place of birth for the foreign-born population - Other Southern Europe (%)
Place of birth for the foreign-born population - Albania (%)
Place of birth for the foreign-born population - Belarus (%)
Place of birth for the foreign-born population - Bosnia and Herzegovina (%)
Place of birth for the foreign-born population - Bulgaria (%)
Place of birth for the foreign-born population - Croatia (%)
Place of birth for the foreign-born population - Czechoslovakia (%)
Place of birth for the foreign-born population - Hungary (%)
Place of birth for the foreign-born population - Latvia (%)
Place of birth for the foreign-born population - Lithuania (%)
Place of birth for the foreign-born population - North Macedonia (Macedonia) (%)
Place of birth for the foreign-born population - Moldova (%)
Place of birth for the foreign-born population - Poland (%)
Place of birth for the foreign-born population - Romania (%)
Place of birth for the foreign-born population - Russia (%)
Place of birth for the foreign-born population - Serbia (%)
Place of birth for the foreign-born population - Ukraine (%)
Place of birth for the foreign-born population - Other Eastern Europe (%)
Place of birth for the foreign-born population - China (%)
Place of birth for the foreign-born population - Hong Kong (%)
Place of birth for the foreign-born population - Taiwan (%)
Place of birth for the foreign-born population - Japan (%)
Place of birth for the foreign-born population - Korea (%)
Place of birth for the foreign-born population - Other Eastern Asia (%)
Place of birth for the foreign-born population - Afghanistan (%)
Place of birth for the foreign-born population - Bangladesh (%)
Place of birth for the foreign-born population - India (%)
Place of birth for the foreign-born population - Iran (%)
Place of birth for the foreign-born population - Kazakhstan (%)
Place of birth for the foreign-born population - Nepal (%)
Place of birth for the foreign-born population - Pakistan (%)
Place of birth for the foreign-born population - Sri Lanka (%)
Place of birth for the foreign-born population - Uzbekistan (%)
Place of birth for the foreign-born population - Other South Central Asia (%)
Place of birth for the foreign-born population - Burma (%)
Place of birth for the foreign-born population - Cambodia (%)
Place of birth for the foreign-born population - Indonesia (%)
Place of birth for the foreign-born population - Laos (%)
Place of birth for the foreign-born population - Malaysia (%)
Place of birth for the foreign-born population - Philippines (%)
Place of birth for the foreign-born population - Singapore (%)
Place of birth for the foreign-born population - Thailand (%)
Place of birth for the foreign-born population - Vietnam (%)
Place of birth for the foreign-born population - Other South Eastern Asia (%)
Place of birth for the foreign-born population - Armenia (%)
Place of birth for the foreign-born population - Iraq (%)
Place of birth for the foreign-born population - Israel (%)
Place of birth for the foreign-born population - Jordan (%)
Place of birth for the foreign-born population - Kuwait (%)
Place of birth for the foreign-born population - Lebanon (%)
Place of birth for the foreign-born population - Saudi Arabia (%)
Place of birth for the foreign-born population - Syria (%)
Place of birth for the foreign-born population - Turkey (%)
Place of birth for the foreign-born population - Yemen (%)
Place of birth for the foreign-born population - Other Western Asia (%)
Place of birth for the foreign-born population - Eritrea (%)
Place of birth for the foreign-born population - Ethiopia (%)
Place of birth for the foreign-born population - Kenya (%)
Place of birth for the foreign-born population - Somalia (%)
Place of birth for the foreign-born population - Uganda (%)
Place of birth for the foreign-born population - Zimbabwe (%)
Place of birth for the foreign-born population - Other Eastern Africa (%)
Place of birth for the foreign-born population - Cameroon (%)
Place of birth for the foreign-born population - Congo (%)
Place of birth for the foreign-born population - Democratic Republic of Congo (Zaire) (%)
Place of birth for the foreign-born population - Other Middle Africa (%)
Place of birth for the foreign-born population - Egypt (%)
Place of birth for the foreign-born population - Morocco (%)
Place of birth for the foreign-born population - Sudan (%)
Place of birth for the foreign-born population - Other Northern Africa (%)
Place of birth for the foreign-born population - South Africa (%)
Place of birth for the foreign-born population - Other Southern Africa (%)
Place of birth for the foreign-born population - Cabo Verde (%)
Place of birth for the foreign-born population - Ghana (%)
Place of birth for the foreign-born population - Liberia (%)
Place of birth for the foreign-born population - Nigeria (%)
Place of birth for the foreign-born population - Senegal (%)
Place of birth for the foreign-born population - Sierra Leone (%)
Place of birth for the foreign-born population - Other Western Africa (%)
Place of birth for the foreign-born population - Australia (%)
Place of birth for the foreign-born population - New Zealand (%)
Place of birth for the foreign-born population - Fiji (%)
Place of birth for the foreign-born population - Micronesia (%)
Place of birth for the foreign-born population - Bahamas (%)
Place of birth for the foreign-born population - Barbados (%)
Place of birth for the foreign-born population - Cuba (%)
Place of birth for the foreign-born population - Dominica (%)
Place of birth for the foreign-born population - Dominican Republic (%)
Place of birth for the foreign-born population - Grenada (%)
Place of birth for the foreign-born population - Haiti (%)
Place of birth for the foreign-born population - Jamaica (%)
Place of birth for the foreign-born population - St. Vincent and the Grenadines (%)
Place of birth for the foreign-born population - Trinidad and Tobago (%)
Place of birth for the foreign-born population - West Indies (%)
Place of birth for the foreign-born population - Other Caribbean (%)
Place of birth for the foreign-born population - Belize (%)
Place of birth for the foreign-born population - Costa Rica (%)
Place of birth for the foreign-born population - El Salvador (%)
Place of birth for the foreign-born population - Guatemala (%)
Place of birth for the foreign-born population - Honduras (%)
Place of birth for the foreign-born population - Mexico (%)
Place of birth for the foreign-born population - Nicaragua (%)
Place of birth for the foreign-born population - Panama (%)
Place of birth for the foreign-born population - Other Central America (%)
Place of birth for the foreign-born population - Argentina (%)
Place of birth for the foreign-born population - Bolivia (%)
Place of birth for the foreign-born population - Brazil (%)
Place of birth for the foreign-born population - Chile (%)
Place of birth for the foreign-born population - Colombia (%)
Place of birth for the foreign-born population - Ecuador (%)
Place of birth for the foreign-born population - Guyana (%)
Place of birth for the foreign-born population - Peru (%)
Place of birth for the foreign-born population - Uruguay (%)
Place of birth for the foreign-born population - Venezuela (%)
Place of birth for the foreign-born population - Other South America (%)
Place of birth for the foreign-born population - Canada (%)
Place of birth for the foreign-born population - Other Northern America (%)
Place of birth for the foreign-born population - Other (%)
Latest news about races in Kannapolis, NC collected exclusively by city-data.com from local newspapers, TV, and radio stations
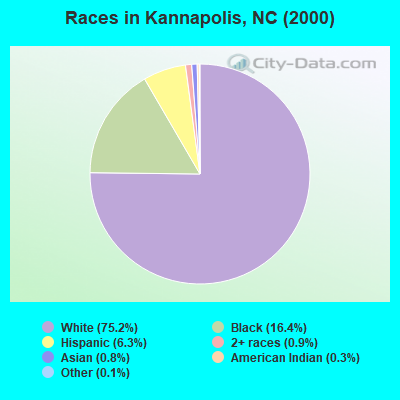
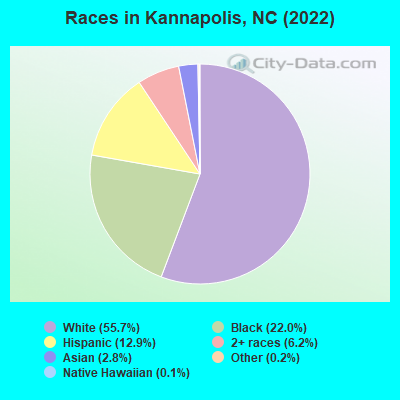
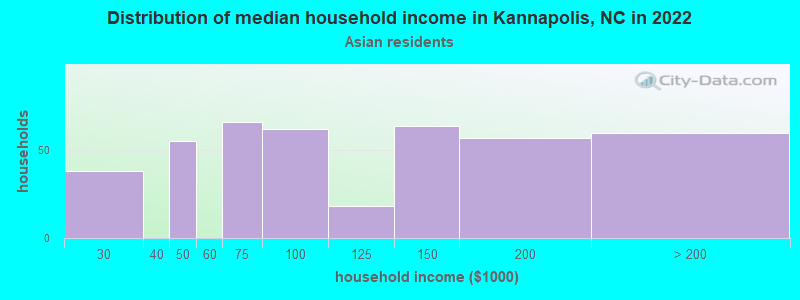
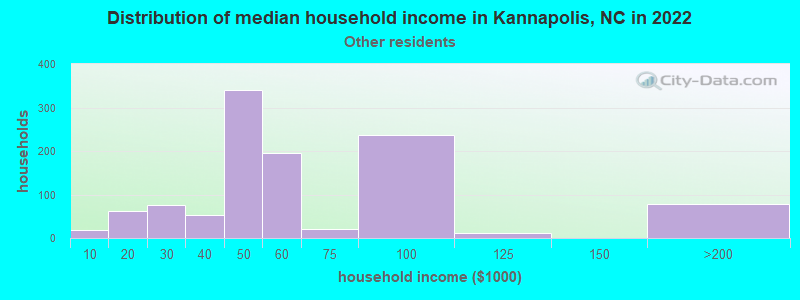
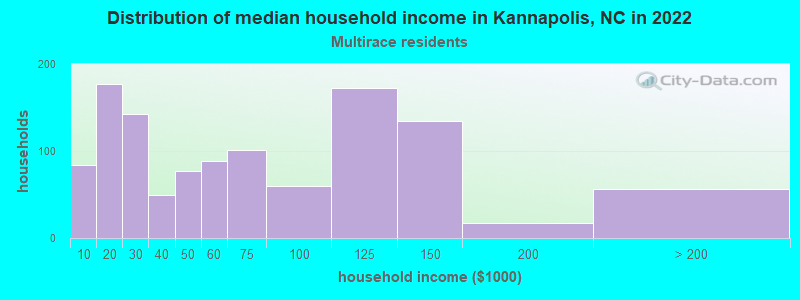
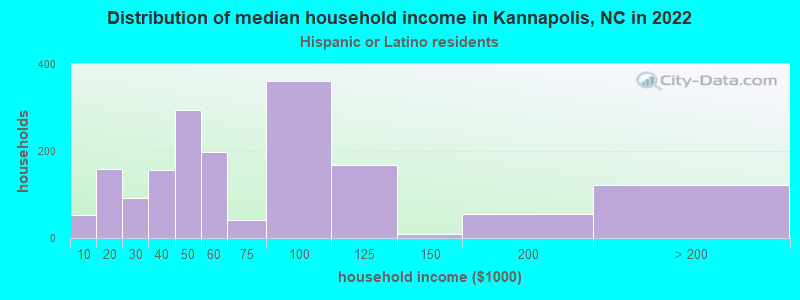
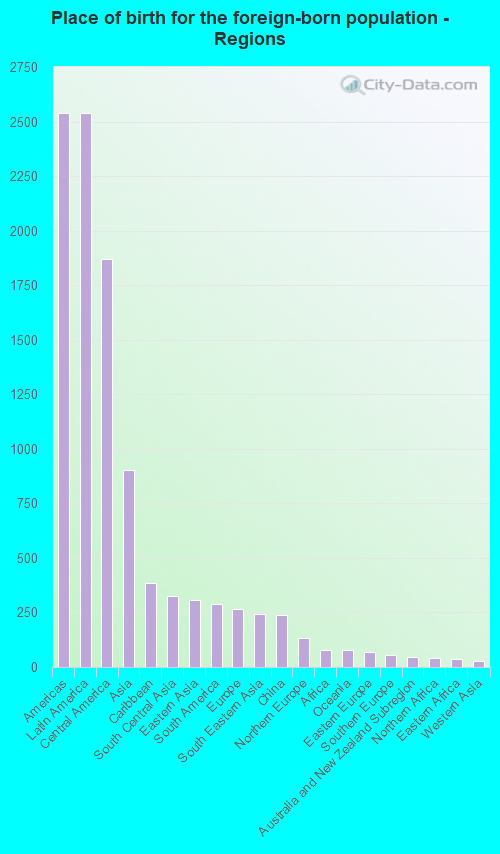
According to 2022 data, the most numerous races in Kannapolis, NC are White alone (30,950 residents), Black alone (12,242 residents), and Hispanic (7,136 residents). 86.9% of Kannapolis residents speak English at home. 7.0% of Kannapolis, NC residents are foreign-born (4.5% born in Latin America, 1.6% born in Asia), which is 15.1% less than the foreign-born rate of 8.0% across the entire state of North Carolina.
Race distribution in Kannapolis
2000 2022
5,647,155 70.2% White alone 1,723,301 21.4% Black alone 378,963 4.7% Hispanic 112,416 1.4% Asian alone 95,333 1.2% American Indian alone 79,965 1.0% Two or more races 9,015 0.1% Other race alone 3,165 0.04% Native Hawaiian and Other
6,497,519 60.7% White alone 2,155,650 20.1% Black alone 1,114,799 10.4% Hispanic 438,061 4.1% Two or more races 341,052 3.2% Asian alone 91,758 0.9% American Indian alone 50,180 0.5% Other race alone 9,954 0.09% Native Hawaiian and Other
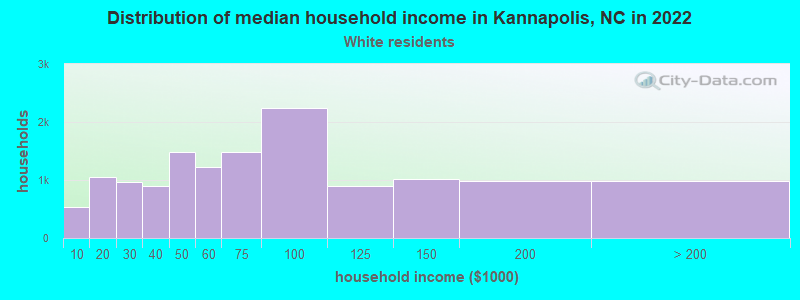
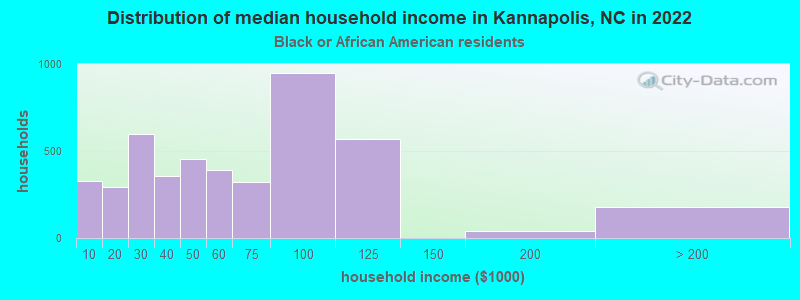
Income and house value in Kannapolis Median household income in 2022 $67,937 White non-Hispanic householders$56,487 Black householders$120,083 Asian householders$41,078 Some other race householders$40,578 Two or more races householders$47,438 Hispanic or Latino race householdersMedian 2022 house value $283,772 White Non-Hispanic householders$251,106 Black or African American householders$214,479 American Indian or Alaska Native householders $222,398 Asian householders$266,284 Some other race householders$115,488 Two or more races householders$244,836 Hispanic or Latino householders
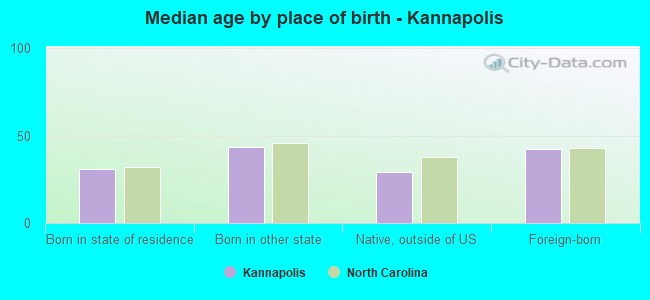
Median age by race in Kannapolis
42.6 Median age for White residents41.5 44.3 33.5 Median age for Black or African American residents37.1 32.1 -1,148,809,522.7 Median age for American Indian / Alaska Native residents-668,604,650.5 -682,971,013.8 32.3 Median age for Asian residents35.9 30.3 35.8 Median age for Native Hawaiian / Pacific Islander residents-666,666,666.0 35.9 33.7 Median age for Other race residents31.6 38.6 16.5 Median age for Two or more races residents16.0 15.2 43.4 Median age for White alone residents41.7 46.0 23.9 Median age for Hispanic or Latino residents15.9 27.6
Owner/renter occupied households by race in Kannapolis
House owners and renters - White residents 9,686 70.3% Owner occupied4,084 29.7% Renter occupiedHouse owners and renters - Black or African American residents 1,403 27.8% Owner occupied3,654 72.2% Renter occupiedHouse owners and renters - Asian residents 267 75.9% Owner occupied85 24.1% Renter occupiedHouse owners and renters - Native Hawaiian / Pacific Islander residents 39 100.0% Owner occupiedHouse owners and renters - Other race residents 480 42.7% Owner occupied645 57.3% Renter occupiedHouse owners and renters - Two or more races residents 865 64.7% Owner occupied472 35.3% Renter occupiedHouse owners and renters - White alone residents 9,642 70.8% Owner occupied3,984 29.2% Renter occupiedHouse owners and renters - Hispanic or Latino residents 956 50.5% Owner occupied936 49.5% Renter occupied
Language usage in Kannapolis
English speakers - Total 86.9% of residents of Kannapolis speak English at home.
9.4% of residents speak Spanish at home 3,032 61.9% Speak English very well1,867 38.1% Speak English less than very well2.9% of residents speak other language at home 1,116 74.3% Speak English very well386 25.7% Speak English less than very well
English speakers - Born in the United States 94.9% of residents of Kannapolis speak English at home.
4.7% of residents speak Spanish at home 806 94.3% Speak English very well49 5.7% Speak English less than very well0.7% of residents speak other language at home 124 100.0% Speak English very well
English speakers - Native, born elsewhere 45.0% of residents of Kannapolis speak English at home.
22.5% of residents speak Spanish at home 145 100.0% Speak English less than very well
English speakers - Foreign-born 15.2% of residents of Kannapolis speak English at home.
45.7% of residents speak Spanish at home 496 28.8% Speak English very well1,227 71.2% Speak English less than very well32.0% of residents speak other language at home 803 66.6% Speak English very well403 33.4% Speak English less than very well
White (Caucasian) - Speak only English Native:
99.0% (29,698)Foreign-born:
32.2% (164)
White (Caucasian) - Speak another language Native:
1.4% (409)Foreign-born:
66.3% (338)
Black or African American - Speak only English Native:
97.3% (11,058)Foreign-born:
64.2% (172)
Black or African American - Speak another language Native:
0.9% (98)Foreign-born:
33.0% (89)
Asian - Speak only English Native:
73.8% (305)Foreign-born:
18.6% (188)
Asian - Speak another language Native:
28.3% (117)Foreign-born:
81.5% (824)
Other race - Speak only English Native:
12.5% (205)Foreign-born:
5.5% (55)
Other race - Speak another language Native:
88.3% (1,447)Foreign-born:
100.0% (1,007)
Two or more races - Speak only English Native:
67.8% (3,290)Foreign-born:
3.6% (30)
Two or more races - Speak another language Native:
16.9% (819)Foreign-born:
97.3% (788)
White alone - Speak only English Native:
99.8% (28,944)Foreign-born:
34.8% (130)
White alone - Speak another language Native:
0.5% (154)Foreign-born:
53.7% (201)
Hispanic or Latino - Speak only English Native:
35.8% (1,758)Foreign-born:
9.9% (160)
Hispanic or Latino - Speak another language Native:
64.0% (3,143)Foreign-born:
98.3% (1,592)
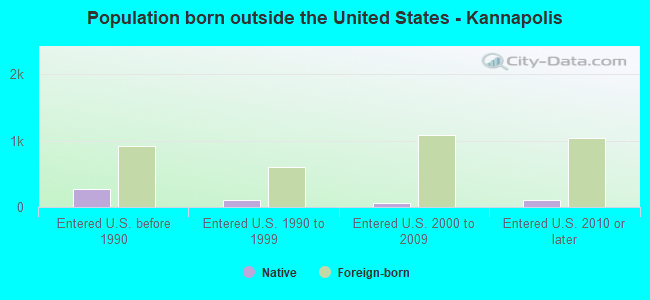
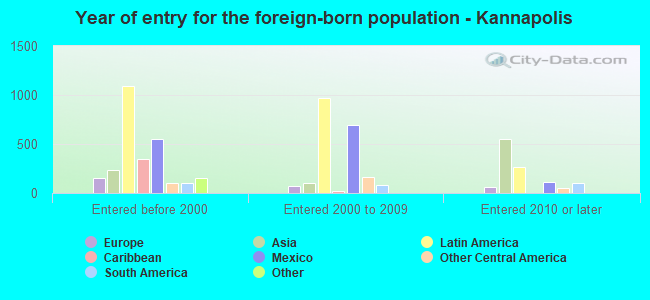
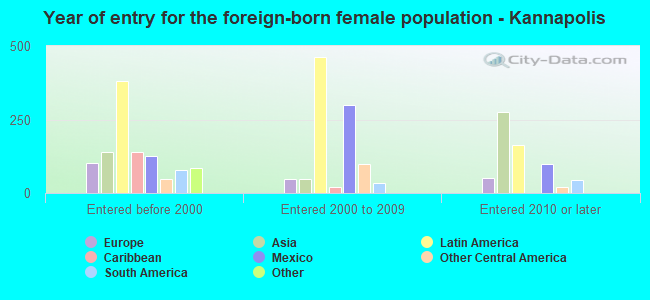
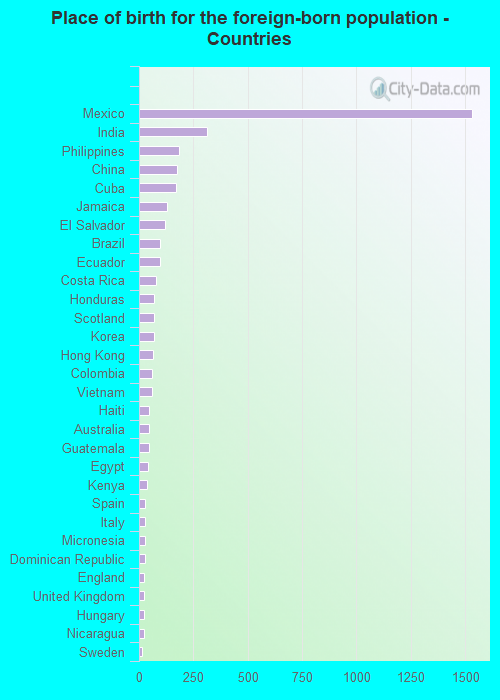
Foreign-born residents in Kannapolis 3,860 residents are foreign born (4.5% Latin America , 1.6% Asia ).
This city:
7.0%North Carolina:
8.3%
Marital status for residents in Kannapolis Marital status - White (Caucasian) population 15 years and over
Males 31.2% Never married51.7% Now married6.3% Separated1.9% Widowed8.8% DivorcedFemales 23.9% Never married47.8% Now married2.9% Separated9.6% Widowed15.8% DivorcedWomen who gave birth in the past 12 months Now married:
89.8% (233)Unmarried:
10.2% (27)
Women who did not give birth in the past 12 months Now married:
44.2% (2,827)Unmarried:
55.8% (3,569)
Marital status - Black or African American population 15 years and over
Males 44.4% Never married36.7% Now married1.3% Separated13.4% Widowed4.2% DivorcedFemales 47.2% Never married30.3% Now married1.0% Separated7.8% Widowed13.7% DivorcedWomen who gave birth in the past 12 months Now married:
100.0% (31)Unmarried:
0.0% (0)
Women who did not give birth in the past 12 months Now married:
26.8% (896)Unmarried:
73.2% (2,443)
Marital status - Asian population 15 years and over
Males 6.2% Never married93.8% Now married0.0% Separated0.0% Widowed0.0% DivorcedFemales 32.8% Never married54.2% Now married0.0% Separated3.1% Widowed9.8% DivorcedWomen who did not give birth in the past 12 months Now married:
51.9% (280)Unmarried:
48.1% (259)
Marital status - Other race population 15 years and over
Males 40.8% Never married54.9% Now married2.1% Separated0.0% Widowed2.2% DivorcedFemales 30.7% Never married58.9% Now married6.5% Separated0.0% Widowed3.9% DivorcedWomen who gave birth in the past 12 months Now married:
100.0% (33)Unmarried:
0.0% (0)
Women who did not give birth in the past 12 months Now married:
64.5% (576)Unmarried:
35.5% (317)
Marital status - Two or more races population 15 years and over
Males 46.2% Never married45.4% Now married0.0% Separated2.1% Widowed6.3% DivorcedFemales 39.2% Never married42.2% Now married7.9% Separated7.8% Widowed2.9% DivorcedWomen who gave birth in the past 12 months Now married:
100.0% (85)Unmarried:
0.0% (0)
Women who did not give birth in the past 12 months Now married:
47.1% (443)Unmarried:
52.9% (498)
Marital status - White alone, not Hispanic / Latino population 15 years and over
Males 30.6% Never married51.4% Now married6.7% Separated2.0% Widowed9.3% DivorcedFemales 22.2% Never married48.1% Now married3.0% Separated10.1% Widowed16.6% DivorcedWomen who gave birth in the past 12 months Now married:
94.8% (240)Unmarried:
5.2% (13)
Women who did not give birth in the past 12 months Now married:
45.2% (2,737)Unmarried:
54.8% (3,316)
Marital status - Hispanic or Latino population 15 years and over
Males 44.3% Never married53.0% Now married1.0% Separated0.0% Widowed1.7% DivorcedFemales 43.5% Never married49.3% Now married5.5% Separated0.0% Widowed1.7% DivorcedWomen who gave birth in the past 12 months Now married:
83.9% (89)Unmarried:
16.1% (17)
Women who did not give birth in the past 12 months Now married:
47.6% (812)Unmarried:
52.4% (895)
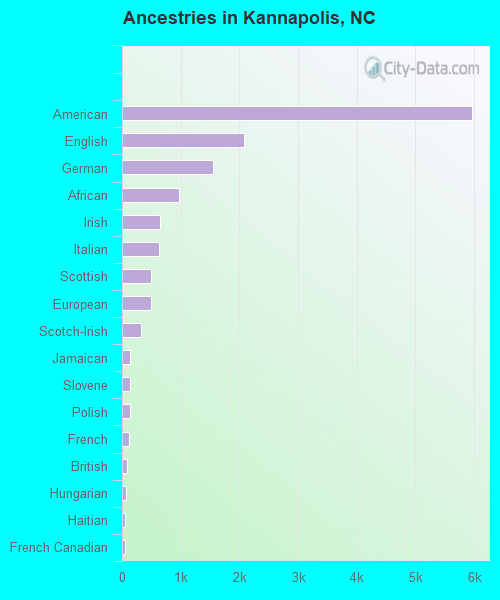
Ancestries in Kannapolis
5,956 22.7% American2,078 7.9% English1,547 5.9% German972 3.7% African653 2.5% Irish634 2.4% Italian496 1.9% Scottish496 1.9% European326 1.2% Scotch-Irish144 0.5% Jamaican140 0.5% Slovene133 0.5% Polish113 0.4% French85 0.3% British65 0.2% Hungarian56 0.2% Haitian55 0.2% French Canadian54 0.2% Norwegian38 0.1% Portuguese35 0.1% Swedish34 0.1% Bulgarian31 0.1% Brazilian30 0.1% Yugoslavian27 0.1% Russian23 0.09% Kenyan22 0.08% Welsh22 0.08% Northern European20 0.08% Israeli20 0.08% Ukrainian17 0.06% Dutch17 0.06% Pennsylvania German14 0.05% Canadian13 0.05% Iranian10 0.04% Slovak10 0.04% Macedonian
Geographical mobility in Kannapolis Same house 1 year ago 29,512 93.3% White (Caucasian)11,705 95.0% Black or African American920 70.3% Asian83 100.0% Native Hawaiian / Pacific Islander3,364 95.9% Other race4,105 78.0% Two or more races28,507 92.8% White alone, not Hispanic / Latino6,391 95.2% Hispanic or LatinoMoved within same county 670 2.1% White / Caucasian525 4.3% Black or African American79 6.0% Asian100 2.9% Other race68 1.3% Two or more races742 2.4% White alone, not Hispanic / Latino114 1.7% Hispanic or LatinoMoved within same state 1,113 3.5% White / Caucasian355 2.9% Black or African American115 8.8% Asian1,051 20.0% Two or more races1,135 3.7% White alone, not Hispanic / LatinoMoved from different state 432 1.4% White / Caucasian403 3.3% Black or African American75 5.7% Asian19 0.5% Other race126 2.4% Two or more races345 1.1% White alone, not Hispanic / Latino259 3.9% Hispanic or LatinoMoved from abroad 29 0.1% White108 8.2% Asian27 0.8% Other race29 0.1% White alone, not Hispanic / Latino17 0.3% Hispanic or Latino
Children Nativity (place of birth) in Kannapolis
Children under 6 years - Living with two parents Both parents native 1,996 100.0% NativeBoth parents foreign-born 92 82.1% Native20 17.9% Foreign-bornOne native, one foreign-born parent 292 100.0% NativeChildren under 6 years - Living with one parent Native parent 1,435 100.0% NativeForeign-born parent 122 100.0% NativeChildren 6 to 17 years - Living with two parents Both parents native 2,857 100.0% NativeBoth parents foreign-born 1,229 93.2% Native90 6.8% Foreign-bornOne native, one foreign-born parent 644 100.0% NativeChildren 6 to 17 years - Living with one parent Native parent 4,168 100.0% NativeForeign-born parent 34 54.6% Native28 45.4% Foreign-born
Grandparents responsible for own grandchildren in Kannapolis
Grandparents (30 to 59 years) White / Caucasian 61 46.5% Responsible for grandchildren71 53.5% Not responsible for grandchildrenBlack or African American 40 100.0% Responsible for grandchildrenOther race 207 100.0% Not responsible for grandchildrenWhite alone, not Hispanic / Latino 61 44.6% Responsible for grandchildren76 55.4% Not responsible for grandchildrenHispanic or Latino 188 100.0% Not responsible for grandchildrenGrandparents (60 years and over) White / Caucasian 440 58.0% Responsible for grandchildren319 42.0% Not responsible for grandchildrenBlack or African American 11 100.0% Responsible for grandchildrenWhite alone, not Hispanic / Latino 440 57.8% Responsible for grandchildren322 42.2% Not responsible for grandchildren