Kenmore, WA (Washington) Houses and Residents
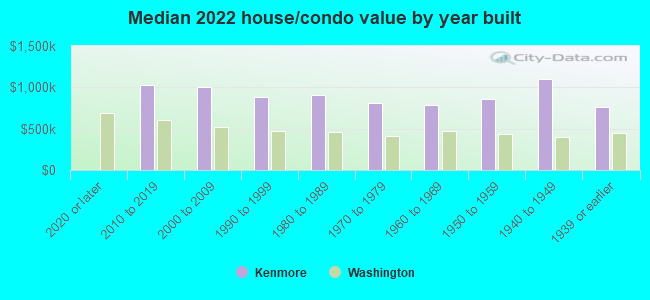
| Kenmore: | $909,188 |
| Washington: | $569,500 |
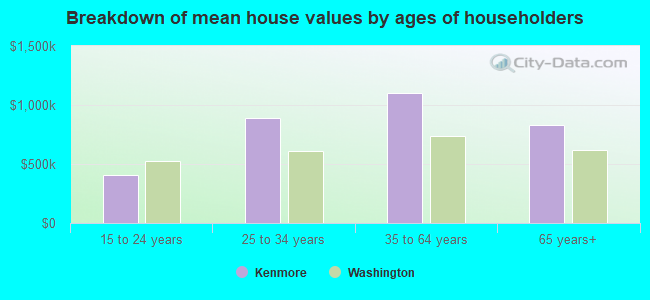
Mean price in 2022:
Detached houses: $988,194
Here: $988,194 State: $734,307 Townhouses or other attached units: $617,311
Here: $617,311 State: $657,697 In 2-unit structures: $656,094
Here: $656,094 State: $534,634 In 3-to-4-unit structures: $626,706
Here: $626,706 State: $510,239 In 5-or-more-unit structures: $569,688
Here: $569,688 State: $503,183 Mobile homes: $105,736
Here: $105,736 State: $218,362
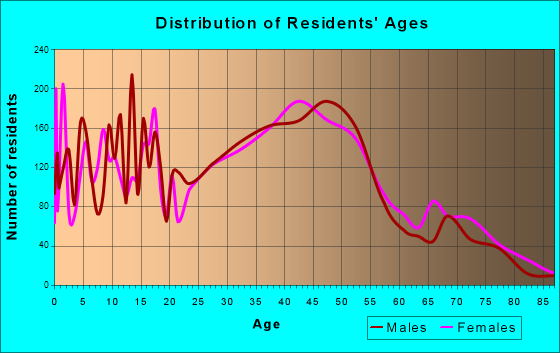
Total population: 21,839 (Urban population: 18,540, Rural population: 0)
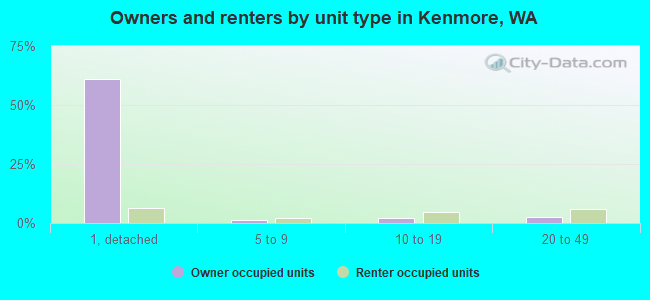
Houses: 9,889 (9,522 occupied: 6,533 owner occupied, 2,975 renter occupied)
| % of renters here: | 31% |
| State: | 36% |
Housing density: 1,604 houses/condos per square mile
Median price asked for vacant for-sale houses and condos in 2022: $2,115,317.
Median contract rent in 2022: $1,716 (lower quartile is $1,258, upper quartile is over $2,000)
Median rent asked for vacant for-rent units in 2022: $4,050
Median gross rent in Kenmore, WA in 2022: $1,818
Housing units in Kenmore with a mortgage: 4,511 (522 second mortgage, 61 home equity loan, 461 both second mortgage and home equity loan)
Houses without a mortgage: 138
Median household income for houses/condos with a mortgage: $216,597
Median household income for apartments without a mortgage: $89,007
Median monthly housing costs: $2,176
Compare current foreclosures near Kenmore, WA:
| Photo | Address | Area | Beds / Baths | Price | Details |
|---|---|---|---|---|---|

|
#1
NE 205th St
Kenmore, WA 98028
|
1,210 sq. feet
|
2 baths 3 beds |
show details | |

|
#2
58th Ln NE
Kenmore, WA 98028
|
2,700 sq. feet
|
2 baths 3 beds |
show details | |

|
#3
NE 182nd St
Kenmore, WA 98028
|
4,370 sq. feet
|
5 baths 4 beds |
show details | |

|
#4
62nd Ct NE
Kenmore, WA 98028
|
1,120 sq. feet
|
1 baths 3 beds |
show details | |

|
#5
75th Ave NE
Kenmore, WA 98028
|
1,460 sq. feet
|
2 baths 3 beds |
show details | |

|
#6
NE 200th St
Kenmore, WA 98028
|
2,110 sq. feet
|
3 baths 4 beds |
show details | |

|
#7
NE 182nd St Apt C204
Kenmore, WA 98028
|
- sq. feet
|
- baths - beds |
show details | |

|
#8
3rd Dr SE
Bothell, WA 98012
|
1,957 sq. feet
|
2 baths 4 beds |
show details | |

|
#9
100th St SW Apt B206
Everett, WA 98204
|
856 sq. feet
|
2 baths 2 beds |
show details | |

|
#10
4th Ave W Apt 6a
Everett, WA 98204
|
1,346 sq. feet
|
3 baths 2 beds |
show details |
| Photo | Address | Area | Beds / Baths | Price | Details |
|---|---|---|---|---|---|

|
#11
Rucker Ave Apt 9
Everett, WA 98201
|
879 sq. feet
|
1 baths 2 beds |
show details | |

|
#12
1st Ave S # 806
Seattle, WA 98104
|
806 sq. feet
|
1 baths 1 beds |
show details | |

|
#13
199th St SW
Bothell, WA 98012
|
2,846 sq. feet
|
2 baths 4 beds |
show details | |

|
#14
4th Ave W
Everett, WA 98204
|
1,206 sq. feet
|
2 baths 2 beds |
show details | |

|
#15
148th St SE
Everett, WA 98208
|
1,466 sq. feet
|
2 baths 3 beds |
show details | |

|
#16
E Lynn St # 98102
Seattle, WA 98102
|
792 sq. feet
|
1 baths - beds |
show details | |

|
#17
210th St SE
Snohomish, WA 98296
|
1,580 sq. feet
|
2 baths 3 beds |
show details | |

|
#18
49th Ave SE
Bothell, WA 98012
|
1,756 sq. feet
|
2 baths 3 beds |
show details | |

|
#19
NW 59th St
Seattle, WA 98107
|
1,110 sq. feet
|
1 baths 3 beds |
show details | |

|
#20
Interurban Blvd
Snohomish, WA 98296
|
1,156 sq. feet
|
1 baths 3 beds |
show details |
| Photo | Address | Area | Beds / Baths | Price | Details |
|---|---|---|---|---|---|

|
#21
91st Ave W
Edmonds, WA 98026
|
1,504 sq. feet
|
1 baths 3 beds |
show details | |

|
#22
Cascadian Way
Bothell, WA 98012
|
1,492 sq. feet
|
2 baths 3 beds |
show details | |

|
#23
NE Woodinville Duvall Rd
Woodinville, WA 98072
|
1,520 sq. feet
|
1 baths 2 beds |
show details | |

|
#24
13th Ave NW
Seattle, WA 98117
|
1,490 sq. feet
|
2 baths 3 beds |
show details | |

|
#25
20th Ave W
Lynnwood, WA 98037
|
912 sq. feet
|
1 baths 3 beds |
show details | |

|
#26
114th Ave NE
Kirkland, WA 98033
|
1,950 sq. feet
|
2 baths 4 beds |
show details | |

|
#27
1st Ave NE
Seattle, WA 98115
|
1,110 sq. feet
|
1 baths 4 beds |
show details | |

|
#28
8th Ave W
Seattle, WA 98119
|
1,400 sq. feet
|
1 baths 3 beds |
show details | |

|
#29
51st Ave NE
Seattle, WA 98115
|
2,450 sq. feet
|
2 baths 4 beds |
show details | |

|
#30
2nd Ave NW
Seattle, WA 98177
|
1,660 sq. feet
|
2 baths 3 beds |
show details |
| Photo | Address | Area | Beds / Baths | Price | Details |
|---|---|---|---|---|---|

|
#31
NE 173rd St
Woodinville, WA 98072
|
2,730 sq. feet
|
2 baths 3 beds |
show details | |

|
#32
N 161st Pl Unit A308 Aka 700 N 160th St Unit A308
Seattle, WA 98133
|
- sq. feet
|
1 baths 1 beds |
show details | |

|
#33
NE 88th St
Seattle, WA 98115
|
2,200 sq. feet
|
2 baths 3 beds |
show details | |

|
#34
67th Pl W
Mountlake Terrace, WA 98043
|
2,194 sq. feet
|
2 baths 5 beds |
show details | |

|
#35
116th Ave NE
Kirkland, WA 98033
|
1,260 sq. feet
|
2 baths 3 beds |
show details | |

|
#36
NE 134th Pl
Kirkland, WA 98034
|
2,893 sq. feet
|
3 baths 4 beds |
show details | |

|
#37
19th Dr SE
Bothell, WA 98012
|
852 sq. feet
|
1 baths 3 beds |
show details | |

|
#38
28th Dr SE
Everett, WA 98208
|
2,370 sq. feet
|
2 baths 4 beds |
show details | |

|
#39
116th St SE
Everett, WA 98208
|
1,248 sq. feet
|
2 baths 3 beds |
show details | |

|
#40
NE Madison St
Suquamish, WA 98392
|
1,040 sq. feet
|
1 baths 2 beds |
show details |
| Photo | Address | Area | Beds / Baths | Price | Details |
|---|---|---|---|---|---|

|
#41
Leonard Dr
Everett, WA 98201
|
1,000 sq. feet
|
1 baths 3 beds |
show details | |

|
#42
16th Ave SW
Seattle, WA 98106
|
970 sq. feet
|
1 baths 3 beds |
show details | |

|
#43
230th Way SE
Sammamish, WA 98075
|
3,036 sq. feet
|
3 baths 4 beds |
show details | |

|
#44
Harrison Ave
Everett, WA 98201
|
735 sq. feet
|
1 baths 2 beds |
show details | |

|
#45
S Donovan St
Seattle, WA 98108
|
1,450 sq. feet
|
2 baths 4 beds |
show details | |

|
#46
Woods Creek Rd
Monroe, WA 98272
|
2,496 sq. feet
|
2 baths 4 beds |
show details | |

|
#47
126th Pl SE
Renton, WA 98056
|
2,450 sq. feet
|
2 baths 4 beds |
show details | |

|
#48
S Sullivan St
Seattle, WA 98118
|
1,710 sq. feet
|
2 baths 3 beds |
show details | |

|
#49
320th Ave NE
Duvall, WA 98019
|
3,140 sq. feet
|
2 baths 3 beds |
show details | |

|
Check over 1 million property listings on Foreclosure.com!
|
browse all offers | |||

Latest news about housing in Kenmore, WA collected exclusively by city-data.com from local newspapers, TV, and radio stations

 | Good areas for Townhouses in W Wa (10 replies) |
| Those of you making offers on homes right now, what are you seeing? (68 replies) |
| Senior apartments around Bothell (0 replies) |
| Time to Buy a House Or Renting (20 replies) |
| Apartment complex? Kirkland? Issaquah? Anywhere else? (30 replies) |
| Relocating and looking for an affordable housing rental! (7 replies) |
Median year apartment built: 1984
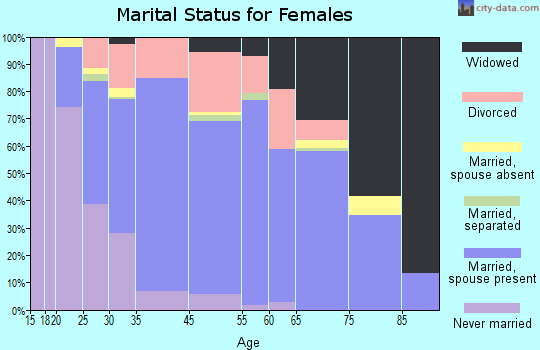
Household type by relationship:
Households: 23,741- Male householders: 5,423 (1,267 living alone), Female householders: 3,847 (1,164 living alone)
5,133 spouses (5,073 opposite-sex spouses), 732 unmarried partners, (652 opposite-sex unmarried partners), 6,750 children (6,398 natural, 167 adopted, 185 stepchildren), 49 grandchildren, 196 brothers or sisters, 190 parents, 12 foster children, 217 other relatives, 981 non-relatives
- In group quarters: 208
Size of family households: 2,465 2-persons, 1,506 3-persons, 1,459 4-persons, 403 5-persons, 168 6-persons, 3 7-or-more-persons.
Size of nonfamily households: 2,615 1-person, 659 2-persons, 44 3-persons, 64 5-persons, 39 6-persons.
3,983 married couples with children.
784 single-parent households (357 men, 427 women).
72.2% of residents of Kenmore speak English at home.
5.1% of residents speak Spanish at home (52% speak English very well, 29% speak English well, 16% speak English not well, 2% don't speak English at all).
8.1% of residents speak other Indo-European language at home (78% speak English very well, 10% speak English well, 6% speak English not well, 6% don't speak English at all).
11.1% of residents speak Asian or Pacific Island language at home (58% speak English very well, 30% speak English well, 7% speak English not well, 5% don't speak English at all).
3.2% of residents speak other language at home (81% speak English very well, 19% speak English well).
Foreign born population: 5,269 (22.2%)
(58.7% of them are naturalized citizens)
| Here: | 6.8 |
| State: | 6.5 |
| Here: | 3.9 |
| State: | 3.9 |
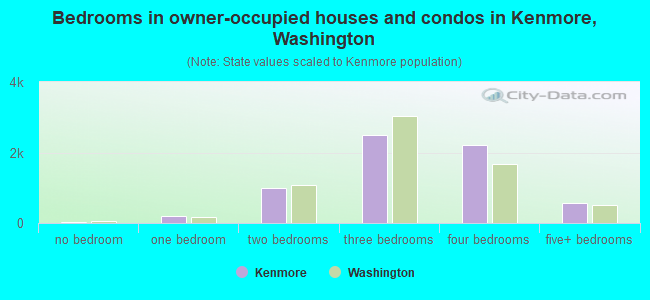
- Bedrooms in owner-occupied houses and condos in Kenmore, Washington
- 29no bedroom
- 2081 bedroom
- 1,0042 bedrooms
- 2,5083 bedrooms
- 2,2054 bedrooms
- 5805+ bedrooms
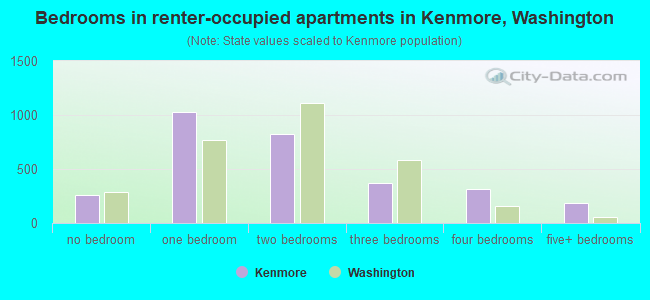
- Bedrooms in renter-occupied apartments in Kenmore, Washington
- 258no bedroom
- 1,0251 bedroom
- 8252 bedrooms
- 3723 bedrooms
- 3114 bedrooms
- 1845+ bedrooms
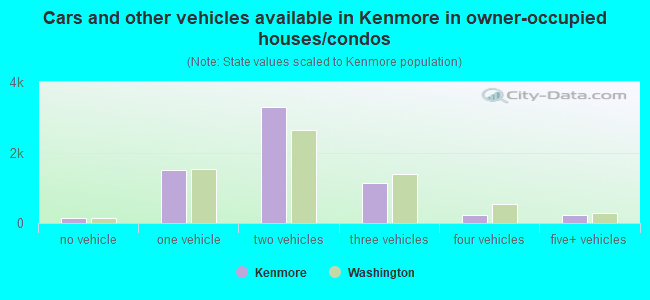
- Cars and other vehicles available in Kenmore in owner-occupied houses/condos
- 142no vehicle
- 1,5151 vehicle
- 3,2992 vehicles
- 1,1383 vehicles
- 2184 vehicles
- 2225+ vehicles
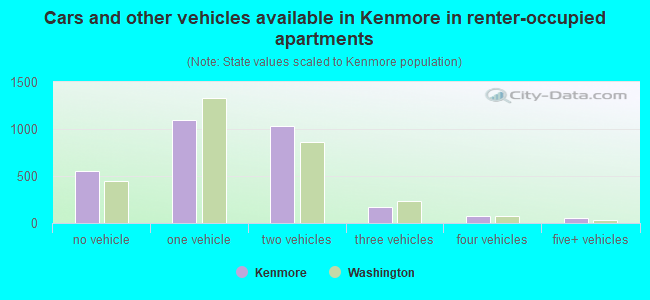
- Cars and other vehicles available in Kenmore in renter-occupied apartments
- 550no vehicle
- 1,0921 vehicle
- 1,0322 vehicles
- 1653 vehicles
- 794 vehicles
- 575+ vehicles
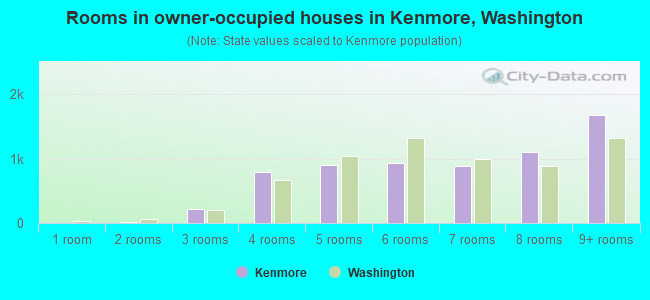
- Rooms in owner-occupied houses in Kenmore, Washington
- 71 room
- 82 rooms
- 2243 rooms
- 7964 rooms
- 9045 rooms
- 9326 rooms
- 8877 rooms
- 1,0978 rooms
- 1,6789+ rooms
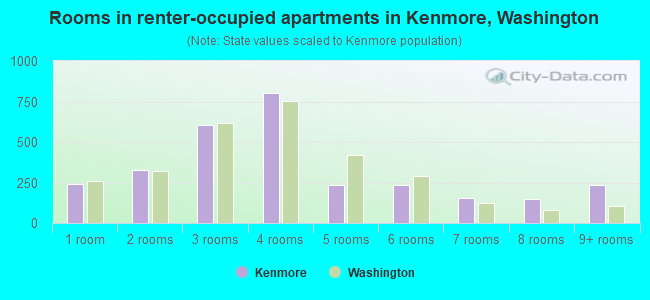
- Rooms in renter-occupied apartments in Kenmore, Washington
- 2421 room
- 3252 rooms
- 6033 rooms
- 8024 rooms
- 2325 rooms
- 2376 rooms
- 1537 rooms
- 1468 rooms
- 2349+ rooms
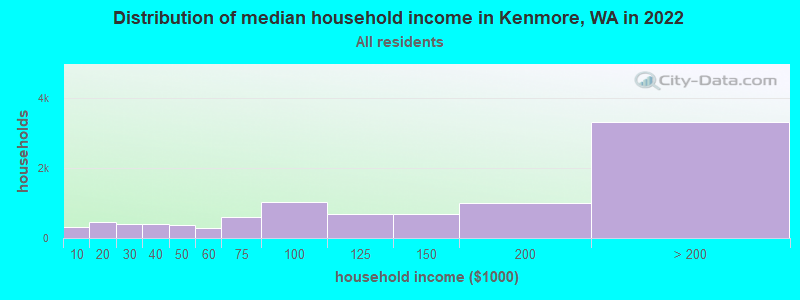
Kenmore, WA household income distribution

- 325Less than $10,000
- 466$10,000 to $19,999
- 399$20,000 to $29,999
- 408$30,000 to $39,999
- 375$40,000 to $49,999
- 298$50,000 to $59,999
- 599$60,000 to $74,999
- 1,020$75,000 to $99,999
- 673$100,000 to $124,999
- 677$125,000 to $149,999
- 989$150,000 to $199,999
- 3,318$200,000 or more
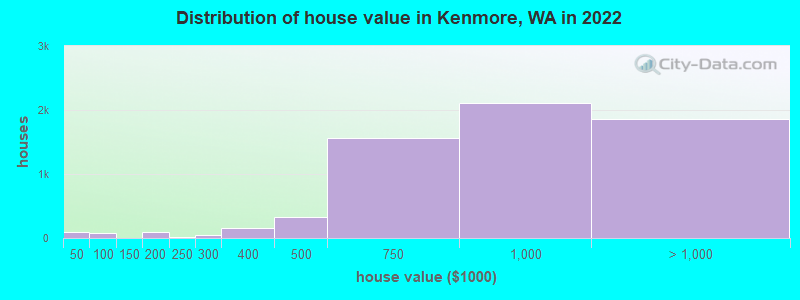
Home value of owner - occupied houses in 2022 in Kenmore, WA
-
- 40Less than $10,000
- 6$20,000 to $24,999
- 5$25,000 to $29,999
- 18$30,000 to $34,999
- 9$35,000 to $39,999
- 13$40,000 to $49,999
- 14$50,000 to $59,999
- 11$60,000 to $69,999
- 36$90,000 to $99,999
- 80$150,000 to $174,999
- 5$175,000 to $199,999
- 14$200,000 to $249,999
- 52$250,000 to $299,999
- 154$300,000 to $399,999
- 327$400,000 to $499,999
- 1,568$500,000 to $749,999
- 2,112$750,000 to $999,999
- 1,327$1,000,000 to $1,499,999
- 175$1,500,000 to $1,999,999
- 354$2,000,000 or more
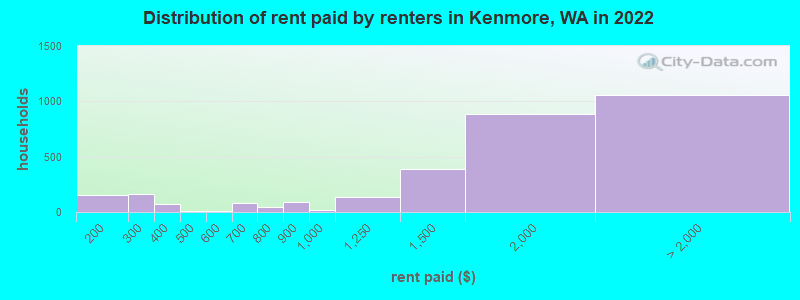
Rent paid by renters in 2022 in Kenmore, WA
-
- 153$150 to $199
- 163$250 to $299
- 72$300 to $349
- 8$450 to $499
- 9$550 to $599
- 65$600 to $649
- 14$650 to $699
- 36$700 to $749
- 8$750 to $799
- 93$800 to $899
- 16$900 to $999
- 137$1,000 to $1,249
- 389$1,250 to $1,499
- 883$1,500 to $1,999
- 328$2,000 to $2,499
- 261$2,500 to $2,999
- 180$3,000 to $3,499
- 269$3,500 or more
- 14No cash rent
Percentage of workers working in this county: 90.5%
Number of people working at home: 4,473 (34.6% of all workers)
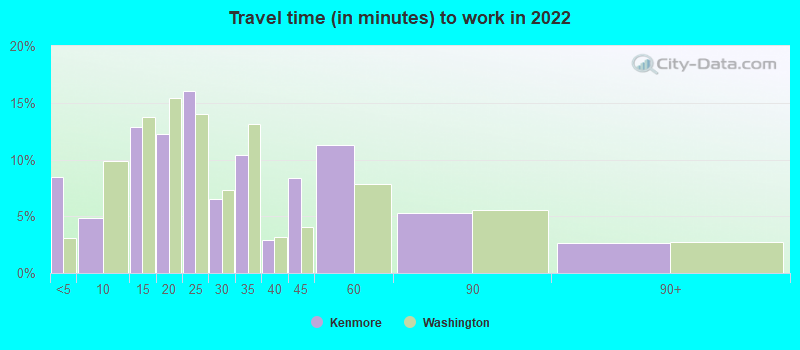
Travel time to work (commute)
- Less than 5 minutes: 293
- 5 to 9 minutes: 257
- 10 to 14 minutes: 623
- 15 to 19 minutes: 829
- 20 to 24 minutes: 1,249
- 25 to 29 minutes: 1,087
- 30 to 34 minutes: 1,317
- 35 to 39 minutes: 243
- 40 to 44 minutes: 676
- 45 to 59 minutes: 993
- 60 to 89 minutes: 758
- 90 or more minutes: 166
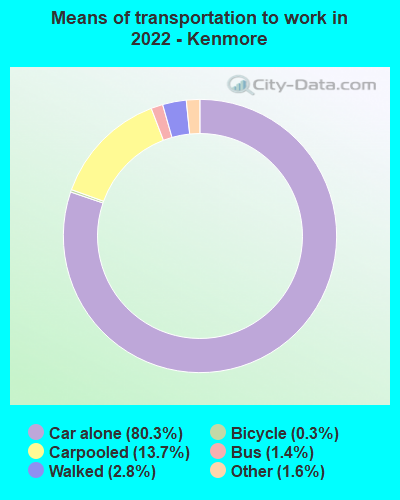
Means of transportation to work:
- Drove a car alone: 3,449 (44.5%)
- Carpooled: 563 (7.3%)
- Bus: 35 (0.5%)
- Taxi: 63 (0.8%)
- Bicycle: 10 (0.1%)
- Walked: 107 (1.4%)
- Worked at home: 4,473 (57.7%)
- Unemployment by race in 2022
- Unemployment rate for White non-Hispanic residents
- 2.4%Males
- 1.6%Females
- Unemployment rate for Black residents
- 19.9%Males
- Unemployment rate for American Indian and Alaska Native residents
- 11.9%Males
- Unemployment rate for Asian residents
- 2.1%Males
- 3.1%Females
- Unemployment rate for other race residents
- 6.1%Females
- Unemployment rate for two or more race residents
- 8.4%Females
- Unemployment rate for Hispanic or Latino residents
- 1.2%Males
- 18.9%Females
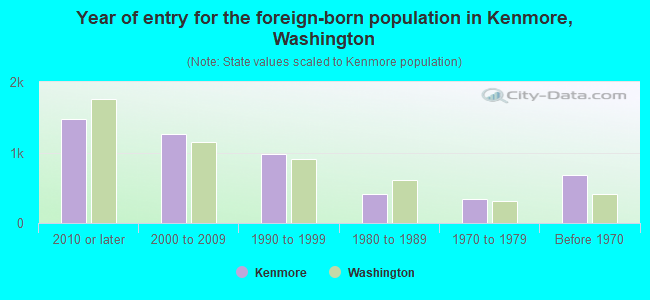
- Year of entry for the foreign-born population in Kenmore, Washington
- 1,4762010 or later
- 1,2642000 to 2009
- 9851990 to 1999
- 4091980 to 1989
- 3411970 to 1979
- 677Before 1970
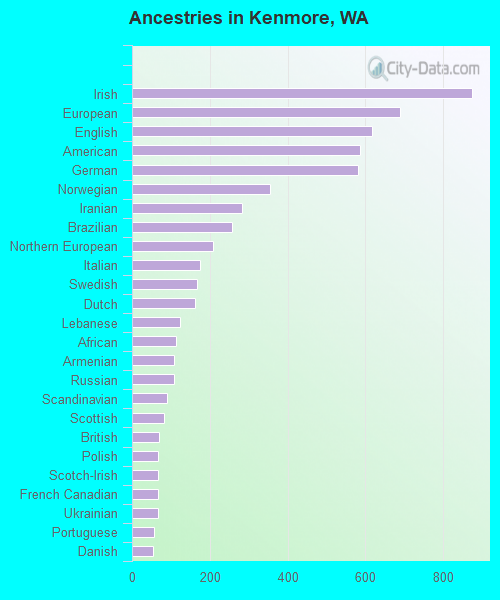
First ancestries reported:
- Irish: 874 (7.6%)
- European: 690 (6.0%)
- English: 616 (5.4%)
- American: 586 (5.1%)
- German: 582 (5.1%)
- Norwegian: 356 (3.1%)
- Iranian: 282 (2.5%)
- Brazilian: 256 (2.2%)
- Northern European: 208 (1.8%)
- Italian: 175 (1.5%)
- Swedish: 168 (1.5%)
- Dutch: 161 (1.4%)
- Lebanese: 123 (1.1%)
- African: 114 (1.0%)
- Armenian: 109 (0.9%)
- Russian: 107 (0.9%)
- Scandinavian: 90 (0.8%)
- Scottish: 82 (0.7%)
- British: 70 (0.6%)
- Polish: 68 (0.6%)
- Scotch-Irish: 67 (0.6%)
- French Canadian: 66 (0.6%)
- Ukrainian: 66 (0.6%)
- Portuguese: 56 (0.5%)
- Danish: 54 (0.5%)
- Canadian: 46 (0.4%)
- Albanian: 43 (0.4%)
- Ethiopian: 43 (0.4%)
- Icelander: 41 (0.4%)
- Bulgarian: 35 (0.3%)
- French: 28 (0.2%)
- Finnish: 27 (0.2%)
- Afghan: 21 (0.2%)
- Swiss: 19 (0.2%)
- Welsh: 18 (0.2%)
- Turkish: 11 (0.10%)
- Belgian: 10 (0.09%)
- Czech: 9 (0.08%)
- Hungarian: 7 (0.06%)
- Eastern European: 7 (0.06%)
- Lithuanian: 3 (0.03%)
- West Indian: 3 (0.03%)
Most common places of birth for foreign-born residents (%):
| Kenmore: | 11.1% (586) |
| Washington: | 7.4% (84,470) |
| Kenmore: | 9.3% (492) |
| Washington: | 21.1% (241,655) |
| Kenmore: | 8.3% (436) |
| Washington: | 4.3% (48,886) |
| Kenmore: | 6.5% (343) |
| Washington: | 0.8% (9,359) |
| Kenmore: | 6.1% (321) |
| Washington: | 1.5% (16,607) |
| Kenmore: | 5.6% (293) |
| Washington: | 4.1% (47,238) |
| Kenmore: | 5.5% (290) |
| Washington: | 1.1% (12,735) |
| Kenmore: | 4.2% (219) |
| Washington: | 6.3% (71,661) |
| Kenmore: | 3.9% (204) |
| Washington: | 8.9% (101,353) |
| Kenmore: | 3.5% (187) |
| Washington: | 0.1% (802) |
| Kenmore: | 2.3% (120) |
| Washington: | 0.9% (10,499) |
| Kenmore: | 2.3% (120) |
| Washington: | 5.4% (62,003) |
| Kenmore: | 2.0% (106) |
| Washington: | 1.9% (21,540) |
| Kenmore: | 1.8% (95) |
| Washington: | 0.3% (3,414) |
| Kenmore: | 1.6% (86) |
| Washington: | 0.8% (8,785) |
| Kenmore: | 1.6% (83) |
| Washington: | 0.1% (652) |
| Kenmore: | 1.5% (80) |
| Washington: | 0.2% (2,812) |
Place of birth for U.S.-born residents:
- This state: 10,071
- Other state: 7,967
- Northeast: 1,417
- Midwest: 1,870
- South: 953
- West: 3,731
88.0% of Kenmore residents lived in the same house 1 years ago.
Out of people who lived in different houses, 37.7% lived in this county.
Out of people who lived in different counties, 51.0% lived in Washington.
| Kenmore: | 88.0% |
| State average: | 85.2% |
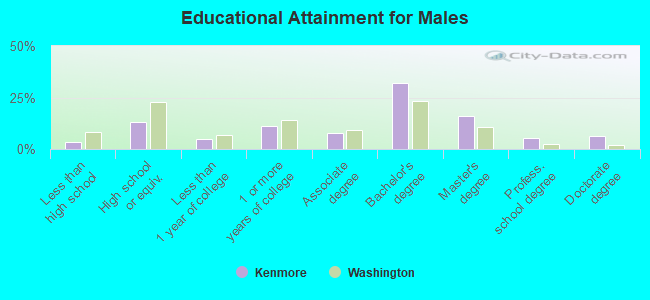
Education attainment for males 25 years and older:
- No schooling: 93
- Nursery to 4th grade: 50
- 5th and 6th grade: 19
- 7th and 8th grade: 10
- 9th grade: 19
- 10th grade: 18
- 11th grade: 13
- 12th grade, no diploma: 67
- High school graduate (or equivalency): 1,165
- Less than 1 year of college: 438
- Some college more than 1 year, no degree: 993
- Associate degree: 713
- Bachelor's degree: 2,903
- Master's degree: 1,453
- Professional school degree: 482
- Doctorate degree: 573
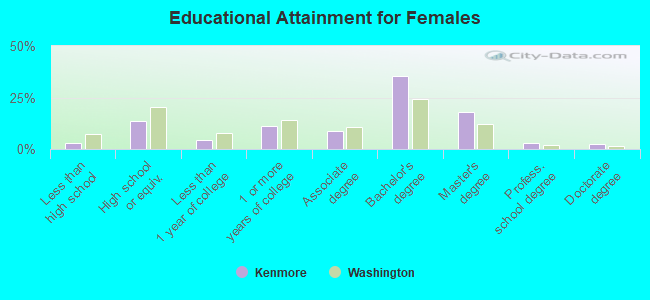
Education attainment for females 25 years and older:
- No schooling: 100
- Nursery to 4th grade: 0
- 5th and 6th grade: 60
- 7th and 8th grade: 12
- 9th grade: 14
- 10th grade: 16
- 11th grade: 27
- 12th grade, no diploma: 19
- High school graduate (or equivalency): 1,134
- Less than 1 year of college: 374
- Some college more than 1 year, no degree: 958
- Associate degree: 753
- Bachelor's degree: 3,021
- Master's degree: 1,510
- Professional school degree: 256
- Doctorate degree: 218
Housing units in structures:
- One, detached: 6,261
- One, attached: 374
- Two: 68
- 3 or 4: 270
- 5 to 9: 316
- 10 to 19: 578
- 20 to 49: 1,110
- 50 or more: 644
- Mobile homes: 264
Median worth of mobile homes: $41,715
Housing units lacking complete kitchen facilities in 2022: 2.8%
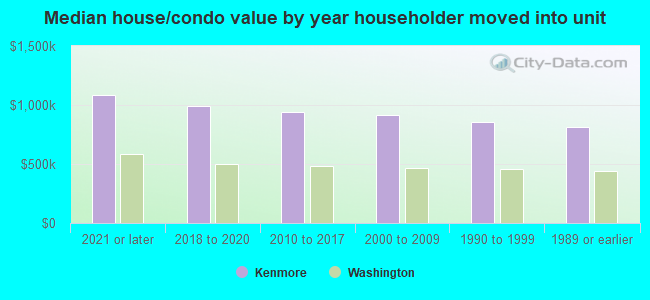
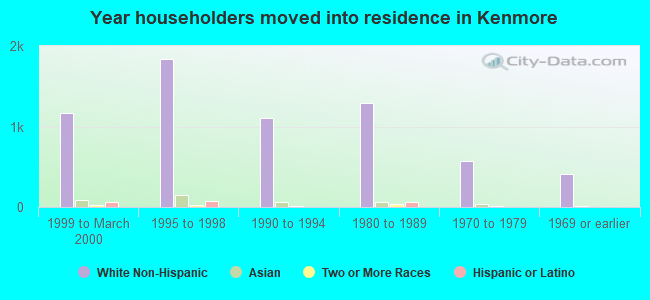
House/condo owner moved in on average 13 years ago
Renter moved in on average 5 years ago
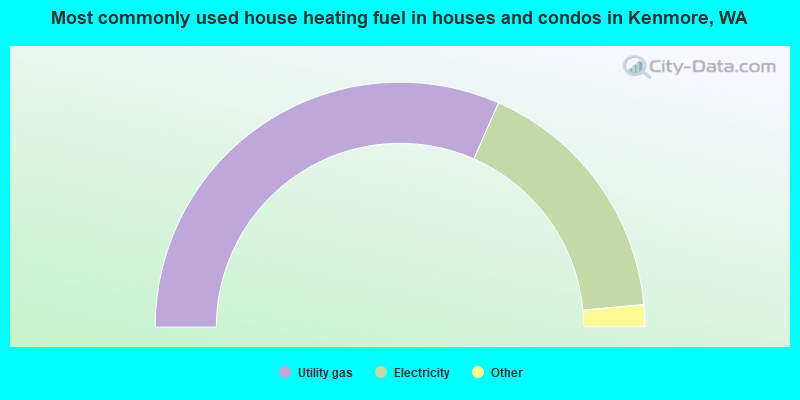
- 63.2%Utility gas
- 33.9%Electricity
- 2.0%Fuel oil, kerosene, etc.
- 0.6%Wood
- 0.3%Bottled, tank, or LP gas
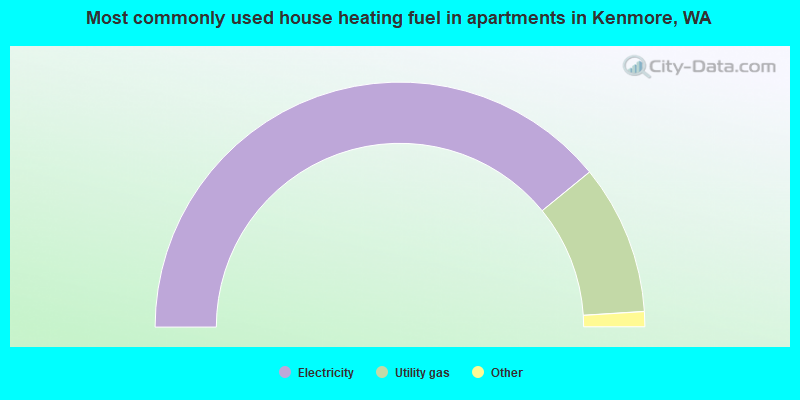
- 78.2%Electricity
- 19.8%Utility gas
- 1.8%Bottled, tank, or LP gas
- 0.2%Solar energy
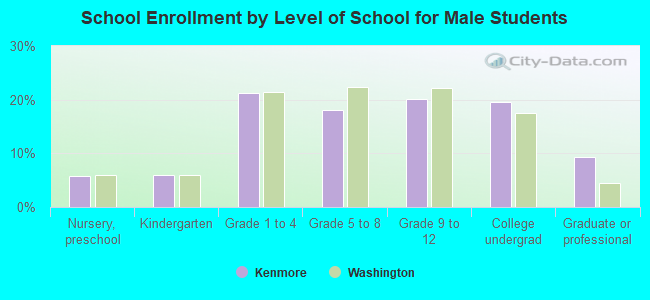
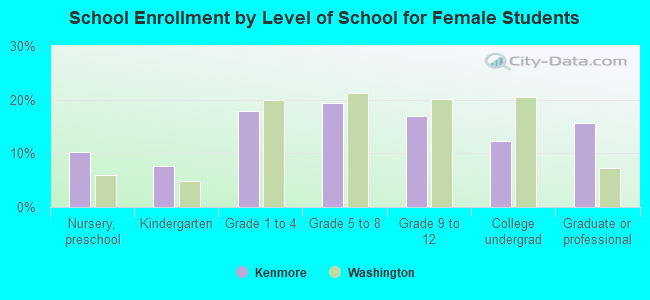
Private vs. public school enrollment:
| Here: | 9.1% |
| Washington: | 12.4% |
| Here: | 6.6% |
| Washington: | 9.2% |
| Here: | 24.0% |
| Washington: | 16.5% |