Kirkmansville, KY (Kentucky) Houses and Residents
| Kirkmansville: | $115,870 |
| Kentucky: | $196,300 |
Total population: 2,934 (Urban population: 0, Rural population: 2,919 (494 farm, 2,425 nonfarm))
Houses: 1,317 (1,128 occupied: 941 owner occupied, 187 renter occupied)
| % of renters here: | 17% |
| State: | 31% |
Housing density: 10 houses/condos per square mile
Median price asked for vacant for-sale houses and condos in 2022 in this county: $85,143.
Median contract rent in 2022: $519 (lower quartile is $303, upper quartile is $679)
Median rent asked for vacant for-rent units in 2022: $469
Median gross rent in Kirkmansville, KY in 2022: $845
Housing units in Kirkmansville with a mortgage: 194 (13 second mortgage, 0 home equity loan, 0 both second mortgage and home equity loan)
Houses without a mortgage: 228


Household type by relationship:
Households: 12,265- In family households: 10,750 (2,397 male householders, 957 female householders)
2,542 spouses, 3,896 children (3,566 natural, 67 adopted, 263 stepchildren), 350 grandchildren, 90 brothers or sisters, 72 parents, foster children, 122 other relatives, 257 non-relatives
- In nonfamily households: 1,515 (595 male householders (491 living alone)), 698 female householders (638 living alone)), 222 nonrelatives
- In group quarters: 195 (all institutionalized)
2,253 married couples with children.
633 single-parent households (130 men, 503 women).
99.1% of residents of Kirkmansville speak English at home.
0.7% of residents speak Spanish at home (68% speak English very well, 32% don't speak English at all).
0.2% of residents speak other Indo-European language at home (100% speak English very well).
Foreign born population: 14 (0.5%)
(0.0% of them are naturalized citizens)
| Here: | 6.4 |
| State: | 6.4 |
| Here: | 6.2 |
| State: | 4.4 |

- Bedrooms in owner-occupied houses and condos in Kirkmansville, Kentucky
- 0no bedroom
- 361 bedroom
- 2442 bedrooms
- 5443 bedrooms
- 924 bedrooms
- 255+ bedrooms

- Bedrooms in renter-occupied apartments in Kirkmansville, Kentucky
- 0no bedroom
- 71 bedroom
- 622 bedrooms
- 1073 bedrooms
- 114 bedrooms
- 05+ bedrooms

- Cars and other vehicles available in Kirkmansville in owner-occupied houses/condos
- 76no vehicle
- 1901 vehicle
- 3982 vehicles
- 1793 vehicles
- 844 vehicles
- 145+ vehicles

- Cars and other vehicles available in Kirkmansville in renter-occupied apartments
- 42no vehicle
- 711 vehicle
- 562 vehicles
- 183 vehicles
- 04 vehicles
- 05+ vehicles

- Rooms in owner-occupied houses in Kirkmansville, Kentucky
- 01 room
- 02 rooms
- 233 rooms
- 1434 rooms
- 2905 rooms
- 2546 rooms
- 937 rooms
- 788 rooms
- 609+ rooms

- Rooms in renter-occupied apartments in Kirkmansville, Kentucky
- 01 room
- 02 rooms
- 03 rooms
- 574 rooms
- 555 rooms
- 536 rooms
- 57 rooms
- 178 rooms
- 09+ rooms


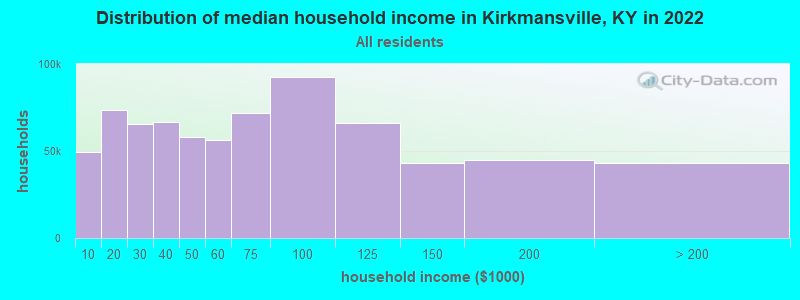
Kirkmansville, KY household income distribution

- 42,950Less than $10,000
- 69,683$10,000 to $19,999
- 58,718$20,000 to $29,999
- 62,210$30,000 to $39,999
- 47,539$40,000 to $49,999
- 52,229$50,000 to $59,999
- 59,918$60,000 to $74,999
- 83,038$75,000 to $99,999
- 59,340$100,000 to $124,999
- 36,410$125,000 to $149,999
- 36,086$150,000 to $199,999
- 31,021$200,000 or more
Percentage of workers working in this county: 51.6%
Number of people working at home: 123 (8.6% of all workers)
Travel time to work (commute)
- Less than 5 minutes: 50
- 5 to 9 minutes: 63
- 10 to 14 minutes: 62
- 15 to 19 minutes: 196
- 20 to 24 minutes: 237
- 25 to 29 minutes: 121
- 30 to 34 minutes: 259
- 35 to 39 minutes: 49
- 40 to 44 minutes: 65
- 45 to 59 minutes: 156
- 60 to 89 minutes: 20
- 90 or more minutes: 26
Means of transportation to work:
- Drove a car alone: 1,025 (74.1%)
- Carpooled: 265 (19.2%)
- Walked: 5 (0.4%)
- Other means: 9 (0.7%)
- Worked at home: 79 (5.7%)


- Year of entry for the foreign-born population in Kirkmansville, Kentucky
- 01995 to March 2000
- 01990 to 1994
- 01985 to 1989
- 01980 to 1984
- 01975 to 1979
- 01970 to 1974
- 01965 to 1969
- 8Before 1965
Most common places of birth for foreign-born residents (%):
| Kirkmansville: | 100.0% (8) |
| Kentucky: | 0.8% (623) |
Place of birth for U.S.-born residents:
- This state: 2,466
- Other state: 428
- Northeast: 12
- Midwest: 178
- South: 194
- West: 44
68% of Kirkmansville residents lived in the same house 5 years ago.
Out of people who lived in different houses, 62% lived in this county.
Out of people who lived in different counties, 77% lived in Kentucky.
Education attainment for males 25 years and older:
- No schooling: 0
- Nursery to 4th grade: 24
- 5th and 6th grade: 51
- 7th and 8th grade: 179
- 9th grade: 47
- 10th grade: 71
- 11th grade: 43
- 12th grade, no diploma: 20
- High school graduate (or equivalency): 382
- Less than 1 year of college: 36
- Some college more than 1 year, no degree: 51
- Associate degree: 24
- Bachelor's degree: 22
- Master's degree: 11
- Professional school degree: 0
- Doctorate degree: 0

Education attainment for females 25 years and older:
- No schooling: 36
- Nursery to 4th grade: 5
- 5th and 6th grade: 44
- 7th and 8th grade: 165
- 9th grade: 41
- 10th grade: 78
- 11th grade: 0
- 12th grade, no diploma: 10
- High school graduate (or equivalency): 416
- Less than 1 year of college: 55
- Some college more than 1 year, no degree: 59
- Associate degree: 33
- Bachelor's degree: 28
- Master's degree: 33
- Professional school degree: 0
- Doctorate degree: 0


Housing units in structures:
- One, detached: 920
- One, attached: 7
- 5 to 9: 6
- Mobile homes: 384
Median worth of mobile homes: $72,018
Housing units lacking complete kitchen facilities: 4.2%

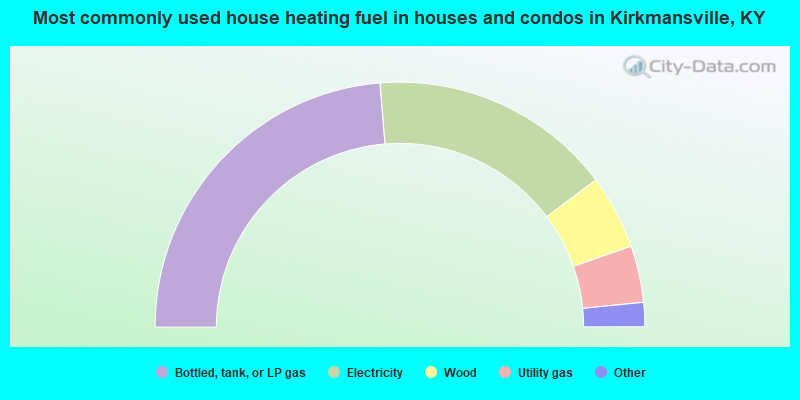
- 47.4%Bottled, tank, or LP gas
- 32.1%Electricity
- 9.8%Wood
- 7.5%Utility gas
- 1.5%Coal or coke
- 1.2%Fuel oil, kerosene, etc.
- 0.5%No fuel used
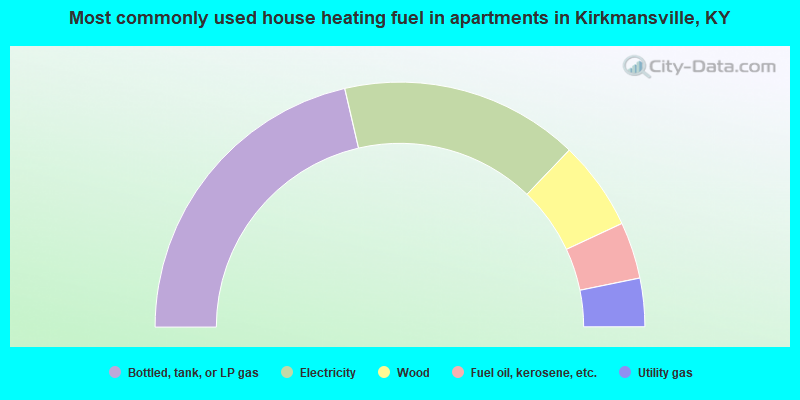
- 42.8%Bottled, tank, or LP gas
- 31.6%Electricity
- 11.8%Wood
- 7.5%Fuel oil, kerosene, etc.
- 6.4%Utility gas
Private vs. public school enrollment:
| Here: | 1.4% |
| Kentucky: | 11.9% |
| Here: | 0.0% |
| Kentucky: | 10.6% |
| Here: | 9.2% |
| Kentucky: | 18.1% |


