Kokomo, IN (Indiana) Houses and Residents
Estimated median house or condo value in 2022: $130,976 (it was $72,800 in 2000 )
Kokomo:
$130,976Indiana:
$208,700
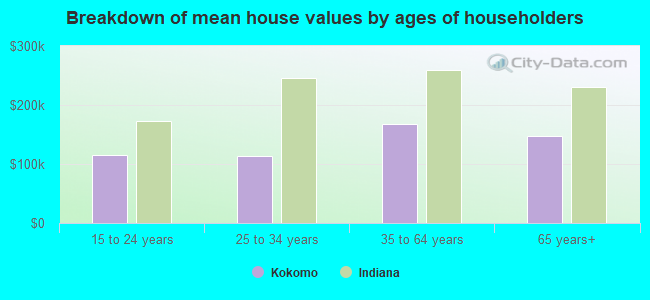
Lower value quartile - upper value quartile: $83,282 - $186,422Mean price in 2022: Detached houses: $181,094 Here:
$181,094State:
$257,916
Townhouses or other attached units: $180,136 Here:
$180,136State:
$224,114
In 2-unit structures: $104,552 Here:
$104,552State:
$175,375
In 3-to-4-unit structures: $120,074 Here:
$120,074State:
$151,116
In 5-or-more-unit structures: $237,695 Here:
$237,695State:
$200,844
Mobile homes: $35,304 Here:
$35,304State:
$67,116
Total population: 57,085 (Urban population: 45,947, Rural population: 20 (all nonfarm) )
Houses: 30,113 (26,262 occupied: 17,301 owner occupied, 9,357 renter occupied )
% of renters here:
35%State:
29%
Housing density: 1,859 houses/condos per square mile
Median price asked for vacant for-sale houses and condos in 2022: $85,416.
Median contract rent in 2022: $702 (lower quartile is $535, upper quartile is $793)
Median rent asked for vacant for-rent units in 2022: $2,318
Median gross rent in Kokomo, IN in 2022: $857
Housing units in Kokomo with a mortgage: 10,915 (1,012 second mortgage, 52 home equity loan, 662 both second mortgage and home equity loan )Houses without a mortgage: 293
Median household income for houses/condos with a mortgage: $65,836
Median household income for apartments without a mortgage: $47,017
Median monthly housing costs: $772
Data:
Median house or condo value ($)
Median house or condo value ($ change since 2000)
Median house or condo value ($) - White
Median house or condo value ($) - Black or African American
Median house or condo value ($) - Asian
Median house or condo value ($) - Hispanic or Latino
Median house or condo value ($) - American Indian and Alaska Native
Median house or condo value ($) - Multirace
Median house or condo value ($) - Other Race
Median price asked for mobile homes ($)
Household density (households per square mile)
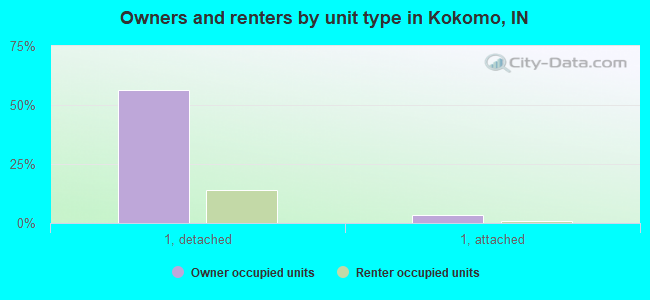
Mean house or condo value by units in structure - 1, detached ($)
Mean house or condo value by units in structure - 1, attached ($)
Mean house or condo value by units in structure - 2 ($)
Mean house or condo value by units in structure by units in structure - 3 or 4 ($)
Mean house or condo value by units in structure - 5 or more ($)
Mean house or condo value by units in structure - Boat, RV, van, etc. ($)
Mean house or condo value by units in structure - Mobile home ($)
Median contract rent ($)
Median contract rent - Lower quartile ($)
Median contract rent - Upper quartile ($)
Median gross rent ($)
Urban houses (%)
Rural houses (%)
Houses occupied (%)
Houses occupied (% change since 2000)
Houses owner occupied (%)
Houses owner occupied (% change since 2000)
Houses renter occupied (%)
Houses renter occupied (% change since 2000)
Vacant housing units - For rent (%)
Vacant housing units - For rent (% change since 2000)
Vacant housing units - For sale only (%)
Vacant housing units - For sale only (% change since 2000)
Vacant housing units - Rented or sold, not occupied (%)
Vacant housing units - Rented or sold, not occupied (% change since 2000)
Vacant housing units - For seasonal, recreational, or occasional use (%)
Vacant housing units - For seasonal, recreational, or occasional use (% change since 2000)
Vacant housing units - For migrant workers (%)
Vacant housing units - For migrant workers (% change since 2000)
Vacant housing units - Other vacant (%)
Vacant housing units - Other vacant (% change since 2000)
Median monthly housing costs ($)
Median household income for houses/condos with a mortgage ($)
Median household income for houses/condos without a mortgage ($)
Median household income ($)
Median household income ($) - White
Median household income ($) - Black or African American
Median household income ($) - Asian
Median household income ($) - Hispanic or Latino
Median household income ($) - American Indian and Alaska Native
Median household income ($) - Multirace
Median household income ($) - Other Race
Mortgage status - with mortgage (%)
Mortgage status - with second mortgage (%)
Mortgage status - with home equity loan (%)
Mortgage status - with both second mortgage and home equity loan (%)
Mortgage status - without a mortgage (%)
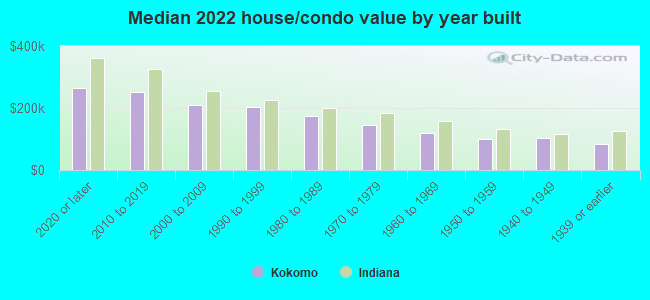
Median year house/condo built
Median year apartment built
Household type by relationship - Male householder living alone (%)
Household type by relationship - Male householder not living alone (%)
Household type by relationship - Female householder living alone (%)
Household type by relationship - Female householder not living alone (%)
Household type by relationship - Opposite-Sex spouse (%)
Household type by relationship - Same-Sex spouse (%)
Household type by relationship - Opposite-Sex unmarried partner (%)
Household type by relationship - Same-Sex unmarried partner (%)
Household type by relationship - In group quarters (%)
Size of family households - 2-person household (%)
Size of family households - 3-person household (%)
Size of family households - 4-person household (%)
Size of family households - 5-person household (%)
Size of family households - 6-person household (%)
Size of family households - 7-or-more-person household (%)
Size of nonfamily households - 1-person household (%)
Size of nonfamily households - 2-person household (%)
Size of nonfamily households - 3-person household (%)
Size of nonfamily households - 4-person household (%)
Size of nonfamily households - 5-person household (%)
Size of nonfamily households - 6-person household (%)
Size of nonfamily households - 7-or-moreperson household (%)
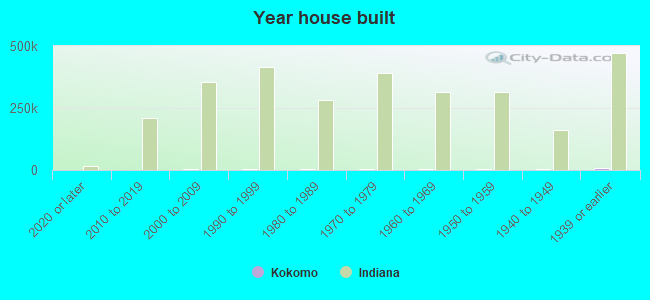
Year house built - Built 2010 or later (%)
Year house built - Built 2000 to 2009 (%)
Year house built - Built 1990 to 1999 (%)
Year house built - Built 1980 to 1989 (%)
Year house built - Built 1970 to 1979 (%)
Year house built - Built 1960 to 1969 (%)
Year house built - Built 1950 to 1959 (%)
Year house built - Built 1940 to 1949 (%)
Year house built - Built 1939 or earlier (%)
Median number of rooms in houses and condos
Median number of rooms in apartments
Median number of bedrooms in owner occupied houses
Mean number of bedrooms in owner occupied houses
Median number of bedrooms in renter occupied houses
Mean number of bedrooms in renter occupied houses
Median number of vehichles in owner occupied houses
Mean number of vehichles in owner occupied houses
Median number of vehichles in renter occupied houses
Mean number of vehichles in renter occupied houses
Rooms in owner-occupied houses - 1 room (%)
Rooms in owner-occupied houses - 2 rooms (%)
Rooms in owner-occupied houses - 3 rooms (%)
Rooms in owner-occupied houses - 4 rooms (%)
Rooms in owner-occupied houses - 5 rooms (%)
Rooms in owner-occupied houses - 6 rooms (%)
Rooms in owner-occupied houses - 7 rooms (%)
Rooms in owner-occupied houses - 8 rooms (%)
Rooms in owner-occupied houses - 9+ rooms (%)
Rooms in renter-occupied houses - 1 room (%)
Rooms in renter-occupied houses - 2 rooms (%)
Rooms in renter-occupied houses - 3 rooms (%)
Rooms in renter-occupied houses - 4 rooms (%)
Rooms in renter-occupied houses - 5 rooms (%)
Rooms in renter-occupied houses - 6 rooms (%)
Rooms in renter-occupied houses - 7 rooms (%)
Rooms in renter-occupied houses - 8 rooms (%)
Rooms in renter-occupied houses - 9+ rooms (%)
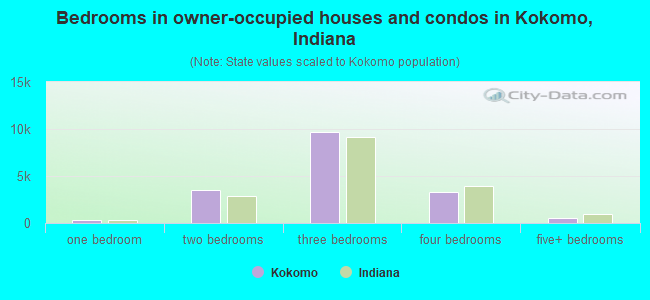
Bedrooms in owner-occupied houses - no bedrooms (%)
Bedrooms in owner-occupied houses - 1 bedroom (%)
Bedrooms in owner-occupied houses - 2 bedrooms (%)
Bedrooms in owner-occupied houses - 3 bedrooms (%)
Bedrooms in owner-occupied houses - 4 bedrooms (%)
Bedrooms in owner-occupied houses - 5+ bedrooms (%)
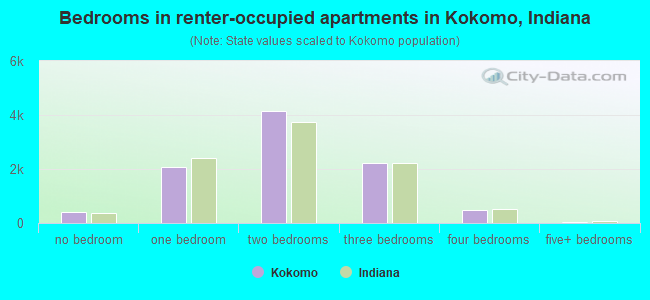
Bedrooms in renter-occupied houses - no bedrooms (%)
Bedrooms in renter-occupied houses - 1 bedroom (%)
Bedrooms in renter-occupied houses - 2 bedrooms (%)
Bedrooms in renter-occupied houses - 3 bedrooms (%)
Bedrooms in renter-occupied houses - 4 bedrooms (%)
Bedrooms in renter-occupied houses - 5+ bedrooms (%)
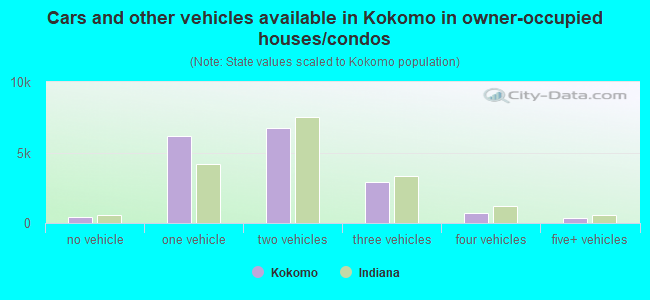
Vehicles available in owner-occupied houses - no vehicle available (%)
Vehicles available in owner-occupied houses - 1 vehicle available(%)
Vehicles available in owner-occupied houses - 2 Vehicles available (%)
Vehicles available in owner-occupied houses - 3 Vehicles available (%)
Vehicles available in owner-occupied houses - 4 Vehicles available (%)
Vehicles available in owner-occupied houses - 5+ Vehicles available (%)
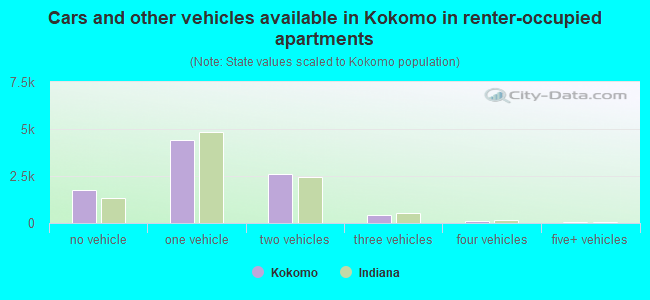
Vehicles available in renter-occupied houses - no vehicle available (%)
Vehicles available in renter-occupied houses - 1 vehicle available (%)
Vehicles available in renter-occupied houses - 2 Vehicles available (%)
Vehicles available in renter-occupied houses - 3 Vehicles available (%)
Vehicles available in renter-occupied houses - 4 Vehicles available (%)
Vehicles available in renter-occupied houses - 5+ Vehicles available (%)
Housing units in structures - 1, detached (%)
Housing units in structures - 1, attached (%)
Housing units in structures - 2 (%)
Housing units in structures - 3 or 4 (%)
Housing units in structures - 5 to 9 (%)
Housing units in structures - 10 to 19 (%)
Housing units in structures - 20 to 49 (%)
Housing units in structures - 50 or more (%)
Housing units in structures - Mobile home (%)
Housing units in structures - Boat, RV, van, etc. (%)
Housing units in structures - Owners - 1, detached (%)
Housing units in structures - Owners - 1, attached (%)
Housing units in structures - Owners - 2 (%)
Housing units in structures - Owners - 3 or 4 (%)
Housing units in structures - Owners - 5 to 9 (%)
Housing units in structures - Owners - 10 to 19 (%)
Housing units in structures - Owners - 20 to 49 (%)
Housing units in structures - Owners - 50 or more (%)
Housing units in structures - Owners - Mobile home (%)
Housing units in structures - Owners - Boat, RV, van, etc. (%)
Housing units in structures - Renters - 1, detached (%)
Housing units in structures - Renters - 1, attached (%)
Housing units in structures - Renters - 2 (%)
Housing units in structures - Renters - 3 or 4 (%)
Housing units in structures - Renters - 5 to 9 (%)
Housing units in structures - Renters - 10 to 19 (%)
Housing units in structures - Renters - 20 to 49 (%)
Housing units in structures - Renters - 50 or more (%)
Housing units in structures - Renters - Mobile home (%)
Housing units in structures - Renters - Boat, RV, van, etc. (%)
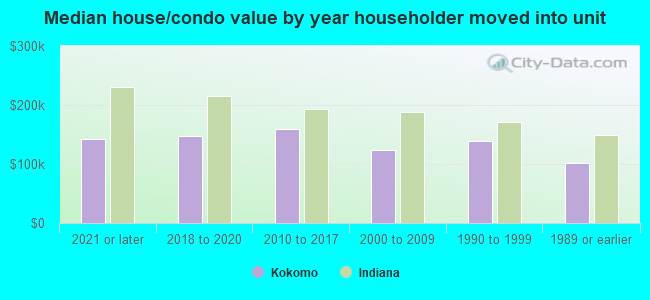
House/condo owner moved in on average (years ago)
Renter moved in on average (years ago)
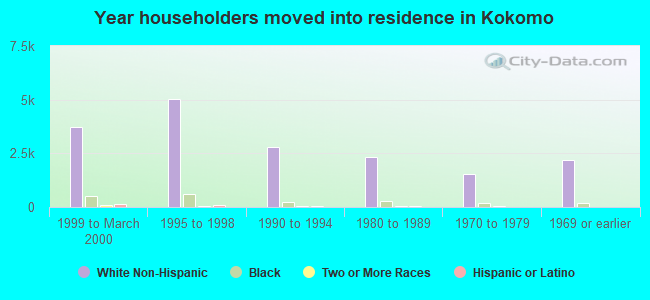
Year householder moved into unit - Moved in 1999 to March 2000 (%)
Year householder moved into unit - Moved in 1999 to March 2000 (%) - White
Year householder moved into unit - Moved in 1999 to March 2000 (%) - Black or African American
Year householder moved into unit - Moved in 1999 to March 2000 (%) - Asian
Year householder moved into unit - Moved in 1999 to March 2000 (%) - Hispanic or Latino
Year householder moved into unit - Moved in 1999 to March 2000 (%) - American Indian and Alaska Native
Year householder moved into unit - Moved in 1999 to March 2000 (%) - Multirace
Year householder moved into unit - Moved in 1999 to March 2000 (%) - Other Race
Year householder moved into unit - Moved in 1995 to 1998 (%)
Year householder moved into unit - Moved in 1995 to 1998 (%) - White
Year householder moved into unit - Moved in 1995 to 1998 (%) - Black or African American
Year householder moved into unit - Moved in 1995 to 1998 (%) - Asian
Year householder moved into unit - Moved in 1995 to 1998 (%) - Hispanic or Latino
Year householder moved into unit - Moved in 1995 to 1998 (%) - American Indian and Alaska Native
Year householder moved into unit - Moved in 1995 to 1998 (%) - Multirace
Year householder moved into unit - Moved in 1995 to 1998 (%) - Other Race
Year householder moved into unit - Moved in 1990 to 1994 (%)
Year householder moved into unit - Moved in 1990 to 1994 (%) - White
Year householder moved into unit - Moved in 1990 to 1994 (%) - Black or African American
Year householder moved into unit - Moved in 1990 to 1994 (%) - Asian
Year householder moved into unit - Moved in 1990 to 1994 (%) - Hispanic or Latino
Year householder moved into unit - Moved in 1990 to 1994 (%) - American Indian and Alaska Native
Year householder moved into unit - Moved in 1990 to 1994 (%) - Multirace
Year householder moved into unit - Moved in 1990 to 1994 (%) - Other Race
Year householder moved into unit - Moved in 1980 to 1989 (%)
Year householder moved into unit - Moved in 1980 to 1989 (%) - White
Year householder moved into unit - Moved in 1980 to 1989 (%) - Black or African American
Year householder moved into unit - Moved in 1980 to 1989 (%) - Asian
Year householder moved into unit - Moved in 1980 to 1989 (%) - Hispanic or Latino
Year householder moved into unit - Moved in 1980 to 1989 (%) - American Indian and Alaska Native
Year householder moved into unit - Moved in 1980 to 1989 (%) - Multirace
Year householder moved into unit - Moved in 1980 to 1989 (%) - Other Race
Year householder moved into unit - Moved in 1970 to 1979 (%)
Year householder moved into unit - Moved in 1970 to 1979 (%) - White
Year householder moved into unit - Moved in 1970 to 1979 (%) - Black or African American
Year householder moved into unit - Moved in 1970 to 1979 (%) - Asian
Year householder moved into unit - Moved in 1970 to 1979 (%) - Hispanic or Latino
Year householder moved into unit - Moved in 1970 to 1979 (%) - American Indian and Alaska Native
Year householder moved into unit - Moved in 1970 to 1979 (%) - Multirace
Year householder moved into unit - Moved in 1970 to 1979 (%) - Other Race
Year householder moved into unit - Moved in 1969 or earlier (%)
Year householder moved into unit - Moved in 1969 or earlier (%) - White
Year householder moved into unit - Moved in 1969 or earlier (%) - Black or African American
Year householder moved into unit - Moved in 1969 or earlier (%) - Asian
Year householder moved into unit - Moved in 1969 or earlier (%) - Hispanic or Latino
Year householder moved into unit - Moved in 1969 or earlier (%) - American Indian and Alaska Native
Year householder moved into unit - Moved in 1969 or earlier (%) - Multirace
Year householder moved into unit - Moved in 1969 or earlier (%) - Other Race
Housing units lacking complete plumbing facilities (%)
Housing units lacking complete kitchen facilities (%)
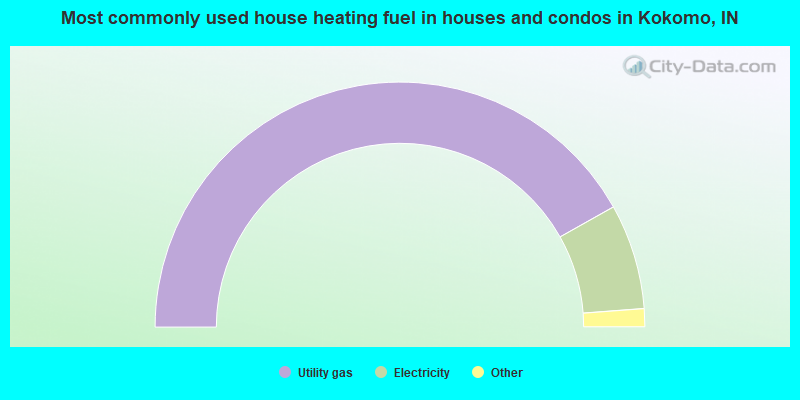
House heating fuel used in houses and condos - Utility gas (%)
House heating fuel used in houses and condos - Bottled, tank, or LP gas (%)
House heating fuel used in houses and condos - Electricity (%)
House heating fuel used in houses and condos - Fuel oil, kerosene, etc. (%)
House heating fuel used in houses and condos - Coal or coke (%)
House heating fuel used in houses and condos - Wood (%)
House heating fuel used in houses and condos - Solar energy (%)
House heating fuel used in houses and condos - Other fuel (%)
House heating fuel used in houses and condos - No fuel used (%)
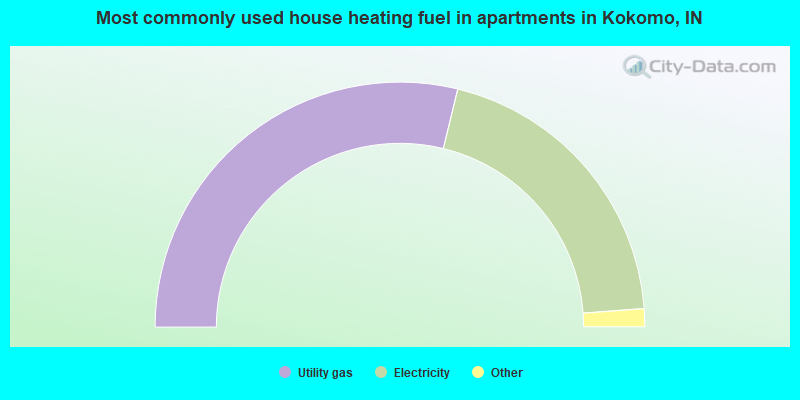
House heating fuel used in apartments - Utility gas (%)
House heating fuel used in apartments - Bottled, tank, or LP gas (%)
House heating fuel used in apartments - Electricity (%)
House heating fuel used in apartments - Fuel oil, kerosene, etc. (%)
House heating fuel used in apartments - Coal or coke (%)
House heating fuel used in apartments - Wood (%)
House heating fuel used in apartments - Solar energy (%)
House heating fuel used in apartments - Other fuel (%)
House heating fuel used in apartments - No fuel used (%)
Latest news about housing in Kokomo, IN collected exclusively by city-data.com from local newspapers, TV, and radio stations
Median year house/condo built: 1964Median year apartment built: 1978Household type by relationship:
Households: 59,621
Male householders: 11,351 (3,543 living alone ), Female householders: 14,752 (6,015 living alone )9,057 spouses (9,044 opposite-sex spouses ), 2,115 unmarried partners , (1,986 opposite-sex unmarried partners ), 15,806 children (14,053 natural , 356 adopted , 1,396 stepchildren ), 2,376 grandchildren , 255 brothers or sisters , 344 parents , 5 foster children , 905 other relatives , 1,556 non-relatives In group quarters: 1,095
Size of family households: 6,875 2-persons , 3,364 3-persons , 1,994 4-persons , 1,768 5-persons , 473 6-persons , 107 7-or-more-persons .
Size of nonfamily households: 10,020 1-person , 1,798 2-persons , 324 3-persons , 11 4-persons , 11 6-persons .
5,790 married couples with children. single-parent households (873 men , 4,821 women ).
95.3% of residents of Kokomo speak English at home. of residents speak Spanish at home (70% speak English very well , 16% speak English well , 13% speak English not well , 1% don't speak English at all ).of residents speak other Indo-European language at home (79% speak English very well , 18% speak English well , 4% speak English not well ).of residents speak Asian or Pacific Island language at home (75% speak English very well , 16% speak English well , 9% speak English not well ).of residents speak other language at home (71% speak English very well , 29% speak English not well ).
Foreign born population: 1,722 (2.9%)of them are naturalized citizens )
Median number of rooms in houses and condos:
Median number of rooms in apartments
Owner-occupied Renter-occupied
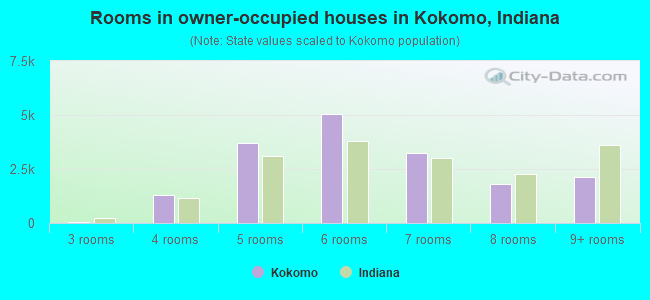
Rooms in owner-occupied houses in Kokomo, Indiana
18 1 room 14 2 rooms 69 3 rooms 1,278 4 rooms 3,714 5 rooms 5,048 6 rooms 3,218 7 rooms 1,806 8 rooms 2,137 9+ rooms
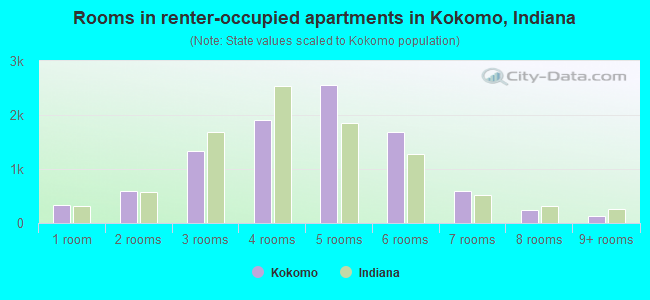
Rooms in renter-occupied apartments in Kokomo, Indiana
334 1 room 600 2 rooms 1,334 3 rooms 1,899 4 rooms 2,553 5 rooms 1,685 6 rooms 585 7 rooms 232 8 rooms 134 9+ rooms
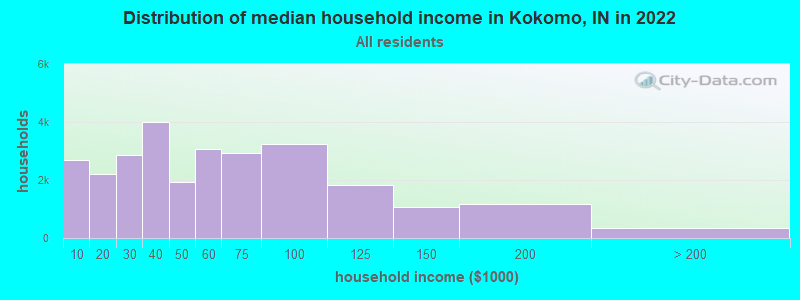
Kokomo, IN household income distribution 2,700 Less than $10,0002,207 $10,000 to $19,9992,877 $20,000 to $29,9994,015 $30,000 to $39,9991,917 $40,000 to $49,9993,075 $50,000 to $59,9992,938 $60,000 to $74,9993,237 $75,000 to $99,9991,823 $100,000 to $124,9991,062 $125,000 to $149,9991,188 $150,000 to $199,999357 $200,000 or more
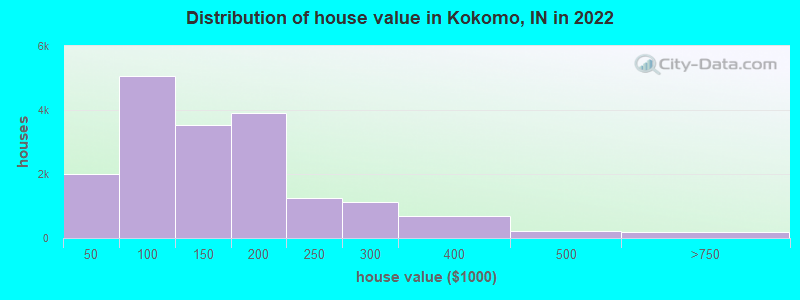
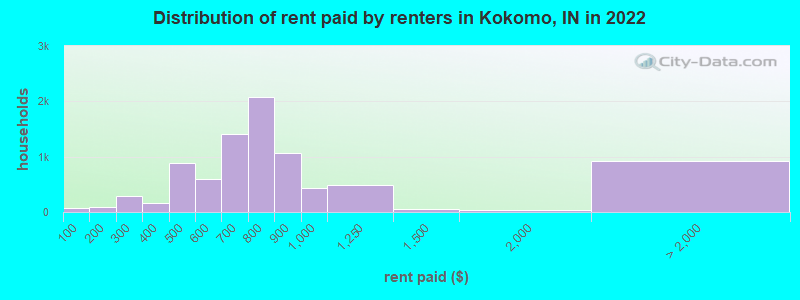
Home value of owner - occupied houses in 2022 in Kokomo, IN 218 Less than $10,000301 $10,000 to $14,999259 $15,000 to $19,99985 $20,000 to $24,999248 $25,000 to $29,999123 $30,000 to $34,999114 $35,000 to $39,999640 $40,000 to $49,999398 $50,000 to $59,9991,399 $60,000 to $69,999658 $70,000 to $79,9991,060 $80,000 to $89,999892 $90,000 to $99,9991,382 $100,000 to $124,9992,143 $125,000 to $149,9992,218 $150,000 to $174,9991,689 $175,000 to $199,9991,265 $200,000 to $249,9991,122 $250,000 to $299,999675 $300,000 to $399,999218 $400,000 to $499,999100 $500,000 to $749,99938 $750,000 to $999,99929 $1,500,000 to $1,999,99921 $2,000,000 or moreRent paid by renters in 2022 in Kokomo, IN 75 Less than $10040 $100 to $14944 $150 to $199221 $200 to $24968 $250 to $29989 $300 to $34981 $350 to $399440 $400 to $449438 $450 to $499213 $500 to $549380 $550 to $599732 $600 to $649677 $650 to $6991,165 $700 to $749922 $750 to $7991,060 $800 to $899440 $900 to $999486 $1,000 to $1,24955 $1,250 to $1,49940 $1,500 to $1,99943 $2,000 to $2,49944 $3,000 to $3,49957 $3,500 or more771 No cash rent
Percentage of workers working in this county: 81.5%Number of people working at home: 1,369 (5.3% of all workers )
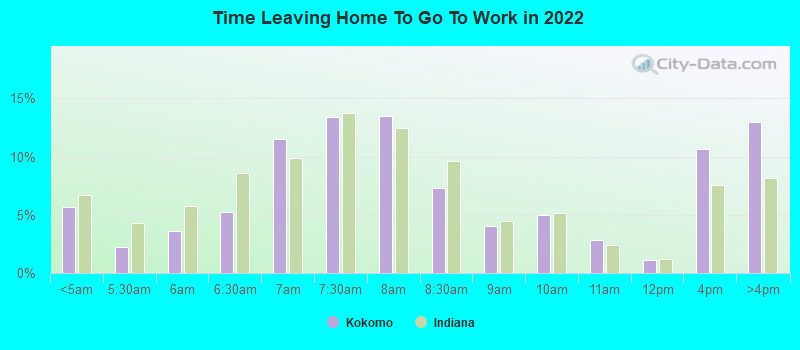
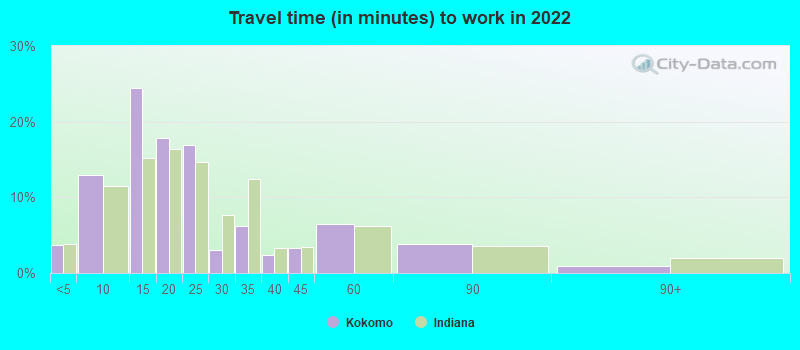
Travel time to work (commute)
Less than 5 minutes: 1,1655 to 9 minutes: 3,73110 to 14 minutes: 6,31915 to 19 minutes: 3,47520 to 24 minutes: 3,36925 to 29 minutes: 27930 to 34 minutes: 97235 to 39 minutes: 37840 to 44 minutes: 24045 to 59 minutes: 1,35960 to 89 minutes: 1,32190 or more minutes: 307
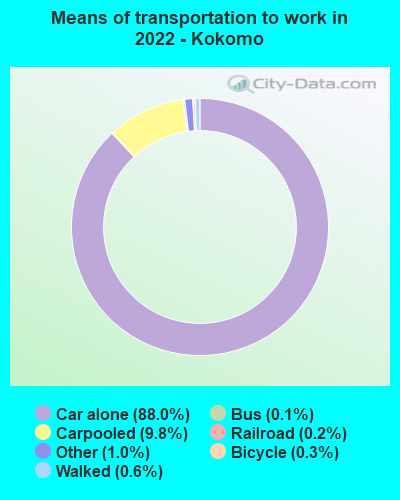
Means of transportation to work:
Drove a car alone: 29,070 (82.1%)Carpooled: 3,583 (10.1%)Bus : 39 (0.1%)Light rail, streetcar or trolley : 59 (0.2%)Taxi: 375 (1.1%)Bicycle: 115 (0.3%)Walked: 210 (0.6%)Worked at home: 1,369 (3.9%)
Unemployment by race in 2022
Unemployment rate for White non-Hispanic residents 4.6% Males3.3% FemalesUnemployment rate for Black residents 22.6% Males2.7% FemalesUnemployment rate for Asian residents 28.1% MalesUnemployment rate for other race residents 7.7% MalesUnemployment rate for two or more race residents 7.0% Males3.0% FemalesUnemployment rate for Hispanic or Latino residents 1.8% Males
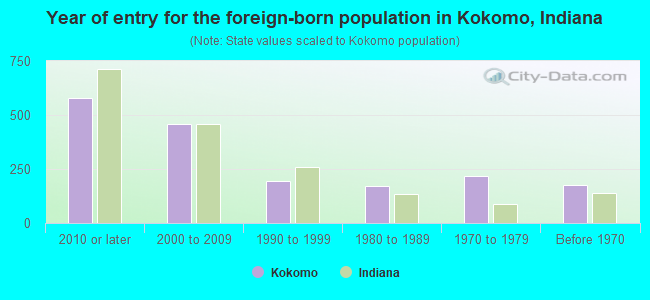
Year of entry for the foreign-born population in Kokomo, Indiana
578 2010 or later 457 2000 to 2009 193 1990 to 1999 170 1980 to 1989 218 1970 to 1979 175 Before 1970
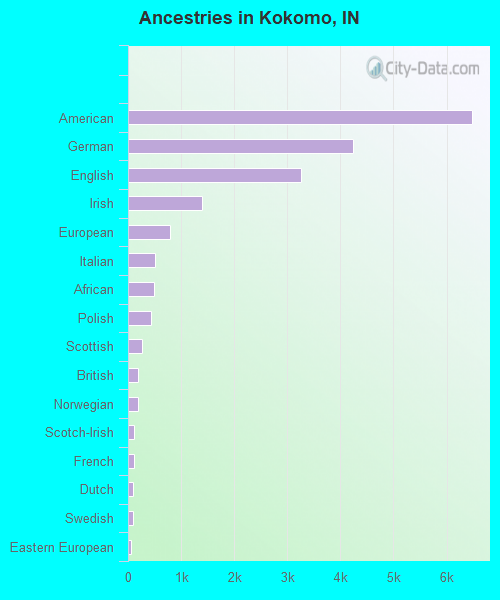
First ancestries reported:
American: 6,476 (21.9%)
German: 4,238 (14.3%)
English: 3,256 (11.0%)
Irish: 1,401 (4.7%)
European: 784 (2.6%)
Italian: 501 (1.7%)
African: 487 (1.6%)
Polish: 426 (1.4%)
Scottish: 259 (0.9%)
British: 192 (0.6%)
Norwegian: 181 (0.6%)
Scotch-Irish: 119 (0.4%)
French: 104 (0.4%)
Dutch: 99 (0.3%)
Swedish: 86 (0.3%)
Eastern European: 59 (0.2%)
Nigerian: 52 (0.2%)
Romanian: 52 (0.2%)
Russian: 51 (0.2%)
Iranian: 46 (0.2%)
Scandinavian: 23 (0.08%)
Cajun: 22 (0.07%)
Austrian: 18 (0.06%)
Danish: 17 (0.06%)
Belgian: 12 (0.04%)
Swiss: 12 (0.04%)
Bulgarian: 11 (0.04%)
Slovene: 10 (0.03%)
Ethiopian: 10 (0.03%)
Czechoslovakian: 9 (0.03%)
Hungarian: 9 (0.03%)
French Canadian: 8 (0.03%)
Welsh: 7 (0.02%)
Moroccan: 5 (0.02%) Most common places of birth for foreign-born residents (%): India Kokomo:
16.4% (279)Indiana:
8.5% (32,127)
Mexico Kokomo:
10.6% (181)Indiana:
27.0% (101,996)
Cuba Kokomo:
7.8% (132)Indiana:
0.4% (1,509)
Philippines Kokomo:
7.1% (121)Indiana:
3.1% (11,851)
Cambodia Kokomo:
6.7% (114)Indiana:
0.2% (915)
Argentina Kokomo:
5.2% (89)Indiana:
0.2% (832)
Switzerland Kokomo:
4.9% (84)Indiana:
0.1% (336)
Vietnam Kokomo:
3.5% (60)Indiana:
1.8% (6,645)
Canada Kokomo:
3.2% (55)Indiana:
2.1% (7,834)
Iran Kokomo:
2.8% (48)Indiana:
0.4% (1,600)
Nigeria Kokomo:
2.5% (43)Indiana:
3.3% (12,337)
Kazakhstan Kokomo:
2.2% (38)Indiana:
0.0% (92)
Israel Kokomo:
2.1% (35)Indiana:
0.1% (422)
Eritrea Kokomo:
2.1% (35)Indiana:
0.2% (804)
El Salvador Kokomo:
2.0% (34)Indiana:
2.2% (8,253)
Korea Kokomo:
1.6% (27)Indiana:
2.0% (7,653)
Place of birth for U.S.-born residents:
This state: 45,163Other state: 12,216Northeast: 1,078Midwest: 5,511South: 4,670West: 907 84.5% of Kokomo residents lived in the same house 1 years ago.
Out of people who lived in different houses, 39.3% lived in this county.
Out of people who lived in different counties, 81.1% lived in Indiana.
Kokomo:
84.5%State average:
87.1%
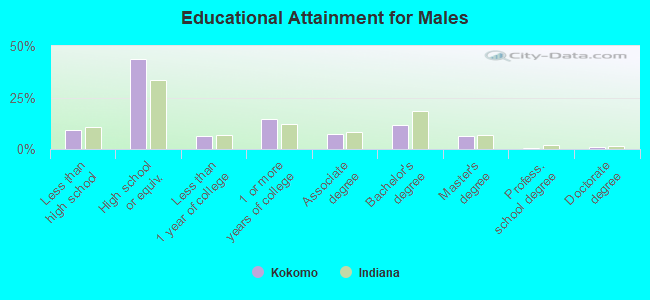
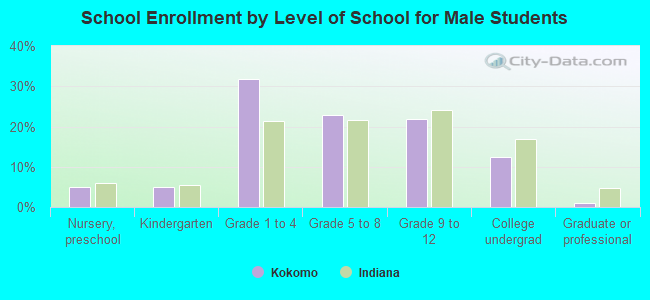
Education attainment for males 25 years and older:
No schooling: 147Nursery to 4th grade: 05th and 6th grade: 317th and 8th grade: 1949th grade: 9010th grade: 62511th grade: 29712th grade, no diploma: 350High school graduate (or equivalency): 8,248Less than 1 year of college: 1,223Some college more than 1 year, no degree: 2,761Associate degree: 1,356Bachelor's degree: 2,213Master's degree: 1,170Professional school degree: 54Doctorate degree: 152
Education attainment for females 25 years and older:
No schooling: 855Nursery to 4th grade: 45th and 6th grade: 357th and 8th grade: 2739th grade: 15110th grade: 23011th grade: 52212th grade, no diploma: 204High school graduate (or equivalency): 8,875Less than 1 year of college: 2,134Some college more than 1 year, no degree: 4,097Associate degree: 1,964Bachelor's degree: 2,761Master's degree: 671Professional school degree: 127Doctorate degree: 28
Housing units in structures:
One, detached: 20,953One, attached: 1,205Two: 8423 or 4: 1,2815 to 9: 2,01110 to 19: 1,14520 to 49: 58150 or more: 1,181Mobile homes: 910Median worth of mobile homes: $20,318
Housing units lacking complete plumbing facilities in 2022: 1.7%Housing units lacking complete kitchen facilities in 2022: 3.9%House/condo owner moved in on average 11 years ago
Renter moved in on average 2 years ago
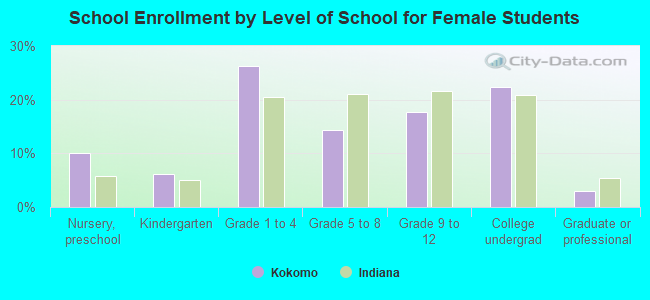
Private vs. public school enrollment:
Students in private schools in grades 1 to 8 (elementary and middle school): 535 Students in private schools in grades 9 to 12 (high school): 152 Students in private undergraduate colleges: 171