Lafayette, LA (Louisiana) Houses and Residents
Estimated median house or condo value in 2022: $234,200 (it was $99,800 in 2000 )
Lafayette:
$234,200Louisiana:
$209,200
Lower value quartile - upper value quartile: $162,400 - $347,000Mean price in 2022: Detached houses: $317,219 Here:
$317,219State:
$273,555
Townhouses or other attached units: $137,122 Here:
$137,122State:
$297,713
In 2-unit structures: $250,598 Here:
$250,598State:
$325,117
In 3-to-4-unit structures: $134,620 Here:
$134,620State:
$213,088
In 5-or-more-unit structures: $234,393 Here:
$234,393State:
$257,054
Mobile homes: $167,185 Here:
$167,185State:
$89,857
Total population: 126,066 (Urban population: 110,021, Rural population: 240 (all nonfarm) )
Houses: 60,226 (54,329 occupied: 28,668 owner occupied, 25,661 renter occupied )
% of renters here:
47%State:
32%
Housing density: 1,265 houses/condos per square mile
Median price asked for vacant for-sale houses and condos in 2022: $304,596.
Median contract rent in 2022: $875 (lower quartile is $666, upper quartile is $1,108)
Median rent asked for vacant for-rent units in 2022: $942
Median gross rent in Lafayette, LA in 2022: $1,012
Housing units in Lafayette with a mortgage: 15,136 (1,254 second mortgage, 0 home equity loan, 1,131 both second mortgage and home equity loan )Houses without a mortgage: 829
Median household income for houses/condos with a mortgage: $95,962
Median household income for apartments without a mortgage: $50,000
Median monthly housing costs: $985
Data:
Median house or condo value ($)
Median house or condo value ($ change since 2000)
Median house or condo value ($) - White
Median house or condo value ($) - Black or African American
Median house or condo value ($) - Asian
Median house or condo value ($) - Hispanic or Latino
Median house or condo value ($) - American Indian and Alaska Native
Median house or condo value ($) - Multirace
Median house or condo value ($) - Other Race
Median price asked for mobile homes ($)
Household density (households per square mile)
Mean house or condo value by units in structure - 1, detached ($)
Mean house or condo value by units in structure - 1, attached ($)
Mean house or condo value by units in structure - 2 ($)
Mean house or condo value by units in structure by units in structure - 3 or 4 ($)
Mean house or condo value by units in structure - 5 or more ($)
Mean house or condo value by units in structure - Boat, RV, van, etc. ($)
Mean house or condo value by units in structure - Mobile home ($)
Median contract rent ($)
Median contract rent - Lower quartile ($)
Median contract rent - Upper quartile ($)
Median gross rent ($)
Urban houses (%)
Rural houses (%)
Houses occupied (%)
Houses occupied (% change since 2000)
Houses owner occupied (%)
Houses owner occupied (% change since 2000)
Houses renter occupied (%)
Houses renter occupied (% change since 2000)
Vacant housing units - For rent (%)
Vacant housing units - For rent (% change since 2000)
Vacant housing units - For sale only (%)
Vacant housing units - For sale only (% change since 2000)
Vacant housing units - Rented or sold, not occupied (%)
Vacant housing units - Rented or sold, not occupied (% change since 2000)
Vacant housing units - For seasonal, recreational, or occasional use (%)
Vacant housing units - For seasonal, recreational, or occasional use (% change since 2000)
Vacant housing units - For migrant workers (%)
Vacant housing units - For migrant workers (% change since 2000)
Vacant housing units - Other vacant (%)
Vacant housing units - Other vacant (% change since 2000)
Median monthly housing costs ($)
Median household income for houses/condos with a mortgage ($)
Median household income for houses/condos without a mortgage ($)
Median household income ($)
Median household income ($) - White
Median household income ($) - Black or African American
Median household income ($) - Asian
Median household income ($) - Hispanic or Latino
Median household income ($) - American Indian and Alaska Native
Median household income ($) - Multirace
Median household income ($) - Other Race
Mortgage status - with mortgage (%)
Mortgage status - with second mortgage (%)
Mortgage status - with home equity loan (%)
Mortgage status - with both second mortgage and home equity loan (%)
Mortgage status - without a mortgage (%)
Median year house/condo built
Median year apartment built
Household type by relationship - Male householder living alone (%)
Household type by relationship - Male householder not living alone (%)
Household type by relationship - Female householder living alone (%)
Household type by relationship - Female householder not living alone (%)
Household type by relationship - Opposite-Sex spouse (%)
Household type by relationship - Same-Sex spouse (%)
Household type by relationship - Opposite-Sex unmarried partner (%)
Household type by relationship - Same-Sex unmarried partner (%)
Household type by relationship - In group quarters (%)
Size of family households - 2-person household (%)
Size of family households - 3-person household (%)
Size of family households - 4-person household (%)
Size of family households - 5-person household (%)
Size of family households - 6-person household (%)
Size of family households - 7-or-more-person household (%)
Size of nonfamily households - 1-person household (%)
Size of nonfamily households - 2-person household (%)
Size of nonfamily households - 3-person household (%)
Size of nonfamily households - 4-person household (%)
Size of nonfamily households - 5-person household (%)
Size of nonfamily households - 6-person household (%)
Size of nonfamily households - 7-or-moreperson household (%)
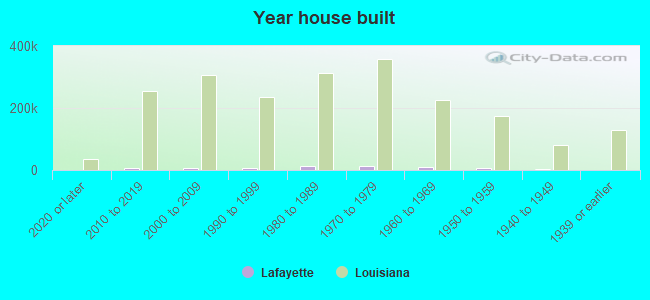
Year house built - Built 2010 or later (%)
Year house built - Built 2000 to 2009 (%)
Year house built - Built 1990 to 1999 (%)
Year house built - Built 1980 to 1989 (%)
Year house built - Built 1970 to 1979 (%)
Year house built - Built 1960 to 1969 (%)
Year house built - Built 1950 to 1959 (%)
Year house built - Built 1940 to 1949 (%)
Year house built - Built 1939 or earlier (%)
Median number of rooms in houses and condos
Median number of rooms in apartments
Median number of bedrooms in owner occupied houses
Mean number of bedrooms in owner occupied houses
Median number of bedrooms in renter occupied houses
Mean number of bedrooms in renter occupied houses
Median number of vehichles in owner occupied houses
Mean number of vehichles in owner occupied houses
Median number of vehichles in renter occupied houses
Mean number of vehichles in renter occupied houses
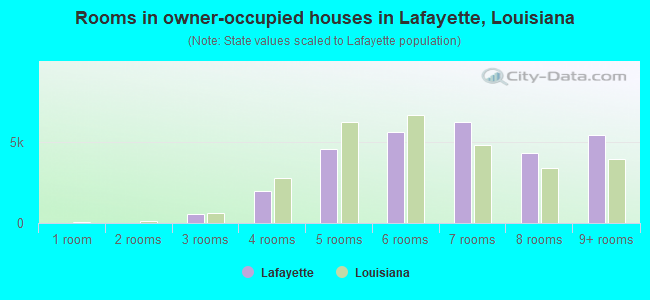
Rooms in owner-occupied houses - 1 room (%)
Rooms in owner-occupied houses - 2 rooms (%)
Rooms in owner-occupied houses - 3 rooms (%)
Rooms in owner-occupied houses - 4 rooms (%)
Rooms in owner-occupied houses - 5 rooms (%)
Rooms in owner-occupied houses - 6 rooms (%)
Rooms in owner-occupied houses - 7 rooms (%)
Rooms in owner-occupied houses - 8 rooms (%)
Rooms in owner-occupied houses - 9+ rooms (%)
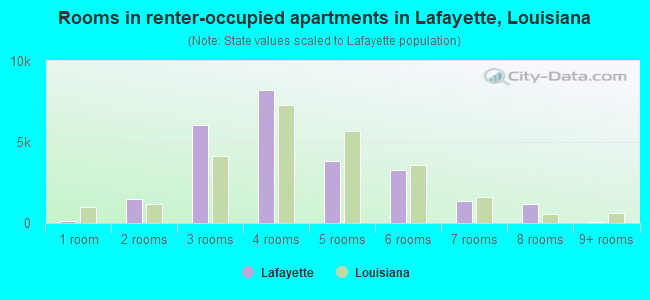
Rooms in renter-occupied houses - 1 room (%)
Rooms in renter-occupied houses - 2 rooms (%)
Rooms in renter-occupied houses - 3 rooms (%)
Rooms in renter-occupied houses - 4 rooms (%)
Rooms in renter-occupied houses - 5 rooms (%)
Rooms in renter-occupied houses - 6 rooms (%)
Rooms in renter-occupied houses - 7 rooms (%)
Rooms in renter-occupied houses - 8 rooms (%)
Rooms in renter-occupied houses - 9+ rooms (%)
Bedrooms in owner-occupied houses - no bedrooms (%)
Bedrooms in owner-occupied houses - 1 bedroom (%)
Bedrooms in owner-occupied houses - 2 bedrooms (%)
Bedrooms in owner-occupied houses - 3 bedrooms (%)
Bedrooms in owner-occupied houses - 4 bedrooms (%)
Bedrooms in owner-occupied houses - 5+ bedrooms (%)
Bedrooms in renter-occupied houses - no bedrooms (%)
Bedrooms in renter-occupied houses - 1 bedroom (%)
Bedrooms in renter-occupied houses - 2 bedrooms (%)
Bedrooms in renter-occupied houses - 3 bedrooms (%)
Bedrooms in renter-occupied houses - 4 bedrooms (%)
Bedrooms in renter-occupied houses - 5+ bedrooms (%)
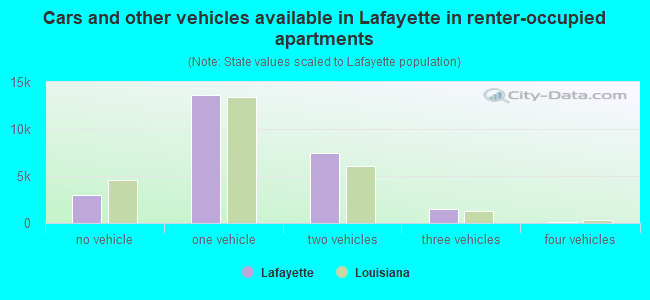
Vehicles available in owner-occupied houses - no vehicle available (%)
Vehicles available in owner-occupied houses - 1 vehicle available(%)
Vehicles available in owner-occupied houses - 2 Vehicles available (%)
Vehicles available in owner-occupied houses - 3 Vehicles available (%)
Vehicles available in owner-occupied houses - 4 Vehicles available (%)
Vehicles available in owner-occupied houses - 5+ Vehicles available (%)
Vehicles available in renter-occupied houses - no vehicle available (%)
Vehicles available in renter-occupied houses - 1 vehicle available (%)
Vehicles available in renter-occupied houses - 2 Vehicles available (%)
Vehicles available in renter-occupied houses - 3 Vehicles available (%)
Vehicles available in renter-occupied houses - 4 Vehicles available (%)
Vehicles available in renter-occupied houses - 5+ Vehicles available (%)
Housing units in structures - 1, detached (%)
Housing units in structures - 1, attached (%)
Housing units in structures - 2 (%)
Housing units in structures - 3 or 4 (%)
Housing units in structures - 5 to 9 (%)
Housing units in structures - 10 to 19 (%)
Housing units in structures - 20 to 49 (%)
Housing units in structures - 50 or more (%)
Housing units in structures - Mobile home (%)
Housing units in structures - Boat, RV, van, etc. (%)
Housing units in structures - Owners - 1, detached (%)
Housing units in structures - Owners - 1, attached (%)
Housing units in structures - Owners - 2 (%)
Housing units in structures - Owners - 3 or 4 (%)
Housing units in structures - Owners - 5 to 9 (%)
Housing units in structures - Owners - 10 to 19 (%)
Housing units in structures - Owners - 20 to 49 (%)
Housing units in structures - Owners - 50 or more (%)
Housing units in structures - Owners - Mobile home (%)
Housing units in structures - Owners - Boat, RV, van, etc. (%)
Housing units in structures - Renters - 1, detached (%)
Housing units in structures - Renters - 1, attached (%)
Housing units in structures - Renters - 2 (%)
Housing units in structures - Renters - 3 or 4 (%)
Housing units in structures - Renters - 5 to 9 (%)
Housing units in structures - Renters - 10 to 19 (%)
Housing units in structures - Renters - 20 to 49 (%)
Housing units in structures - Renters - 50 or more (%)
Housing units in structures - Renters - Mobile home (%)
Housing units in structures - Renters - Boat, RV, van, etc. (%)
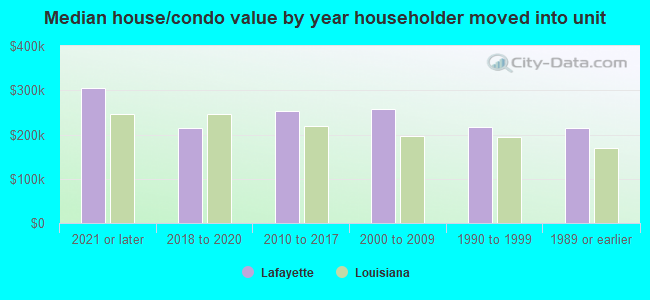
House/condo owner moved in on average (years ago)
Renter moved in on average (years ago)
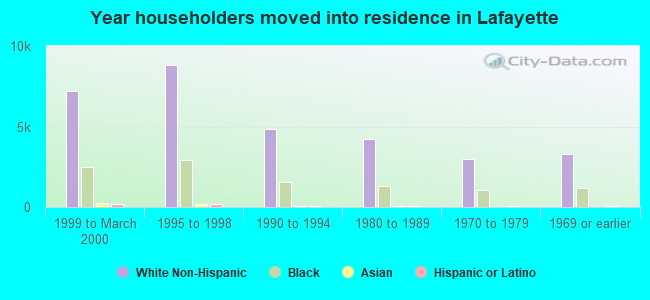
Year householder moved into unit - Moved in 1999 to March 2000 (%)
Year householder moved into unit - Moved in 1999 to March 2000 (%) - White
Year householder moved into unit - Moved in 1999 to March 2000 (%) - Black or African American
Year householder moved into unit - Moved in 1999 to March 2000 (%) - Asian
Year householder moved into unit - Moved in 1999 to March 2000 (%) - Hispanic or Latino
Year householder moved into unit - Moved in 1999 to March 2000 (%) - American Indian and Alaska Native
Year householder moved into unit - Moved in 1999 to March 2000 (%) - Multirace
Year householder moved into unit - Moved in 1999 to March 2000 (%) - Other Race
Year householder moved into unit - Moved in 1995 to 1998 (%)
Year householder moved into unit - Moved in 1995 to 1998 (%) - White
Year householder moved into unit - Moved in 1995 to 1998 (%) - Black or African American
Year householder moved into unit - Moved in 1995 to 1998 (%) - Asian
Year householder moved into unit - Moved in 1995 to 1998 (%) - Hispanic or Latino
Year householder moved into unit - Moved in 1995 to 1998 (%) - American Indian and Alaska Native
Year householder moved into unit - Moved in 1995 to 1998 (%) - Multirace
Year householder moved into unit - Moved in 1995 to 1998 (%) - Other Race
Year householder moved into unit - Moved in 1990 to 1994 (%)
Year householder moved into unit - Moved in 1990 to 1994 (%) - White
Year householder moved into unit - Moved in 1990 to 1994 (%) - Black or African American
Year householder moved into unit - Moved in 1990 to 1994 (%) - Asian
Year householder moved into unit - Moved in 1990 to 1994 (%) - Hispanic or Latino
Year householder moved into unit - Moved in 1990 to 1994 (%) - American Indian and Alaska Native
Year householder moved into unit - Moved in 1990 to 1994 (%) - Multirace
Year householder moved into unit - Moved in 1990 to 1994 (%) - Other Race
Year householder moved into unit - Moved in 1980 to 1989 (%)
Year householder moved into unit - Moved in 1980 to 1989 (%) - White
Year householder moved into unit - Moved in 1980 to 1989 (%) - Black or African American
Year householder moved into unit - Moved in 1980 to 1989 (%) - Asian
Year householder moved into unit - Moved in 1980 to 1989 (%) - Hispanic or Latino
Year householder moved into unit - Moved in 1980 to 1989 (%) - American Indian and Alaska Native
Year householder moved into unit - Moved in 1980 to 1989 (%) - Multirace
Year householder moved into unit - Moved in 1980 to 1989 (%) - Other Race
Year householder moved into unit - Moved in 1970 to 1979 (%)
Year householder moved into unit - Moved in 1970 to 1979 (%) - White
Year householder moved into unit - Moved in 1970 to 1979 (%) - Black or African American
Year householder moved into unit - Moved in 1970 to 1979 (%) - Asian
Year householder moved into unit - Moved in 1970 to 1979 (%) - Hispanic or Latino
Year householder moved into unit - Moved in 1970 to 1979 (%) - American Indian and Alaska Native
Year householder moved into unit - Moved in 1970 to 1979 (%) - Multirace
Year householder moved into unit - Moved in 1970 to 1979 (%) - Other Race
Year householder moved into unit - Moved in 1969 or earlier (%)
Year householder moved into unit - Moved in 1969 or earlier (%) - White
Year householder moved into unit - Moved in 1969 or earlier (%) - Black or African American
Year householder moved into unit - Moved in 1969 or earlier (%) - Asian
Year householder moved into unit - Moved in 1969 or earlier (%) - Hispanic or Latino
Year householder moved into unit - Moved in 1969 or earlier (%) - American Indian and Alaska Native
Year householder moved into unit - Moved in 1969 or earlier (%) - Multirace
Year householder moved into unit - Moved in 1969 or earlier (%) - Other Race
Housing units lacking complete plumbing facilities (%)
Housing units lacking complete kitchen facilities (%)
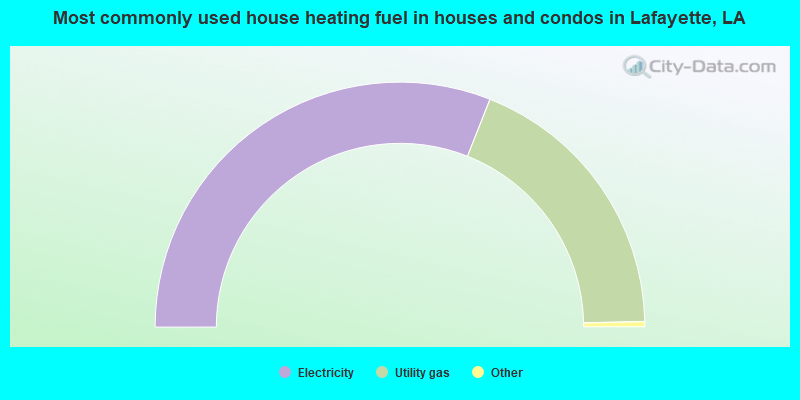
House heating fuel used in houses and condos - Utility gas (%)
House heating fuel used in houses and condos - Bottled, tank, or LP gas (%)
House heating fuel used in houses and condos - Electricity (%)
House heating fuel used in houses and condos - Fuel oil, kerosene, etc. (%)
House heating fuel used in houses and condos - Coal or coke (%)
House heating fuel used in houses and condos - Wood (%)
House heating fuel used in houses and condos - Solar energy (%)
House heating fuel used in houses and condos - Other fuel (%)
House heating fuel used in houses and condos - No fuel used (%)
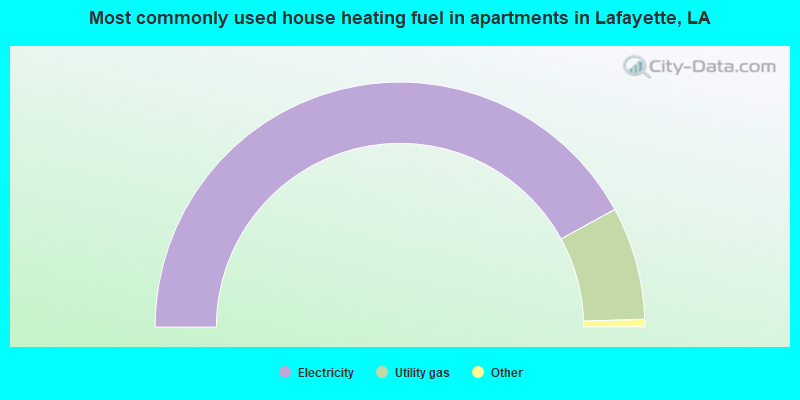
House heating fuel used in apartments - Utility gas (%)
House heating fuel used in apartments - Bottled, tank, or LP gas (%)
House heating fuel used in apartments - Electricity (%)
House heating fuel used in apartments - Fuel oil, kerosene, etc. (%)
House heating fuel used in apartments - Coal or coke (%)
House heating fuel used in apartments - Wood (%)
House heating fuel used in apartments - Solar energy (%)
House heating fuel used in apartments - Other fuel (%)
House heating fuel used in apartments - No fuel used (%)
Latest news about housing in Lafayette, LA collected exclusively by city-data.com from local newspapers, TV, and radio stations
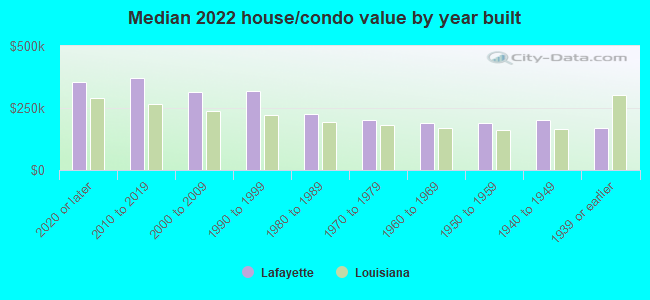
Median year house/condo built: 1979Median year apartment built: 1983Household type by relationship:
Households: 121,367
Male householders: 25,953 (9,607 living alone ), Female householders: 28,376 (10,560 living alone )20,693 spouses (20,569 opposite-sex spouses ), 3,555 unmarried partners , (3,434 opposite-sex unmarried partners ), 32,859 children (31,698 natural , 197 adopted , 964 stepchildren ), 1,384 grandchildren , 1,083 brothers or sisters , 1,215 parents , 0 foster children , 935 other relatives , 3,498 non-relatives In group quarters: 1,816
Size of family households: 13,809 2-persons , 6,499 3-persons , 6,078 4-persons , 2,119 5-persons , 539 6-persons , 673 7-or-more-persons .
Size of nonfamily households: 20,167 1-person , 3,431 2-persons , 835 3-persons , 40 4-persons , 139 5-persons .
14,836 married couples with children. single-parent households (909 men , 7,259 women ).
90.9% of residents of Lafayette speak English at home. of residents speak Spanish at home (52% speak English very well , 15% speak English well , 17% speak English not well , 16% don't speak English at all ).of residents speak other Indo-European language at home (76% speak English very well , 18% speak English well , 5% speak English not well ).of residents speak Asian or Pacific Island language at home (70% speak English very well , 13% speak English well , 14% speak English not well , 3% don't speak English at all ).of residents speak other language at home (67% speak English very well , 33% speak English well ).
Foreign born population: 6,064 (5.0%)of them are naturalized citizens )
Median number of rooms in houses and condos:
Median number of rooms in apartments
Owner-occupied Renter-occupied
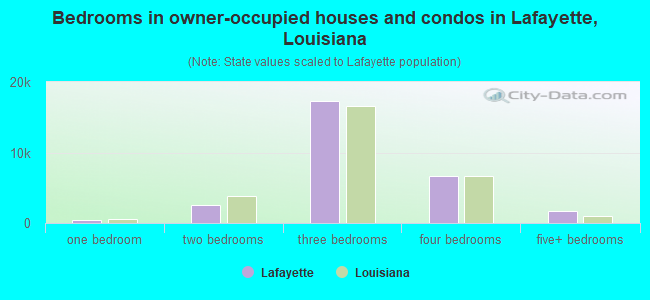
Bedrooms in owner-occupied houses and condos in Lafayette, Louisiana
0 no bedroom 395 1 bedroom 2,586 2 bedrooms 17,373 3 bedrooms 6,619 4 bedrooms 1,695 5+ bedrooms
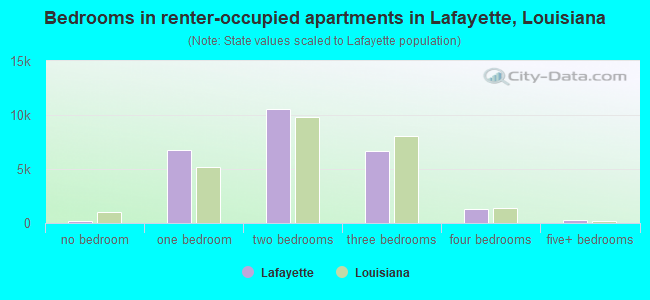
Bedrooms in renter-occupied apartments in Lafayette, Louisiana
148 no bedroom 6,751 1 bedroom 10,577 2 bedrooms 6,657 3 bedrooms 1,260 4 bedrooms 268 5+ bedrooms
Owner-occupied Renter-occupied
Rooms in owner-occupied houses in Lafayette, Louisiana
0 1 room 0 2 rooms 553 3 rooms 1,987 4 rooms 4,576 5 rooms 5,582 6 rooms 6,221 7 rooms 4,348 8 rooms 5,401 9+ rooms
Rooms in renter-occupied apartments in Lafayette, Louisiana
148 1 room 1,484 2 rooms 6,058 3 rooms 8,233 4 rooms 3,813 5 rooms 3,296 6 rooms 1,348 7 rooms 1,196 8 rooms 85 9+ rooms
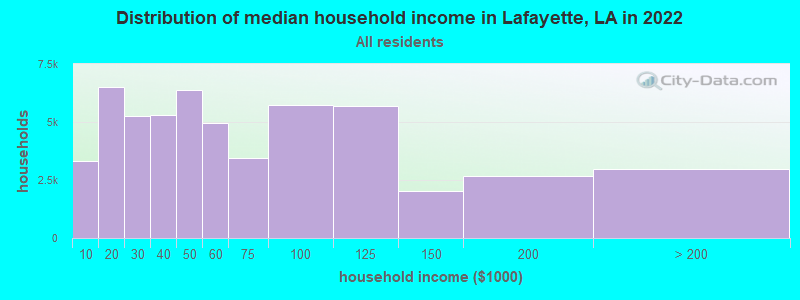
Lafayette, LA household income distribution 3,333 Less than $10,0006,495 $10,000 to $19,9995,247 $20,000 to $29,9995,320 $30,000 to $39,9996,383 $40,000 to $49,9994,965 $50,000 to $59,9993,444 $60,000 to $74,9995,727 $75,000 to $99,9995,709 $100,000 to $124,9992,034 $125,000 to $149,9992,693 $150,000 to $199,9992,979 $200,000 or more
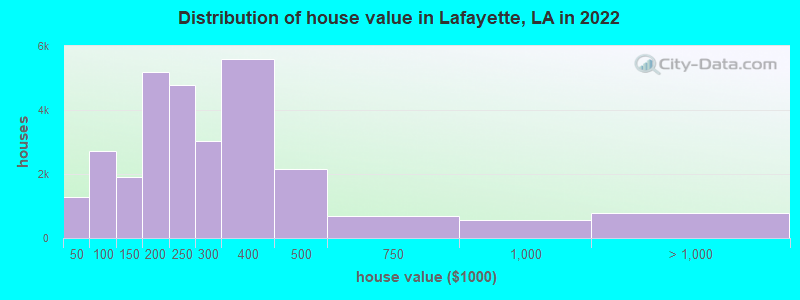
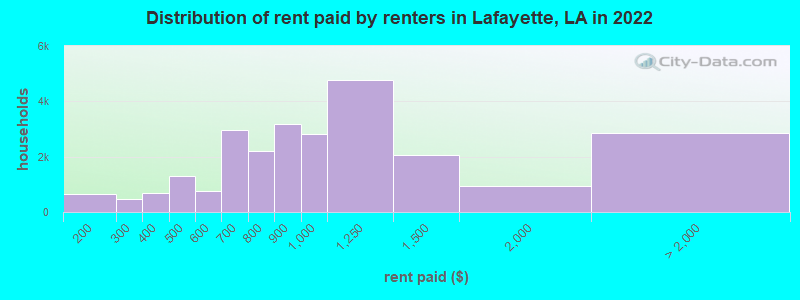
Home value of owner - occupied houses in 2022 in Lafayette, LA 412 Less than $10,000376 $10,000 to $14,999177 $15,000 to $19,999104 $20,000 to $24,99967 $25,000 to $29,999122 $30,000 to $34,99932 $40,000 to $49,999173 $50,000 to $59,999500 $60,000 to $69,999795 $70,000 to $79,999824 $80,000 to $89,999385 $90,000 to $99,999967 $100,000 to $124,999942 $125,000 to $149,9992,607 $150,000 to $174,9992,592 $175,000 to $199,9994,768 $200,000 to $249,9993,029 $250,000 to $299,9995,597 $300,000 to $399,9992,150 $400,000 to $499,999691 $500,000 to $749,999564 $750,000 to $999,999173 $1,000,000 to $1,499,999398 $1,500,000 to $1,999,999223 $2,000,000 or moreRent paid by renters in 2022 in Lafayette, LA 629 $100 to $14931 $150 to $199408 $200 to $24955 $250 to $299684 $300 to $349670 $400 to $449617 $450 to $499251 $500 to $549520 $550 to $5991,277 $600 to $6491,675 $650 to $6991,297 $700 to $749900 $750 to $7993,191 $800 to $8992,837 $900 to $9994,772 $1,000 to $1,2492,077 $1,250 to $1,499926 $1,500 to $1,9992,844 No cash rent
Percentage of workers working in this county: 87.2%Number of people working at home: 6,406 (11.0% of all workers )
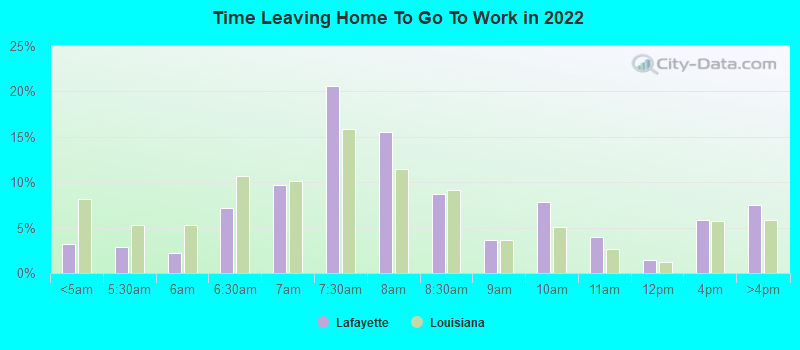
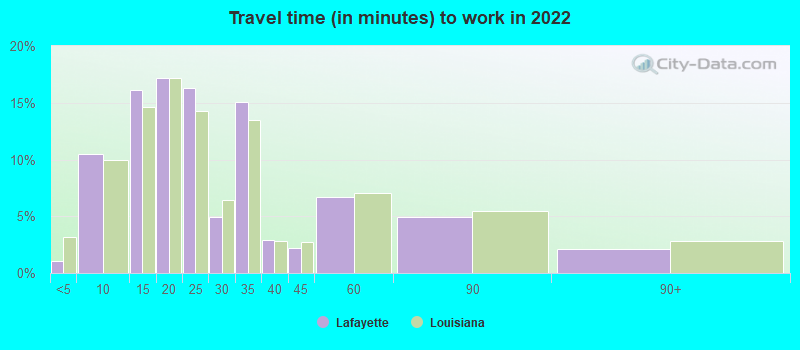
Travel time to work (commute)
Less than 5 minutes: 4615 to 9 minutes: 7,75410 to 14 minutes: 12,01215 to 19 minutes: 10,64920 to 24 minutes: 8,52525 to 29 minutes: 2,48630 to 34 minutes: 3,60035 to 39 minutes: 1,17440 to 44 minutes: 66145 to 59 minutes: 1,32360 to 89 minutes: 1,90390 or more minutes: 561
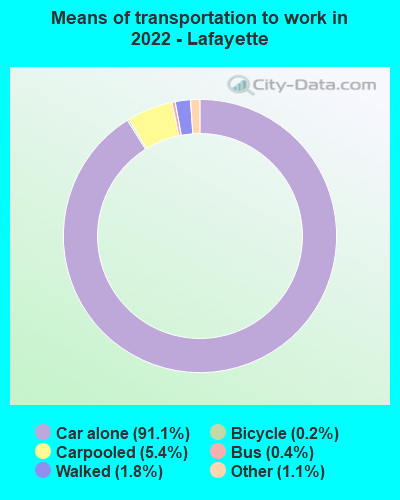
Means of transportation to work:
Drove a car alone: 88,553 (85.0%)Carpooled: 5,229 (5.0%)Bus : 278 (0.3%)Subway or elevated rail : 7 (0.0%)Long-distance train or commuter rail : 108 (0.1%)Taxi: 1,153 (1.1%)Bicycle: 166 (0.2%)Walked: 1,956 (1.9%)Worked at home: 6,406 (6.1%)
Unemployment by race in 2022
Unemployment rate for White non-Hispanic residents 3.2% Males3.2% FemalesUnemployment rate for Black residents 11.8% Males6.5% FemalesUnemployment rate for Asian residents 7.4% Males8.3% FemalesUnemployment rate for other race residents 9.6% Males0.6% FemalesUnemployment rate for two or more race residents 4.7% Males2.1% FemalesUnemployment rate for Hispanic or Latino residents 5.1% Males2.8% Females
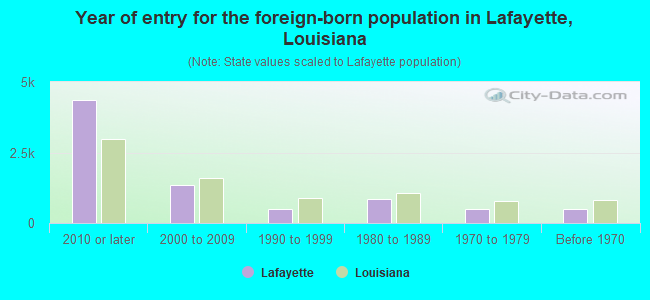
Year of entry for the foreign-born population in Lafayette, Louisiana
4,364 2010 or later 1,363 2000 to 2009 497 1990 to 1999 851 1980 to 1989 495 1970 to 1979 497 Before 1970
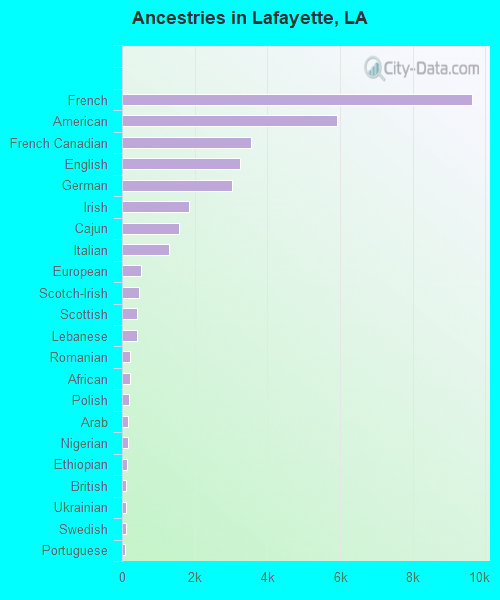
First ancestries reported:
French: 9,616 (13.4%)
American: 5,921 (8.2%)
French Canadian: 3,559 (5.0%)
English: 3,255 (4.5%)
German: 3,028 (4.2%)
Irish: 1,849 (2.6%)
Cajun: 1,560 (2.2%)
Italian: 1,288 (1.8%)
European: 533 (0.7%)
Scotch-Irish: 475 (0.7%)
Scottish: 404 (0.6%)
Lebanese: 399 (0.6%)
Romanian: 226 (0.3%)
African: 209 (0.3%)
Polish: 182 (0.3%)
Arab: 169 (0.2%)
Nigerian: 167 (0.2%)
Ethiopian: 135 (0.2%)
British: 117 (0.2%)
Ukrainian: 105 (0.1%)
Swedish: 101 (0.1%)
Portuguese: 93 (0.1%)
Canadian: 78 (0.1%)
Dutch: 77 (0.1%)
Scandinavian: 65 (0.09%)
Eastern European: 49 (0.07%)
Haitian: 45 (0.06%)
Iraqi: 43 (0.06%)
Swiss: 41 (0.06%)
Norwegian: 38 (0.05%)
Iranian: 38 (0.05%)
Brazilian: 38 (0.05%)
Palestinian: 37 (0.05%)
Jamaican: 35 (0.05%)
Russian: 30 (0.04%)
Northern European: 27 (0.04%)
Trinidadian and Tobagonian: 25 (0.03%)
Jordanian: 22 (0.03%)
Maltese: 22 (0.03%)
Greek: 22 (0.03%)
Danish: 19 (0.03%)
Slovak: 17 (0.02%)
South African: 16 (0.02%)
Welsh: 15 (0.02%)
Australian: 15 (0.02%)
Belgian: 14 (0.02%)
Syrian: 8 (0.01%)
Bulgarian: 7 (0.01%)
Czechoslovakian: 5 (0.01%)
West Indian: 5 (0.01%)
Most common places of birth for foreign-born residents (%): Honduras Lafayette:
19.3% (1,375)Louisiana:
18.9% (37,225)
India Lafayette:
13.8% (982)Louisiana:
3.9% (7,741)
Venezuela Lafayette:
7.4% (526)Louisiana:
0.8% (1,538)
Vietnam Lafayette:
5.5% (391)Louisiana:
9.2% (18,115)
Mexico Lafayette:
4.7% (337)Louisiana:
12.1% (23,732)
China, excluding Hong Kong and Taiwan Lafayette:
4.4% (316)Louisiana:
3.4% (6,779)
Ecuador Lafayette:
3.7% (267)Louisiana:
0.6% (1,196)
Nigeria Lafayette:
2.8% (199)Louisiana:
1.0% (2,002)
Jordan Lafayette:
2.3% (165)Louisiana:
0.7% (1,370)
Guatemala Lafayette:
2.3% (163)Louisiana:
2.8% (5,576)
Other Western Asia Lafayette:
2.2% (155)Louisiana:
0.1% (237)
Romania Lafayette:
2.1% (147)Louisiana:
0.4% (844)
Philippines Lafayette:
2.0% (143)Louisiana:
3.1% (6,086)
Canada Lafayette:
2.0% (142)Louisiana:
1.5% (2,933)
Ethiopia Lafayette:
1.8% (131)Louisiana:
0.5% (892)
Cuba Lafayette:
1.7% (118)Louisiana:
3.1% (6,172)
Israel Lafayette:
1.6% (116)Louisiana:
0.5% (901)
Place of birth for U.S.-born residents:
This state: 97,901Other state: 16,560Northeast: 1,944Midwest: 1,892South: 11,456West: 1,268 83.2% of Lafayette residents lived in the same house 1 years ago.
Out of people who lived in different houses, 36.2% lived in this county.
Out of people who lived in different counties, 66.5% lived in Louisiana.
Lafayette:
83.2%State average:
88.3%
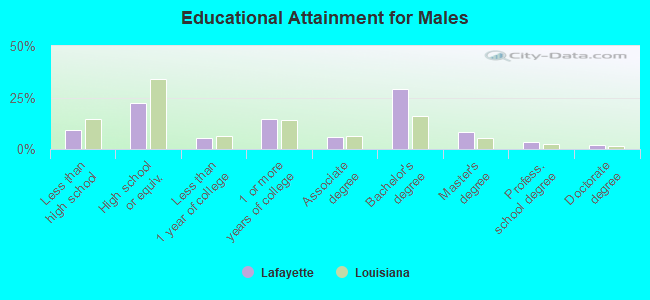
Education attainment for males 25 years and older:
No schooling: 144Nursery to 4th grade: 265th and 6th grade: 1247th and 8th grade: 6219th grade: 34510th grade: 1,30111th grade: 50912th grade, no diploma: 671High school graduate (or equivalency): 9,257Less than 1 year of college: 2,221Some college more than 1 year, no degree: 6,002Associate degree: 2,501Bachelor's degree: 12,050Master's degree: 3,476Professional school degree: 1,334Doctorate degree: 726
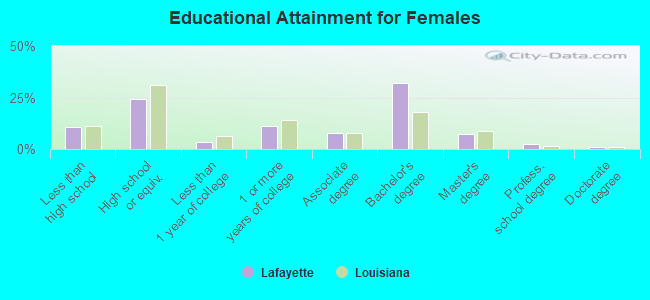
Education attainment for females 25 years and older:
No schooling: 77Nursery to 4th grade: 3385th and 6th grade: 417th and 8th grade: 3729th grade: 73410th grade: 1,80211th grade: 90212th grade, no diploma: 281High school graduate (or equivalency): 10,287Less than 1 year of college: 1,466Some college more than 1 year, no degree: 4,712Associate degree: 3,309Bachelor's degree: 13,683Master's degree: 3,163Professional school degree: 1,017Doctorate degree: 349
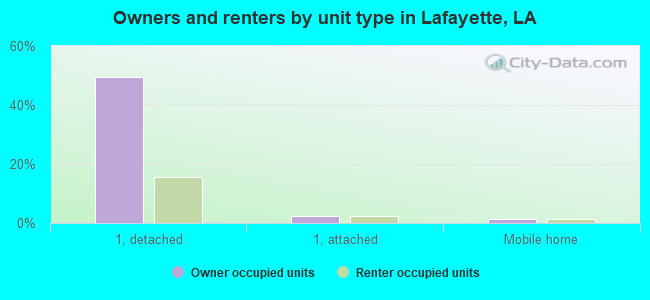
Housing units in structures:
One, detached: 39,105One, attached: 2,958Two: 1,7543 or 4: 3,0705 to 9: 4,77510 to 19: 3,37820 to 49: 2,23450 or more: 2,138Mobile homes: 814Median worth of mobile homes: $27,100
Housing units lacking complete kitchen facilities in 2022: 1.0%House/condo owner moved in on average 14 years ago
Renter moved in on average 2 years ago
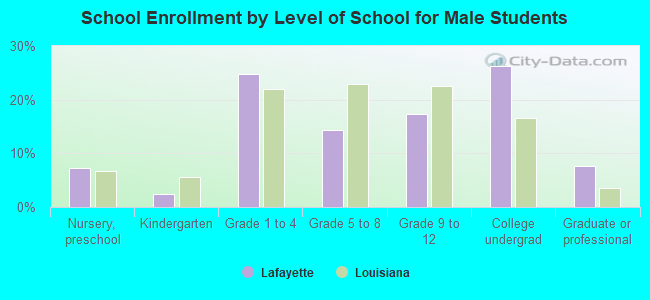
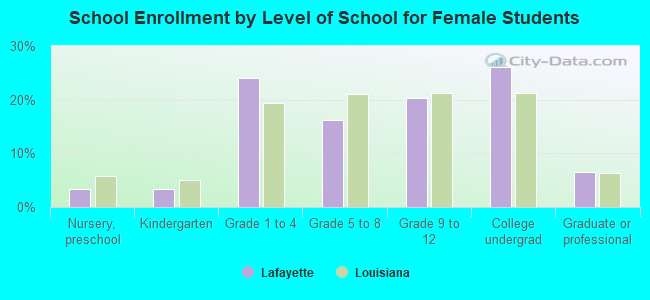
Private vs. public school enrollment:
Students in private schools in grades 1 to 8 (elementary and middle school): 2,850 Here:
23.3%Louisiana:
19.6%
Students in private schools in grades 9 to 12 (high school): 1,908 Here:
33.0%Louisiana:
18.3%
Students in private undergraduate colleges: 659