Lake Quinault, WA (Washington) Houses and Residents
| Lake Quinault: | $255,912 |
| Washington: | $569,500 |
Total population: 810 (Urban population: 0, Rural population: 738 (4 farm, 734 nonfarm))
Houses: 477 (293 occupied: 187 owner occupied, 106 renter occupied)
| % of renters here: | 36% |
| State: | 36% |
Housing density: 2 houses/condos per square mile
Median price asked for vacant for-sale houses and condos in 2022 in this county: $220,515.
Median contract rent in 2022: $735 (lower quartile is $548, upper quartile is $839)
Median rent asked for vacant for-rent units in 2022: $457
Median gross rent in Lake Quinault, WA in 2022: $841
Housing units in Lake Quinault with a mortgage: 48 (3 second mortgage, 7 home equity loan, 2 both second mortgage and home equity loan)
Houses without a mortgage: 61


Household type by relationship:
Households: 70,066- In family households: 57,224 (12,673 male householders, 5,820 female householders)
13,382 spouses, 18,151 children (16,168 natural, 673 adopted, 1,310 stepchildren), 1,752 grandchildren, 646 brothers or sisters, 508 parents, foster children, 974 other relatives, 2,882 non-relatives
- In nonfamily households: 12,842 (5,095 male householders (3,774 living alone)), 4,991 female householders (4,102 living alone)), 2,756 nonrelatives
- In group quarters: 2,731 (2,477 institutionalized population)
10,454 married couples with children.
4,757 single-parent households (1,315 men, 3,442 women).
94.1% of residents of Lake Quinault speak English at home.
5.1% of residents speak Spanish at home (36% speak English very well, 22% speak English well, 31% speak English not well, 11% don't speak English at all).
0.8% of residents speak other Indo-European language at home (100% speak English very well).
Foreign born population: 44 (5.2%)
(40.9% of them are naturalized citizens)
| Here: | 5.2 |
| State: | 6.5 |
| Here: | 4.1 |
| State: | 3.9 |

- Bedrooms in owner-occupied houses and condos in Lake Quinault, Washington
- 5no bedroom
- 111 bedroom
- 412 bedrooms
- 1023 bedrooms
- 244 bedrooms
- 45+ bedrooms

- Bedrooms in renter-occupied apartments in Lake Quinault, Washington
- 3no bedroom
- 71 bedroom
- 382 bedrooms
- 453 bedrooms
- 44 bedrooms
- 95+ bedrooms

- Cars and other vehicles available in Lake Quinault in owner-occupied houses/condos
- 5no vehicle
- 551 vehicle
- 812 vehicles
- 433 vehicles
- 24 vehicles
- 15+ vehicles

- Cars and other vehicles available in Lake Quinault in renter-occupied apartments
- 6no vehicle
- 621 vehicle
- 332 vehicles
- 23 vehicles
- 34 vehicles
- 05+ vehicles

- Rooms in owner-occupied houses in Lake Quinault, Washington
- 11 room
- 42 rooms
- 113 rooms
- 204 rooms
- 475 rooms
- 486 rooms
- 307 rooms
- 108 rooms
- 169+ rooms

- Rooms in renter-occupied apartments in Lake Quinault, Washington
- 01 room
- 32 rooms
- 33 rooms
- 404 rooms
- 275 rooms
- 246 rooms
- 57 rooms
- 28 rooms
- 29+ rooms


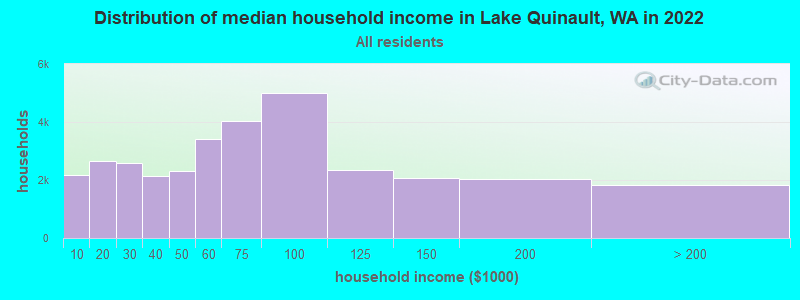
Lake Quinault, WA household income distribution

- 2,169Less than $10,000
- 2,647$10,000 to $19,999
- 2,603$20,000 to $29,999
- 2,121$30,000 to $39,999
- 2,317$40,000 to $49,999
- 3,401$50,000 to $59,999
- 4,022$60,000 to $74,999
- 4,988$75,000 to $99,999
- 2,356$100,000 to $124,999
- 2,075$125,000 to $149,999
- 2,051$150,000 to $199,999
- 1,818$200,000 or more
Percentage of workers working in this county: 88.6%
Number of people working at home: 66 (15.8% of all workers)
Travel time to work (commute)
- Less than 5 minutes: 34
- 5 to 9 minutes: 40
- 10 to 14 minutes: 66
- 15 to 19 minutes: 48
- 20 to 24 minutes: 26
- 25 to 29 minutes: 2
- 30 to 34 minutes: 17
- 35 to 39 minutes: 6
- 40 to 44 minutes: 3
- 45 to 59 minutes: 23
- 60 to 89 minutes: 58
- 90 or more minutes: 12
Means of transportation to work:
- Drove a car alone: 244 (70.3%)
- Carpooled: 54 (15.6%)
- Bus or trolley bus: 7 (2.0%)
- Walked: 25 (7.2%)
- Other means: 5 (1.4%)
- Worked at home: 12 (3.5%)


- Year of entry for the foreign-born population in Lake Quinault, Washington
- 131995 to March 2000
- 01990 to 1994
- 11985 to 1989
- 41980 to 1984
- 01975 to 1979
- 21970 to 1974
- 21965 to 1969
- 6Before 1965
Most common places of birth for foreign-born residents (%):
| Lake Quinault: | 64.3% (18) |
| Washington: | 24.1% (148,115) |
| Lake Quinault: | 14.3% (4) |
| Washington: | 0.2% (1,344) |
| Lake Quinault: | 14.3% (4) |
| Washington: | 3.4% (21,167) |
| Lake Quinault: | 7.1% (2) |
| Washington: | 0.0% (170) |
Place of birth for U.S.-born residents:
- This state: 479
- Other state: 229
- Northeast: 11
- Midwest: 48
- South: 29
- West: 141
71% of Lake Quinault residents lived in the same house 5 years ago.
Out of people who lived in different houses, 72% lived in this county.
Out of people who lived in different counties, 61% lived in Washington.
Education attainment for males 25 years and older:
- No schooling: 0
- Nursery to 4th grade: 1
- 5th and 6th grade: 0
- 7th and 8th grade: 10
- 9th grade: 6
- 10th grade: 10
- 11th grade: 5
- 12th grade, no diploma: 23
- High school graduate (or equivalency): 99
- Less than 1 year of college: 19
- Some college more than 1 year, no degree: 29
- Associate degree: 24
- Bachelor's degree: 19
- Master's degree: 3
- Professional school degree: 2
- Doctorate degree: 2

Education attainment for females 25 years and older:
- No schooling: 2
- Nursery to 4th grade: 0
- 5th and 6th grade: 1
- 7th and 8th grade: 11
- 9th grade: 2
- 10th grade: 6
- 11th grade: 1
- 12th grade, no diploma: 25
- High school graduate (or equivalency): 53
- Less than 1 year of college: 23
- Some college more than 1 year, no degree: 47
- Associate degree: 26
- Bachelor's degree: 26
- Master's degree: 6
- Professional school degree: 3
- Doctorate degree: 0


Housing units in structures:
- One, detached: 341
- One, attached: 9
- Two: 9
- 3 or 4: 3
- Mobile homes: 107
- Boats, RVs, vans, etc.: 8
Median worth of mobile homes: $159,000
Housing units lacking complete kitchen facilities: 3.1%

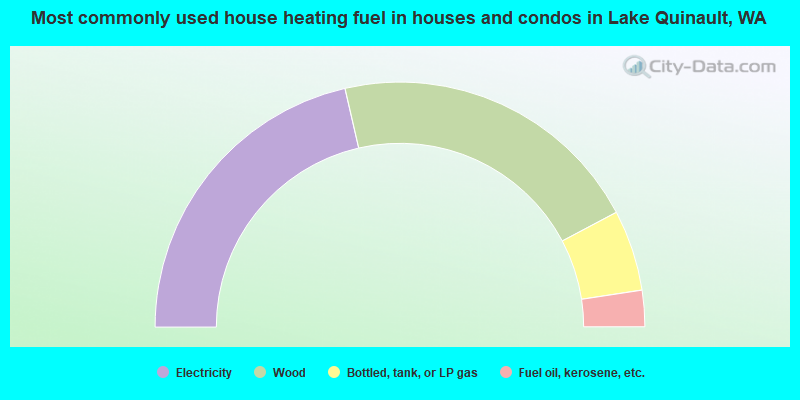
- 42.8%Electricity
- 41.7%Wood
- 10.7%Bottled, tank, or LP gas
- 4.8%Fuel oil, kerosene, etc.
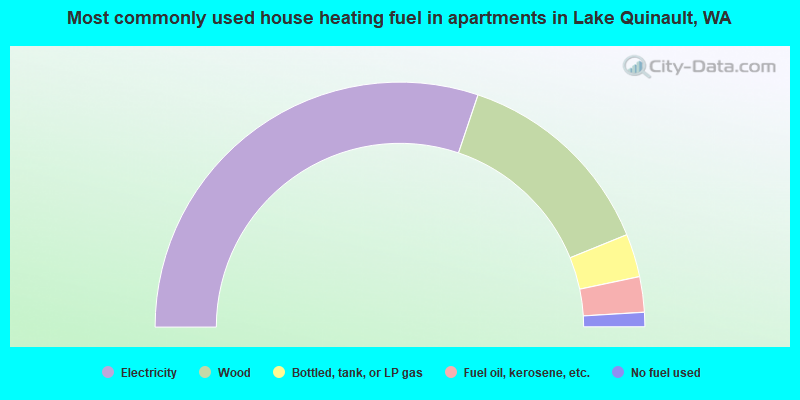
- 60.4%Electricity
- 27.4%Wood
- 5.7%Bottled, tank, or LP gas
- 4.7%Fuel oil, kerosene, etc.
- 1.9%No fuel used
Private vs. public school enrollment:
| Here: | 0.0% |
| Washington: | 9.2% |
| Here: | 3.3% |
| Washington: | 7.0% |
| Here: | 20.0% |
| Washington: | 15.7% |


