Lake Ridge, VA (Virginia) Houses and Residents
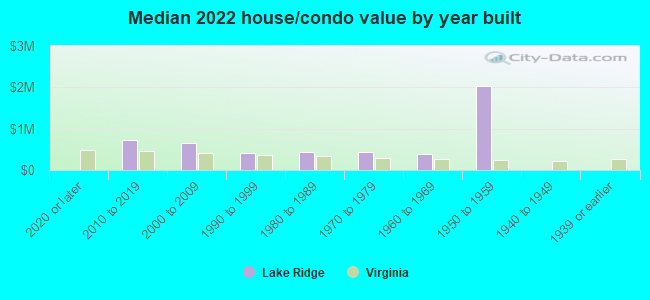
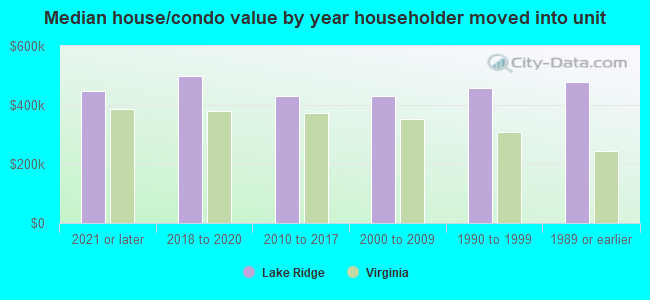
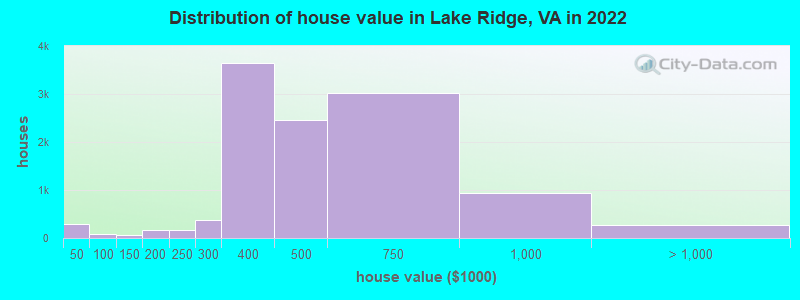
Estimated median house or condo value in 2022: $450,501 (it was $154,500 in 2000 )
Lake Ridge:
$450,501Virginia:
$365,700
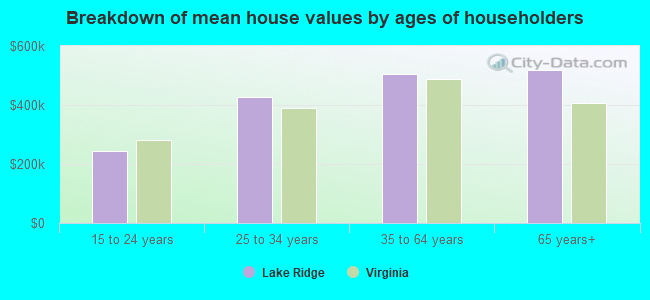
Lower value quartile - upper value quartile: $355,291 - $594,946Mean price in 2022: Detached houses: $598,947 Here:
$598,947State:
$472,865
Townhouses or other attached units: $397,061 Here:
$397,061State:
$457,437
In 2-unit structures: $550,358 Here:
$550,358State:
$396,289
In 3-to-4-unit structures: $271,671 Here:
$271,671State:
$252,346
In 5-or-more-unit structures: $265,208 Here:
$265,208State:
$382,551
Mobile homes: $95,928 Here:
$95,928State:
$100,736
Total population: 41,058 (Urban population: 30,579, Rural population: 0)
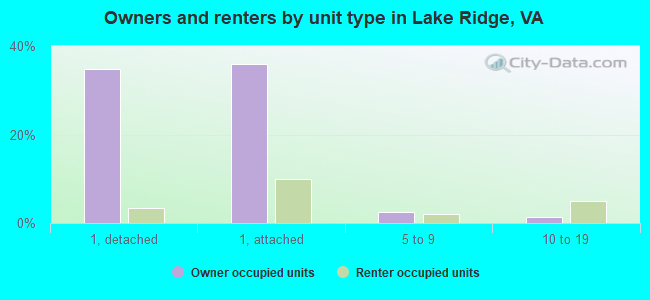
Houses: 16,531 (16,026 occupied: 12,108 owner occupied, 4,000 renter occupied )
% of renters here:
25%State:
33%
Housing density: 2,006 houses/condos per square mile
Median price asked for vacant for-sale houses and condos in 2022: $473,717.
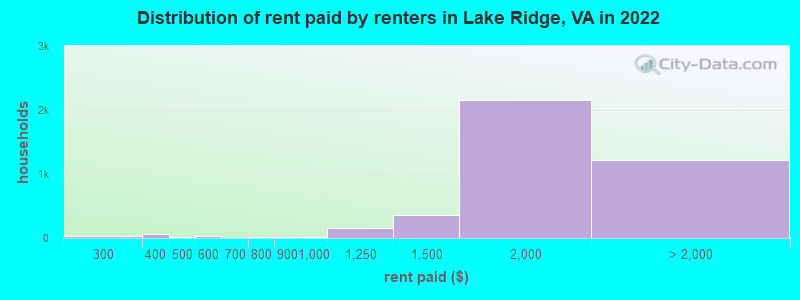
Median contract rent in 2022: $1,780 (lower quartile is $1,504, upper quartile is over $2,000)
Median rent asked for vacant for-rent units in 2022: $2,572
Median gross rent in Lake Ridge, VA in 2022: $1,899
Housing units in Lake Ridge with a mortgage: 9,285 (899 second mortgage, 0 home equity loan, 844 both second mortgage and home equity loan )Houses without a mortgage: 105
Median household income for houses/condos with a mortgage: $133,846
Median household income for apartments without a mortgage: $112,380
Median monthly housing costs: $1,929
Data:
Median house or condo value ($)
Median house or condo value ($ change since 2000)
Median house or condo value ($) - White
Median house or condo value ($) - Black or African American
Median house or condo value ($) - Asian
Median house or condo value ($) - Hispanic or Latino
Median house or condo value ($) - American Indian and Alaska Native
Median house or condo value ($) - Multirace
Median house or condo value ($) - Other Race
Median price asked for mobile homes ($)
Household density (households per square mile)
Mean house or condo value by units in structure - 1, detached ($)
Mean house or condo value by units in structure - 1, attached ($)
Mean house or condo value by units in structure - 2 ($)
Mean house or condo value by units in structure by units in structure - 3 or 4 ($)
Mean house or condo value by units in structure - 5 or more ($)
Mean house or condo value by units in structure - Boat, RV, van, etc. ($)
Mean house or condo value by units in structure - Mobile home ($)
Median contract rent ($)
Median contract rent - Lower quartile ($)
Median contract rent - Upper quartile ($)
Median gross rent ($)
Urban houses (%)
Rural houses (%)
Houses occupied (%)
Houses occupied (% change since 2000)
Houses owner occupied (%)
Houses owner occupied (% change since 2000)
Houses renter occupied (%)
Houses renter occupied (% change since 2000)
Vacant housing units - For rent (%)
Vacant housing units - For rent (% change since 2000)
Vacant housing units - For sale only (%)
Vacant housing units - For sale only (% change since 2000)
Vacant housing units - Rented or sold, not occupied (%)
Vacant housing units - Rented or sold, not occupied (% change since 2000)
Vacant housing units - For seasonal, recreational, or occasional use (%)
Vacant housing units - For seasonal, recreational, or occasional use (% change since 2000)
Vacant housing units - For migrant workers (%)
Vacant housing units - For migrant workers (% change since 2000)
Vacant housing units - Other vacant (%)
Vacant housing units - Other vacant (% change since 2000)
Median monthly housing costs ($)
Median household income for houses/condos with a mortgage ($)
Median household income for houses/condos without a mortgage ($)
Median household income ($)
Median household income ($) - White
Median household income ($) - Black or African American
Median household income ($) - Asian
Median household income ($) - Hispanic or Latino
Median household income ($) - American Indian and Alaska Native
Median household income ($) - Multirace
Median household income ($) - Other Race
Mortgage status - with mortgage (%)
Mortgage status - with second mortgage (%)
Mortgage status - with home equity loan (%)
Mortgage status - with both second mortgage and home equity loan (%)
Mortgage status - without a mortgage (%)
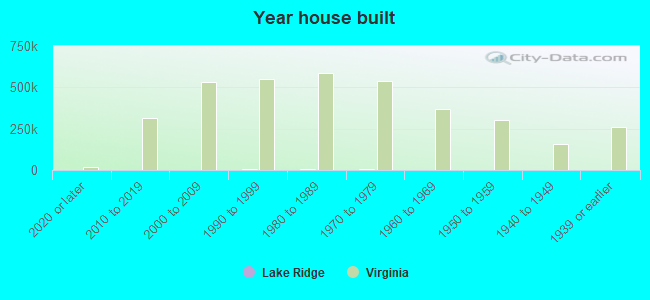
Median year house/condo built
Median year apartment built
Household type by relationship - Male householder living alone (%)
Household type by relationship - Male householder not living alone (%)
Household type by relationship - Female householder living alone (%)
Household type by relationship - Female householder not living alone (%)
Household type by relationship - Opposite-Sex spouse (%)
Household type by relationship - Same-Sex spouse (%)
Household type by relationship - Opposite-Sex unmarried partner (%)
Household type by relationship - Same-Sex unmarried partner (%)
Household type by relationship - In group quarters (%)
Size of family households - 2-person household (%)
Size of family households - 3-person household (%)
Size of family households - 4-person household (%)
Size of family households - 5-person household (%)
Size of family households - 6-person household (%)
Size of family households - 7-or-more-person household (%)
Size of nonfamily households - 1-person household (%)
Size of nonfamily households - 2-person household (%)
Size of nonfamily households - 3-person household (%)
Size of nonfamily households - 4-person household (%)
Size of nonfamily households - 5-person household (%)
Size of nonfamily households - 6-person household (%)
Size of nonfamily households - 7-or-moreperson household (%)
Year house built - Built 2010 or later (%)
Year house built - Built 2000 to 2009 (%)
Year house built - Built 1990 to 1999 (%)
Year house built - Built 1980 to 1989 (%)
Year house built - Built 1970 to 1979 (%)
Year house built - Built 1960 to 1969 (%)
Year house built - Built 1950 to 1959 (%)
Year house built - Built 1940 to 1949 (%)
Year house built - Built 1939 or earlier (%)
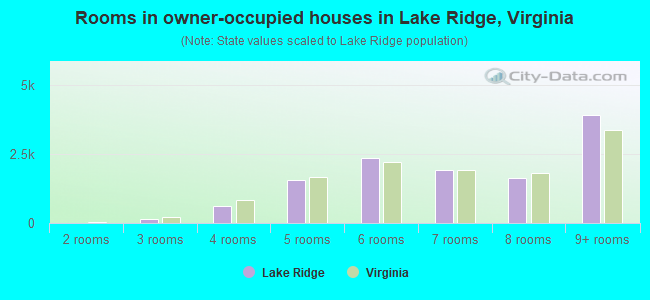
Median number of rooms in houses and condos
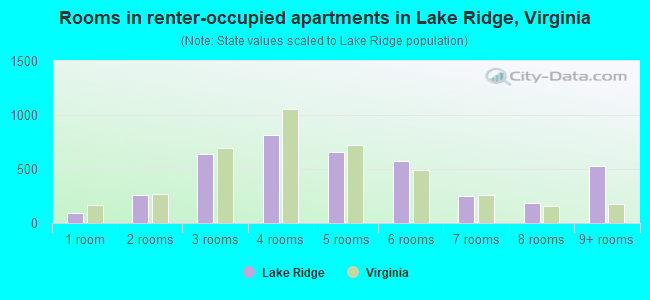
Median number of rooms in apartments
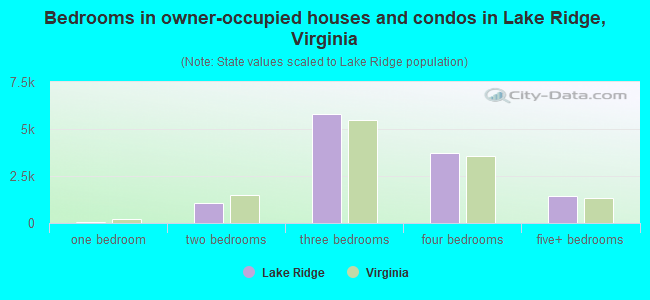
Median number of bedrooms in owner occupied houses
Mean number of bedrooms in owner occupied houses
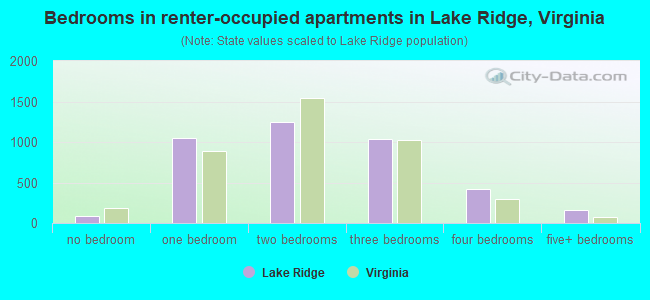
Median number of bedrooms in renter occupied houses
Mean number of bedrooms in renter occupied houses
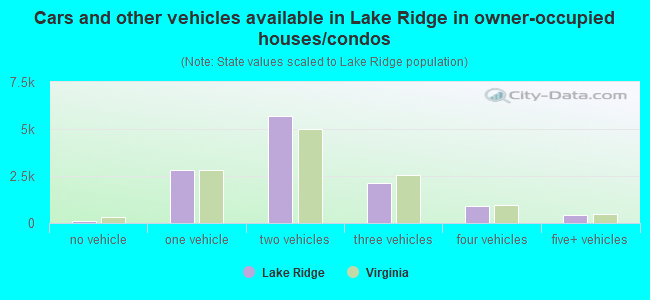
Median number of vehichles in owner occupied houses
Mean number of vehichles in owner occupied houses
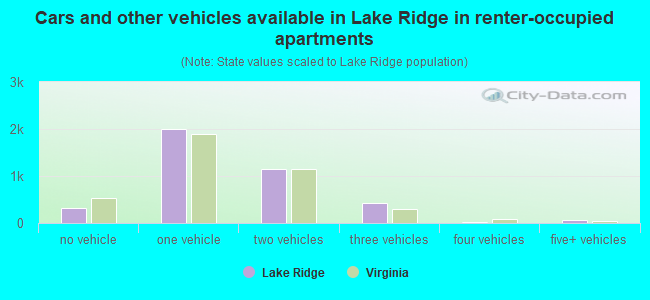
Median number of vehichles in renter occupied houses
Mean number of vehichles in renter occupied houses
Rooms in owner-occupied houses - 1 room (%)
Rooms in owner-occupied houses - 2 rooms (%)
Rooms in owner-occupied houses - 3 rooms (%)
Rooms in owner-occupied houses - 4 rooms (%)
Rooms in owner-occupied houses - 5 rooms (%)
Rooms in owner-occupied houses - 6 rooms (%)
Rooms in owner-occupied houses - 7 rooms (%)
Rooms in owner-occupied houses - 8 rooms (%)
Rooms in owner-occupied houses - 9+ rooms (%)
Rooms in renter-occupied houses - 1 room (%)
Rooms in renter-occupied houses - 2 rooms (%)
Rooms in renter-occupied houses - 3 rooms (%)
Rooms in renter-occupied houses - 4 rooms (%)
Rooms in renter-occupied houses - 5 rooms (%)
Rooms in renter-occupied houses - 6 rooms (%)
Rooms in renter-occupied houses - 7 rooms (%)
Rooms in renter-occupied houses - 8 rooms (%)
Rooms in renter-occupied houses - 9+ rooms (%)
Bedrooms in owner-occupied houses - no bedrooms (%)
Bedrooms in owner-occupied houses - 1 bedroom (%)
Bedrooms in owner-occupied houses - 2 bedrooms (%)
Bedrooms in owner-occupied houses - 3 bedrooms (%)
Bedrooms in owner-occupied houses - 4 bedrooms (%)
Bedrooms in owner-occupied houses - 5+ bedrooms (%)
Bedrooms in renter-occupied houses - no bedrooms (%)
Bedrooms in renter-occupied houses - 1 bedroom (%)
Bedrooms in renter-occupied houses - 2 bedrooms (%)
Bedrooms in renter-occupied houses - 3 bedrooms (%)
Bedrooms in renter-occupied houses - 4 bedrooms (%)
Bedrooms in renter-occupied houses - 5+ bedrooms (%)
Vehicles available in owner-occupied houses - no vehicle available (%)
Vehicles available in owner-occupied houses - 1 vehicle available(%)
Vehicles available in owner-occupied houses - 2 Vehicles available (%)
Vehicles available in owner-occupied houses - 3 Vehicles available (%)
Vehicles available in owner-occupied houses - 4 Vehicles available (%)
Vehicles available in owner-occupied houses - 5+ Vehicles available (%)
Vehicles available in renter-occupied houses - no vehicle available (%)
Vehicles available in renter-occupied houses - 1 vehicle available (%)
Vehicles available in renter-occupied houses - 2 Vehicles available (%)
Vehicles available in renter-occupied houses - 3 Vehicles available (%)
Vehicles available in renter-occupied houses - 4 Vehicles available (%)
Vehicles available in renter-occupied houses - 5+ Vehicles available (%)
Housing units in structures - 1, detached (%)
Housing units in structures - 1, attached (%)
Housing units in structures - 2 (%)
Housing units in structures - 3 or 4 (%)
Housing units in structures - 5 to 9 (%)
Housing units in structures - 10 to 19 (%)
Housing units in structures - 20 to 49 (%)
Housing units in structures - 50 or more (%)
Housing units in structures - Mobile home (%)
Housing units in structures - Boat, RV, van, etc. (%)
Housing units in structures - Owners - 1, detached (%)
Housing units in structures - Owners - 1, attached (%)
Housing units in structures - Owners - 2 (%)
Housing units in structures - Owners - 3 or 4 (%)
Housing units in structures - Owners - 5 to 9 (%)
Housing units in structures - Owners - 10 to 19 (%)
Housing units in structures - Owners - 20 to 49 (%)
Housing units in structures - Owners - 50 or more (%)
Housing units in structures - Owners - Mobile home (%)
Housing units in structures - Owners - Boat, RV, van, etc. (%)
Housing units in structures - Renters - 1, detached (%)
Housing units in structures - Renters - 1, attached (%)
Housing units in structures - Renters - 2 (%)
Housing units in structures - Renters - 3 or 4 (%)
Housing units in structures - Renters - 5 to 9 (%)
Housing units in structures - Renters - 10 to 19 (%)
Housing units in structures - Renters - 20 to 49 (%)
Housing units in structures - Renters - 50 or more (%)
Housing units in structures - Renters - Mobile home (%)
Housing units in structures - Renters - Boat, RV, van, etc. (%)
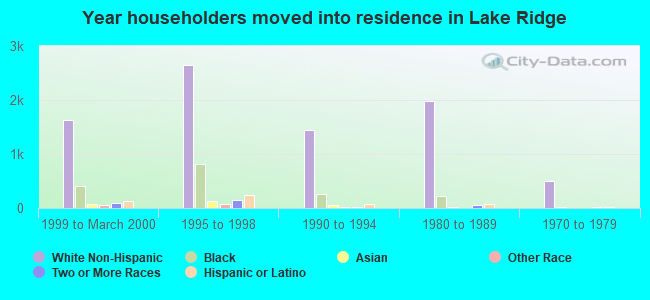
House/condo owner moved in on average (years ago)
Renter moved in on average (years ago)
Year householder moved into unit - Moved in 1999 to March 2000 (%)
Year householder moved into unit - Moved in 1999 to March 2000 (%) - White
Year householder moved into unit - Moved in 1999 to March 2000 (%) - Black or African American
Year householder moved into unit - Moved in 1999 to March 2000 (%) - Asian
Year householder moved into unit - Moved in 1999 to March 2000 (%) - Hispanic or Latino
Year householder moved into unit - Moved in 1999 to March 2000 (%) - American Indian and Alaska Native
Year householder moved into unit - Moved in 1999 to March 2000 (%) - Multirace
Year householder moved into unit - Moved in 1999 to March 2000 (%) - Other Race
Year householder moved into unit - Moved in 1995 to 1998 (%)
Year householder moved into unit - Moved in 1995 to 1998 (%) - White
Year householder moved into unit - Moved in 1995 to 1998 (%) - Black or African American
Year householder moved into unit - Moved in 1995 to 1998 (%) - Asian
Year householder moved into unit - Moved in 1995 to 1998 (%) - Hispanic or Latino
Year householder moved into unit - Moved in 1995 to 1998 (%) - American Indian and Alaska Native
Year householder moved into unit - Moved in 1995 to 1998 (%) - Multirace
Year householder moved into unit - Moved in 1995 to 1998 (%) - Other Race
Year householder moved into unit - Moved in 1990 to 1994 (%)
Year householder moved into unit - Moved in 1990 to 1994 (%) - White
Year householder moved into unit - Moved in 1990 to 1994 (%) - Black or African American
Year householder moved into unit - Moved in 1990 to 1994 (%) - Asian
Year householder moved into unit - Moved in 1990 to 1994 (%) - Hispanic or Latino
Year householder moved into unit - Moved in 1990 to 1994 (%) - American Indian and Alaska Native
Year householder moved into unit - Moved in 1990 to 1994 (%) - Multirace
Year householder moved into unit - Moved in 1990 to 1994 (%) - Other Race
Year householder moved into unit - Moved in 1980 to 1989 (%)
Year householder moved into unit - Moved in 1980 to 1989 (%) - White
Year householder moved into unit - Moved in 1980 to 1989 (%) - Black or African American
Year householder moved into unit - Moved in 1980 to 1989 (%) - Asian
Year householder moved into unit - Moved in 1980 to 1989 (%) - Hispanic or Latino
Year householder moved into unit - Moved in 1980 to 1989 (%) - American Indian and Alaska Native
Year householder moved into unit - Moved in 1980 to 1989 (%) - Multirace
Year householder moved into unit - Moved in 1980 to 1989 (%) - Other Race
Year householder moved into unit - Moved in 1970 to 1979 (%)
Year householder moved into unit - Moved in 1970 to 1979 (%) - White
Year householder moved into unit - Moved in 1970 to 1979 (%) - Black or African American
Year householder moved into unit - Moved in 1970 to 1979 (%) - Asian
Year householder moved into unit - Moved in 1970 to 1979 (%) - Hispanic or Latino
Year householder moved into unit - Moved in 1970 to 1979 (%) - American Indian and Alaska Native
Year householder moved into unit - Moved in 1970 to 1979 (%) - Multirace
Year householder moved into unit - Moved in 1970 to 1979 (%) - Other Race
Year householder moved into unit - Moved in 1969 or earlier (%)
Year householder moved into unit - Moved in 1969 or earlier (%) - White
Year householder moved into unit - Moved in 1969 or earlier (%) - Black or African American
Year householder moved into unit - Moved in 1969 or earlier (%) - Asian
Year householder moved into unit - Moved in 1969 or earlier (%) - Hispanic or Latino
Year householder moved into unit - Moved in 1969 or earlier (%) - American Indian and Alaska Native
Year householder moved into unit - Moved in 1969 or earlier (%) - Multirace
Year householder moved into unit - Moved in 1969 or earlier (%) - Other Race
Housing units lacking complete plumbing facilities (%)
Housing units lacking complete kitchen facilities (%)
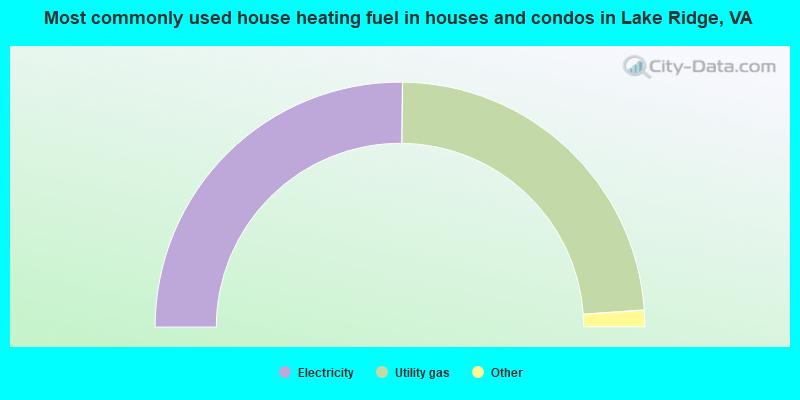
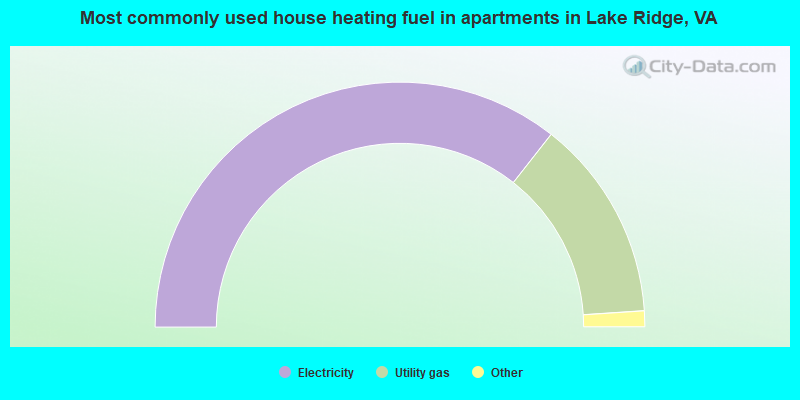
House heating fuel used in houses and condos - Utility gas (%)
House heating fuel used in houses and condos - Bottled, tank, or LP gas (%)
House heating fuel used in houses and condos - Electricity (%)
House heating fuel used in houses and condos - Fuel oil, kerosene, etc. (%)
House heating fuel used in houses and condos - Coal or coke (%)
House heating fuel used in houses and condos - Wood (%)
House heating fuel used in houses and condos - Solar energy (%)
House heating fuel used in houses and condos - Other fuel (%)
House heating fuel used in houses and condos - No fuel used (%)
House heating fuel used in apartments - Utility gas (%)
House heating fuel used in apartments - Bottled, tank, or LP gas (%)
House heating fuel used in apartments - Electricity (%)
House heating fuel used in apartments - Fuel oil, kerosene, etc. (%)
House heating fuel used in apartments - Coal or coke (%)
House heating fuel used in apartments - Wood (%)
House heating fuel used in apartments - Solar energy (%)
House heating fuel used in apartments - Other fuel (%)
House heating fuel used in apartments - No fuel used (%)
Median year house/condo built: 1985Median year apartment built: 1990Household type by relationship:
Households: 45,261
Male householders: 8,851 (1,741 living alone ), Female householders: 7,025 (2,110 living alone )8,318 spouses (8,291 opposite-sex spouses ), 694 unmarried partners , (694 opposite-sex unmarried partners ), 14,710 children (13,823 natural , 289 adopted , 597 stepchildren ), 656 grandchildren , 707 brothers or sisters , 1,046 parents , 50 foster children , 1,708 other relatives , 1,453 non-relatives In group quarters: 38
Size of family households: 4,310 2-persons , 2,610 3-persons , 2,524 4-persons , 1,169 5-persons , 549 6-persons , 306 7-or-more-persons .
Size of nonfamily households: 4,069 1-person , 556 2-persons , 31 3-persons , 64 4-persons .
6,715 married couples with children. single-parent households (645 men , 2,064 women ).
67.9% of residents of Lake Ridge speak English at home. of residents speak Spanish at home (67% speak English very well , 20% speak English well , 10% speak English not well , 2% don't speak English at all ).of residents speak other Indo-European language at home (77% speak English very well , 16% speak English well , 6% speak English not well , 1% don't speak English at all ).of residents speak Asian or Pacific Island language at home (61% speak English very well , 28% speak English well , 11% speak English not well ).of residents speak other language at home (66% speak English very well , 25% speak English well , 7% speak English not well , 2% don't speak English at all ).
Foreign born population: 10,327 (22.8%)of them are naturalized citizens )
Median number of rooms in houses and condos:
Median number of rooms in apartments
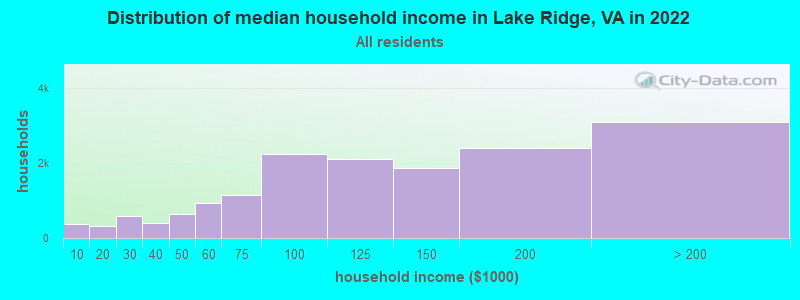
Lake Ridge, VA household income distribution 369 Less than $10,000331 $10,000 to $19,999580 $20,000 to $29,999390 $30,000 to $39,999636 $40,000 to $49,999928 $50,000 to $59,9991,158 $60,000 to $74,9992,242 $75,000 to $99,9992,101 $100,000 to $124,9991,861 $125,000 to $149,9992,404 $150,000 to $199,9993,088 $200,000 or more
Home value of owner - occupied houses in 2022 in Lake Ridge, VA 180 Less than $10,0002 $15,000 to $19,99914 $30,000 to $34,99950 $35,000 to $39,99941 $40,000 to $49,99936 $50,000 to $59,99964 $100,000 to $124,99954 $150,000 to $174,999119 $175,000 to $199,999158 $200,000 to $249,999384 $250,000 to $299,9993,648 $300,000 to $399,9992,456 $400,000 to $499,9993,029 $500,000 to $749,999929 $750,000 to $999,999179 $1,000,000 to $1,499,99987 $2,000,000 or moreRent paid by renters in 2022 in Lake Ridge, VA 8 $200 to $24915 $250 to $2996 $300 to $34948 $350 to $39913 $400 to $4499 $500 to $54923 $550 to $5998 $700 to $74920 $800 to $89922 $900 to $999154 $1,000 to $1,249359 $1,250 to $1,4992,159 $1,500 to $1,999685 $2,000 to $2,499121 $2,500 to $2,99979 $3,000 to $3,499241 $3,500 or more92 No cash rent
Percentage of workers working in this county: 46.0%Number of people working at home: 4,449 (18.6% of all workers )
Travel time to work (commute)
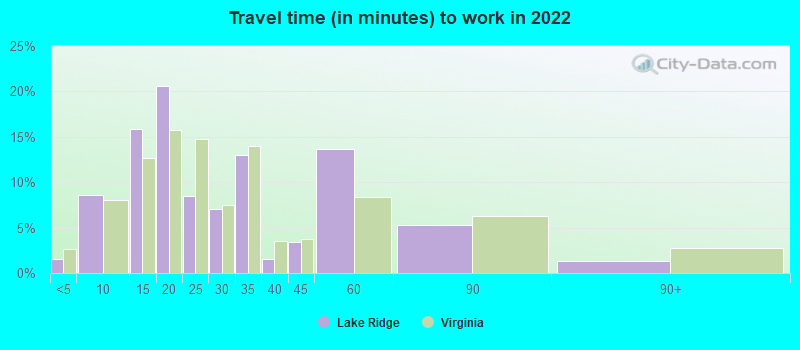
Less than 5 minutes: 1765 to 9 minutes: 85910 to 14 minutes: 98915 to 19 minutes: 1,84520 to 24 minutes: 1,53725 to 29 minutes: 70130 to 34 minutes: 3,06835 to 39 minutes: 68640 to 44 minutes: 2,04545 to 59 minutes: 3,50960 to 89 minutes: 3,41290 or more minutes: 453
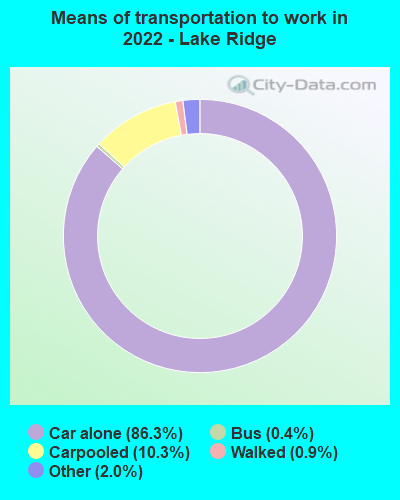
Means of transportation to work:
Drove a car alone: 4,849 (50.3%)Carpooled: 575 (6.0%)Bus : 13 (0.1%)Subway or elevated rail : 5 (0.1%)Taxi: 165 (1.7%)Walked: 47 (0.5%)Worked at home: 4,449 (46.2%)
Unemployment by race in 2022
Unemployment rate for White non-Hispanic residents 2.0% Males3.9% FemalesUnemployment rate for Black residents 3.5% Males4.7% FemalesUnemployment rate for Asian residents 5.4% Males3.9% FemalesUnemployment rate for other race residents 0.8% Males1.5% FemalesUnemployment rate for two or more race residents 3.3% Males1.9% FemalesUnemployment rate for Hispanic or Latino residents 6.0% Males1.3% Females
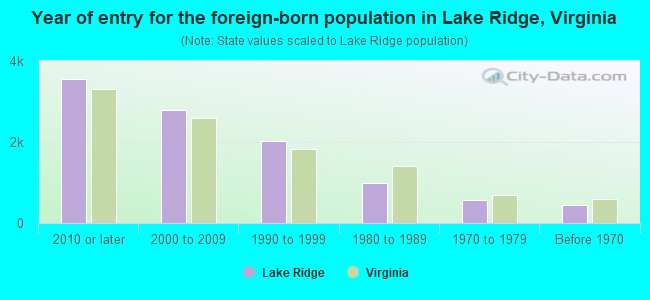
Year of entry for the foreign-born population in Lake Ridge, Virginia
3,557 2010 or later 2,797 2000 to 2009 2,031 1990 to 1999 992 1980 to 1989 572 1970 to 1979 451 Before 1970
First ancestries reported:
American: 1,440 (6.3%)
Ethiopian: 1,156 (5.1%)
English: 1,063 (4.7%)
Irish: 971 (4.3%)
German: 642 (2.8%)
Italian: 524 (2.3%)
Ghanaian: 489 (2.1%)
European: 434 (1.9%)
Lebanese: 424 (1.9%)
Romanian: 342 (1.5%)
Afghan: 319 (1.4%)
African: 247 (1.1%)
Polish: 235 (1.0%)
Nigerian: 234 (1.0%)
Iranian: 182 (0.8%)
Moroccan: 173 (0.8%)
Turkish: 151 (0.7%)
Scotch-Irish: 151 (0.7%)
British: 117 (0.5%)
Jamaican: 105 (0.5%)
Scottish: 88 (0.4%)
Portuguese: 88 (0.4%)
Dutch: 86 (0.4%)
Egyptian: 79 (0.3%)
Swedish: 72 (0.3%)
Haitian: 68 (0.3%)
West Indian: 63 (0.3%)
Ukrainian: 60 (0.3%)
Syrian: 55 (0.2%)
Greek: 54 (0.2%)
Arab: 48 (0.2%)
Armenian: 47 (0.2%)
Finnish: 46 (0.2%)
Russian: 42 (0.2%)
Canadian: 40 (0.2%)
Slovak: 38 (0.2%)
Albanian: 37 (0.2%)
Norwegian: 36 (0.2%)
Liberian: 36 (0.2%)
Sudanese: 32 (0.1%)
French: 30 (0.1%)
Belgian: 27 (0.1%)
Iraqi: 22 (0.10%)
Scandinavian: 19 (0.08%)
Czechoslovakian: 19 (0.08%)
Austrian: 19 (0.08%)
Sierra Leonean: 18 (0.08%)
Estonian: 16 (0.07%)
Danish: 15 (0.07%)
Hungarian: 14 (0.06%)
Trinidadian and Tobagonian: 14 (0.06%)
Eastern European: 11 (0.05%)
Slavic: 10 (0.04%)
Croatian: 10 (0.04%)
French Canadian: 8 (0.04%)
Serbian: 8 (0.04%)
Welsh: 8 (0.04%)
Swiss: 7 (0.03%)
Most common places of birth for foreign-born residents (%): El Salvador Lake Ridge:
13.9% (1,486)Virginia:
9.9% (107,534)
Ethiopia Lake Ridge:
8.6% (916)Virginia:
2.9% (32,082)
Afghanistan Lake Ridge:
4.3% (464)Virginia:
1.8% (19,426)
Argentina Lake Ridge:
4.1% (444)Virginia:
0.5% (4,997)
Eritrea Lake Ridge:
3.7% (397)Virginia:
0.3% (3,058)
Ghana Lake Ridge:
3.7% (395)Virginia:
1.6% (17,346)
Bolivia Lake Ridge:
3.7% (394)Virginia:
2.4% (25,722)
Peru Lake Ridge:
3.5% (378)Virginia:
2.4% (26,366)
Philippines Lake Ridge:
3.5% (374)Virginia:
4.8% (52,629)
Pakistan Lake Ridge:
3.3% (350)Virginia:
2.3% (24,582)
Lebanon Lake Ridge:
3.1% (330)Virginia:
0.5% (5,428)
Mexico Lake Ridge:
2.8% (297)Virginia:
5.3% (57,498)
Panama Lake Ridge:
2.6% (277)Virginia:
0.4% (4,196)
India Lake Ridge:
2.2% (237)Virginia:
9.0% (97,830)
Korea Lake Ridge:
2.0% (211)Virginia:
4.9% (52,857)
Romania Lake Ridge:
2.0% (211)Virginia:
0.3% (2,805)
Egypt Lake Ridge:
1.6% (171)Virginia:
0.9% (9,672)
Place of birth for U.S.-born residents:
This state: 15,422Other state: 17,810Northeast: 4,699Midwest: 3,556South: 6,587West: 3,038 88.4% of Lake Ridge residents lived in the same house 1 years ago.
Out of people who lived in different houses, 25.9% lived in this county.
Out of people who lived in different counties, 63.7% lived in Virginia.
Lake Ridge:
88.4%State average:
86.6%
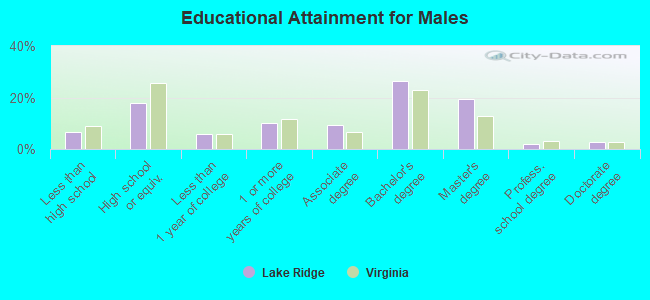
Education attainment for males 25 years and older:
No schooling: 169Nursery to 4th grade: 1665th and 6th grade: 1767th and 8th grade: 499th grade: 4910th grade: 2411th grade: 2312th grade, no diploma: 272High school graduate (or equivalency): 2,447Less than 1 year of college: 794Some college more than 1 year, no degree: 1,388Associate degree: 1,272Bachelor's degree: 3,634Master's degree: 2,700Professional school degree: 265Doctorate degree: 356
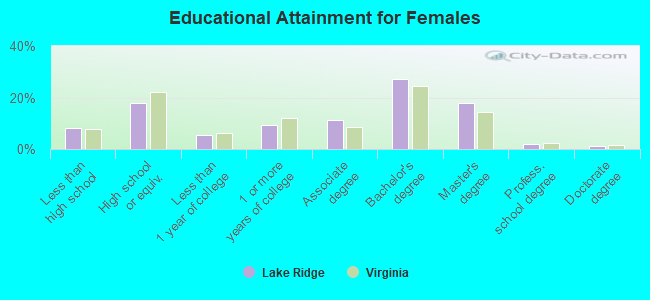
Education attainment for females 25 years and older:
No schooling: 500Nursery to 4th grade: 115th and 6th grade: 1517th and 8th grade: 1279th grade: 8910th grade: 6011th grade: 4112th grade, no diploma: 330High school graduate (or equivalency): 2,892Less than 1 year of college: 920Some college more than 1 year, no degree: 1,552Associate degree: 1,808Bachelor's degree: 4,430Master's degree: 2,936Professional school degree: 310Doctorate degree: 172
Housing units in structures:
One, detached: 6,354One, attached: 7,391Two: 113 or 4: 3925 to 9: 68710 to 19: 79120 to 49: 24350 or more: 558Mobile homes: 100Housing units lacking complete plumbing facilities in 2022: 0.1%Housing units lacking complete kitchen facilities in 2022: 0.2%House/condo owner moved in on average 11 years ago
Renter moved in on average 2 years ago
Private vs. public school enrollment:
Students in private schools in grades 1 to 8 (elementary and middle school): 698 Students in private schools in grades 9 to 12 (high school): 185 Students in private undergraduate colleges: 340